


 |
市場調查報告書
商品編碼
2116005
中東和非洲液化天然氣(LNG)燃料庫:市場佔有率分析、行業趨勢和統計數據以及成長預測(2026-2031 年)Middle-East And Africa Liquified Natural Gas (LNG) Bunkering - Market Share Analysis, Industry Trends & Statistics, Growth Forecasts (2026 - 2031) |
||||||

※ 本網頁內容可能與最新版本有所差異。詳細情況請與我們聯繫。
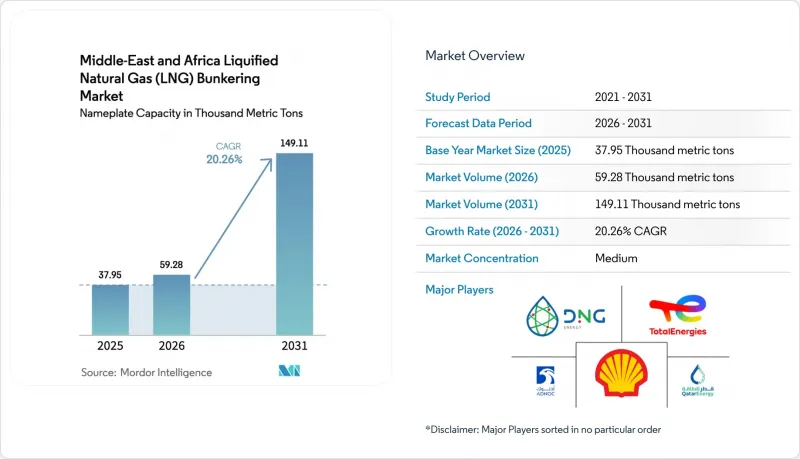
預計中東和非洲液化天然氣燃料庫市場規模(按額定容量計算)將從 2025 年的 37,950 公噸成長到 2026 年的 59,280 公噸,然後從 2026 年到 2031 年以 20.26% 的複合年成長率成長,達到 2031 年 1031 年。
本報告按最終用戶(油輪船隊、貨櫃船隊、散裝貨船和雜貨船隊、渡輪和近海支援船以及其他最終用戶)和地區(阿拉伯聯合大公國、沙烏地阿拉伯、阿曼、卡達、巴林、其他中東國家、南非、埃及、奈及利亞、肯亞以及其他非洲國家)進行細分。市場規模和預測以數量(公噸)為單位。
中東和非洲液化天然氣燃料庫市場的趨勢和洞察
國際海事組織對硫和溫室氣體(GHG)的更嚴格規定將加速液化天然氣的普及。
2020年,國際海事組織(IMO)將船用燃料的全球硫含量上限從3.5%降至0.5%,迫使業者在高成本的脫硫裝置、低硫燃油和液化天然氣(LNG)之間做出選擇。到2025年,已有超過600艘船舶使用LNG營運。鑑於IMO的2023年溫室氣體戰略旨在2050年實現航運業淨零排放,在氨和氫供應鏈成熟之前,LNG已成為最可行的合規方式。最終生命週期評估(LCA)顯示,LNG的「從油井到船尾」碳排放強度比重質燃油低20%,促使達飛輪船(CMA CGM)和地中海航運(MSC)等公司大規模訂購雙燃料船舶。 2024年,歐盟將航運業的排放納入其排放交易體系(ETS),價格上漲至每噸85歐元,使得使用高硫燃料進行歐洲長途航行變得無利可圖。因此,船東擴大簽訂液化天然氣加註契約,以降低碳排放成本的風險。
中東地區大規模擴建液化產能將降低燃料價格並擴大供應。
卡達北氣田的東、南、西三個階段預計到2027年將新增880億立方公尺/年的液化產能,使該國年產量達到1.42億噸,進一步鞏固主導地位。沙烏地阿拉伯計畫建造的拉斯阿爾蓋爾(Ras Al Qair)終端和阿拉伯聯合大公國的魯瓦伊斯(Ruwais)計畫預計到2029年將新增2,000萬噸/年的供應量。供應過剩已導致現貨LNG價格下跌。普氏能源資訊JKM指數預計2025年上半年平均價格為每百萬英熱單位(MMBtu)11.20美元,而2024年為17.50美元,這意味著其單次航行成本低於超低硫燃料油(VLSFO)。阿布達比國家石油公司(ADNOC)和殼牌等樞紐運營商目前提供多年期固定價格燃料供應契約,這降低了船東燃料成本的不確定性,並刺激了雙燃料船隊的擴張。
對低溫儲存和燃料加註資產的大量資本投資
陸上液化天然氣加註站的建造成本,包括儲槽、汽化設備和安全系統,通常在1億至1.5億美元之間,但這阻礙了在需求預測不明朗的港口進行投資。專用液化天然氣加註船的建設成本在5000萬至8000萬美元之間,貸款方在提供資金時通常要求簽訂購買70%產能的合約。德班的一項2025年可行性研究預測,土地徵用和授權將額外耗時18個月,這將延遲獲利並增加利息成本。拉各斯在未能獲得為期10年的客戶合約後,推遲了其加註計畫。東非小規模的港口也缺乏足夠的吞吐量來支撐獨立加註站的建設,這進一步加劇了「先有雞還是先有蛋」的難題,阻礙了液化天然氣加註市場的發展。
細分市場分析
預計到2025年,貨櫃船將佔LNG需求的41.1%,而油輪和散裝船預計將落後。在貨櫃船領域,達飛輪船(CMA CGM)計畫引進22艘LNG船舶,以及地中海航運(MSC)的船舶改裝計劃,都凸顯了市場對LNG燃料的長期信心。由於班輪公司能夠將LNG加註成本轉嫁到運費中,並且面臨托運人嚴格的環境、社會和治理(ESG)要求,貨櫃船在LNG加註市場中佔據最大佔有率。預計到2031年,貨櫃船隊將以每年23.4%的速度成長,並有望在整個預測期內成為LNG燃料庫市場規模的最大貢獻者。
在油輪和散裝貨船領域,目前仍持謹慎態度。儘管DHT Holdings和Euronavi已於2024年訂購了LNG動力超大型油輪(VLCC),但運費波動和所有權結構分散限制了其廣泛應用。渡輪和海上支援船(OSV)的進展則更為落後。區域航線很少能收回低溫儲槽所需的投資,儘管挪威峽灣航運公司(Fjord Line)已透過一艘於2024年交付的LNG動力渡輪證明了其技術可行性。嘉年華郵輪等郵輪業者已營運11艘LNG動力船舶,隨著更多港口建設LNG加註供給能力,LNG加註的部署速度可能會加快。總體而言,LNG加註產業目前仍以貨櫃船為主,但基礎設施的穩定發展和碳定價政策的訊號可能會促使所有船型在本十年後半期更多地參與LNG加註。
其他好處:
- Excel格式的市場預測(ME)表
- 3個月的分析師支持
目錄
第1章:引言
- 研究假設和市場定義
- 調查範圍
第2章:調查方法
第3章執行摘要
第4章 市場狀況
- 市場概覽
- 近期趨勢與發展
- 市場促進因素
- 國際海事組織加強對硫和溫室氣體排放的規定,正在加速液化天然氣的引進。
- 中東地區液化天然氣 (LNG) 生產能力的大規模擴張導致船用燃料油價格下降和供應增加。
- 區域液化天然氣燃料庫中心在獎勵的支持下(蘇哈爾、富查伊拉、德班)
- 出於安全考慮,穿越好望角的航次增加,從而提振了非洲港口的需求。
- 受ESG(碳捕獲、利用與封存)、電動動力傳動系統等因素驅動,對低碳LNG的偏好日益增強。
- 模組化小規模FSRU 和 LNGBV 的引入將使二級港口能夠實現供應。
- 市場限制因素
- 對低溫儲存和燃料庫資產的大量資本投資
- 液化天然氣價格的波動以及與超低硫燃料油(VLSFO)的比較削弱了其節省成本的優勢。
- 即將訂定的甲烷外洩法規可能會削弱液化天然氣的環境優勢。
- 非洲部分港口缺乏技術純熟勞工
- 供應鏈分析
- 監理情勢
- 技術展望
- 波特五力模型
第5章 市場規模與成長預測
- 最終用戶
- 油輪船隊
- 貨櫃船隊
- 散貨和普通貨物船隊
- 渡輪和近海支援船
- 其他最終用戶
- 按地區
- 中東
- 阿拉伯聯合大公國
- 沙烏地阿拉伯
- 阿曼
- 卡達
- 巴林
- 其他中東國家
- 非洲
- 南非
- 埃及
- 奈及利亞
- 肯亞
- 其他非洲國家
- 中東
第6章 競爭情勢
- 市場集中度
- 策略趨勢(併購、聯盟、購電協議)
- 市場佔有率分析(主要公司的市場排名和佔有率)
- 公司簡介
- QatarEnergy
- Royal Dutch Shell plc
- TotalEnergies SE
- ADNOC Logistics & Services plc
- DNG Energy
- Oman LNG LLC
- BP plc
- Mitsui OSK Lines(MOL)
- Nakilat(Qatar Gas Transport Co.)
- Kanfer Shipping
- JGC Holdings Corporation
- McDermott International Inc.
- Technip Energies NV
- BW Group
- SEA-LNG Ltd
- GasLog Ltd
- Wartsila Oyj
- MAN Energy Solutions
- Samsung Heavy Industries
- Hudong-Zhonghua Shipbuilding
第7章 市場機會與未來展望
According to Mordor Intelligence, the middle-East and Africa liquified natural gas bunkering market size in terms of nameplate capacity is expected to grow from 37.95 Thousand metric tons in 2025 to 59.28 Thousand metric tons in 2026 and is forecast to reach 149.11 Thousand metric tons by 2031 at 20.26% CAGR over 2026-2031.
This report is Segmented by End User (Tanker Fleet, Container Fleet, Bulk and General Cargo Fleet, Ferries and OSV, and Other End-Users) and Geography (United Arab Emirates, Saudi Arabia, Oman, Qatar, Bahrain, Rest of Middle East, South Africa, Egypt, Nigeria, Kenya, and Rest of Africa). The Market Sizes and Forecasts are Provided in Terms of Volume (Metric Tons).
Middle-East And Africa Liquified Natural Gas (LNG) Bunkering Market Trends and Insights
Stricter IMO Sulphur and GHG Mandates Accelerate LNG Adoption
The IMO reduced the global sulphur limit in marine fuels from 3.5% to 0.5% in 2020, forcing operators to choose between costly scrubbers, low-sulphur fuel oil, or LNG. By 2025, more than 600 ships were running on LNG, and the IMO 2023 greenhouse-gas strategy, targeting net-zero shipping by 2050, cemented LNG as the most accessible compliance pathway until ammonia or hydrogen supply chains mature. The finalized life-cycle assessment credits LNG with a 20% lower well-to-wake carbon intensity versus heavy fuel oil, driving CMA CGM, MSC, and others to place large dual-fuel orders. The EU placed maritime emissions under its ETS in 2024, and prices climbed to EUR 85 per t, making high-sulphur fuels uneconomic on long Europe-bound voyages. Consequently, shipowners increasingly lock in LNG bunkering contracts to mitigate their carbon cost exposure.
Mega Middle-East Liquefaction Additions Lower Bunker Prices and Boost Supply
Qatar's North Field East, South, and West phases will collectively add 88 billion m3 per year of liquefaction by 2027, lifting the nation to 142 million tpa and reinforcing its leadership in the LNG bunkering market. Saudi Arabia's planned Ras Al-Khair terminal and the UAE's Ruwais project together contribute a further 20 million tpa by 2029. Oversupply has already compressed spot LNG prices; the Platts JKM averaged USD 11.20 per MMBtu in H1 2025 against USD 17.50 in 2024, undercutting VLSFO on a per-voyage basis. Hub operators such as ADNOC and Shell now offer multi-year fixed-price bunker deals, reducing owners' fuel-cost uncertainty and encouraging dual-fuel fleet expansion.
High Capex for Cryogenic Storage and Bunkering Assets
A shore-based LNG bunker terminal typically costs USD 100 million to USD 150 million, covering tanks, vaporization, and safety systems, which deters investment at ports with unclear demand. A dedicated LNG bunkering vessel ranges from USD 50 million to USD 80 million, and financiers often insist on offtake commitments for 70% capacity before funding. Durban's 2025 feasibility study projected an extra 18 months for land acquisition and permitting, delaying revenue and inflating interest costs. Lagos postponed its bunker project after failing to secure 10-year customer contracts. Smaller East-African ports also lack throughput to justify standalone terminals, reinforcing the chicken-and-egg dilemma that slows the LNG bunkering market rollout.
Other drivers and restraints analyzed in the detailed report include:
- Regional LNG Bunkering Hubs Backed by Incentives
- ESG-Driven Preference for Low-Carbon LNG
- LNG Price Volatility Versus VLSFO Undermines Cost Savings
For complete list of drivers and restraints, kindly check the Table Of Contents.
Segment Analysis
Container vessels held 41.1% of demand in 2025, while the tanker and bulk carrier categories lag. Within the container segment, CMA CGM's 22-ship LNG program and MSC's retrofit plan underscore long-term confidence in the fuel. This segment commands the highest LNG bunkering market share because liner operators can pass bunker costs through in freight rates and face strict ESG requirements from cargo owners. The container fleet is projected to grow at 23.4% annually to 2031, making it the largest contributor to the LNG bunkering market size through the forecast period.
Tankers and bulkers remain cautious. DHT Holdings and Euronav ordered LNG-ready VLCCs in 2024, yet widespread uptake is limited by freight-rate volatility and fragmented ownership. Ferries and OSVs trail even further; regional voyages rarely recoup the capital required for cryogenic tanks, though Norway's Fjord Line demonstrates technical feasibility with its LNG-powered ferry delivered in 2024. Cruise operators such as Carnival already run 11 LNG-powered ships and could accelerate adoption once more ports add bunker capability. Overall, the LNG bunkering industry remains container-centric, but progressive infrastructure roll-outs and carbon-pricing signals may broaden participation across vessel classes later in the decade.
Complete Report Scope:
- By End User
- Tanker Fleet
- Container Fleet
- Bulk and General Cargo Fleet
- Ferries and OSV
- Other End-Users
- By Geography
- Middle East
- United Arab Emirates
- Saudi Arabia
- Oman
- Qatar
- Bahrain
- Rest of Middle East
- Africa
- South Africa
- Egypt
- Nigeria
- Kenya
- Rest of Africa
- Middle East
List of Companies Covered in this Report:
- QatarEnergy
- Royal Dutch Shell plc
- TotalEnergies SE
- ADNOC Logistics & Services plc
- DNG Energy
- Oman LNG LLC
- BP plc
- Mitsui O.S.K. Lines (MOL)
- Nakilat (Qatar Gas Transport Co.)
- Kanfer Shipping
- JGC Holdings Corporation
- McDermott International Inc.
- Technip Energies N.V.
- BW Group
- SEA-LNG Ltd
- GasLog Ltd
- Wartsila Oyj
- MAN Energy Solutions
- Samsung Heavy Industries
- Hudong-Zhonghua Shipbuilding
Additional Benefits:
- The market estimate (ME) sheet in Excel format
- 3 months of analyst support
TABLE OF CONTENTS
1 Introduction
- 1.1 Study Assumptions & Market Definition
- 1.2 Scope of the Study
2 Research Methodology
3 Executive Summary
4 Market Landscape
- 4.1 Market Overview
- 4.2 Recent Trends & Developments
- 4.3 Market Drivers
- 4.3.1 Stricter IMO sulphur/GHG mandates accelerate LNG adoption
- 4.3.2 Mega Middle-East liquefaction additions lower bunker prices & boost supply
- 4.3.3 Regional LNG bunkering hubs (Sohar, Fujairah, Durban) backed by incentives
- 4.3.4 Security-driven Cape route shift raises demand at African ports
- 4.3.5 ESG-driven preference for low-carbon LNG (CCUS, e-drive trains)
- 4.3.6 Modular small-scale FSRU & LNGBV roll-outs enable secondary-port supply
- 4.4 Market Restraints
- 4.4.1 High capex for cryogenic storage & bunkering assets
- 4.4.2 LNG price volatility versus VLSFO undermines cost savings
- 4.4.3 Incoming methane-slip rules may erode LNG's green advantage
- 4.4.4 Skilled-labor shortage for LNG handling in several African ports
- 4.5 Supply-Chain Analysis
- 4.6 Regulatory Landscape
- 4.7 Technological Outlook
- 4.8 Porter's Five Forces
- 4.8.1 Bargaining Power of Suppliers
- 4.8.2 Bargaining Power of Buyers
- 4.8.3 Threat of New Entrants
- 4.8.4 Threat of Substitutes
- 4.8.5 Competitive Rivalry
5 Market Size & Growth Forecasts
- 5.1 By End User
- 5.1.1 Tanker Fleet
- 5.1.2 Container Fleet
- 5.1.3 Bulk and General Cargo Fleet
- 5.1.4 Ferries and OSV
- 5.1.5 Other End-Users
- 5.2 By Geography
- 5.2.1 Middle East
- 5.2.1.1 United Arab Emirates
- 5.2.1.2 Saudi Arabia
- 5.2.1.3 Oman
- 5.2.1.4 Qatar
- 5.2.1.5 Bahrain
- 5.2.1.6 Rest of Middle East
- 5.2.2 Africa
- 5.2.2.1 South Africa
- 5.2.2.2 Egypt
- 5.2.2.3 Nigeria
- 5.2.2.4 Kenya
- 5.2.2.5 Rest of Africa
- 5.2.1 Middle East
6 Competitive Landscape
- 6.1 Market Concentration
- 6.2 Strategic Moves (M&A, Partnerships, PPAs)
- 6.3 Market Share Analysis (Market Rank/Share for key companies)
- 6.4 Company Profiles (includes Global level Overview, Market level overview, Core Segments, Financials as available, Strategic Information, Products & Services, and Recent Developments)
- 6.4.1 QatarEnergy
- 6.4.2 Royal Dutch Shell plc
- 6.4.3 TotalEnergies SE
- 6.4.4 ADNOC Logistics & Services plc
- 6.4.5 DNG Energy
- 6.4.6 Oman LNG LLC
- 6.4.7 BP plc
- 6.4.8 Mitsui O.S.K. Lines (MOL)
- 6.4.9 Nakilat (Qatar Gas Transport Co.)
- 6.4.10 Kanfer Shipping
- 6.4.11 JGC Holdings Corporation
- 6.4.12 McDermott International Inc.
- 6.4.13 Technip Energies N.V.
- 6.4.14 BW Group
- 6.4.15 SEA-LNG Ltd
- 6.4.16 GasLog Ltd
- 6.4.17 Wartsila Oyj
- 6.4.18 MAN Energy Solutions
- 6.4.19 Samsung Heavy Industries
- 6.4.20 Hudong-Zhonghua Shipbuilding
7 Market Opportunities & Future Outlook
- 7.1 White-space & Unmet-need Assessment

 2026年全球液化天然氣燃料庫市場報告
 燃料庫服務市場規模、佔有率和趨勢分析報告:按燃料類型、服務類型、船舶類型、最終用戶、地區和細分市場預測(2026-2033 年)
 液化天然氣燃料庫市場:按燃料庫方式、組件、船舶類型、最終用戶和船舶尺寸分類-2026-2032年全球市場預測
 液化天然氣(LNG)燃料庫:市場佔有率分析、產業趨勢與統計資料、成長預測(2026-2031)LNG燃料庫市場規模、佔有率和趨勢分析報告:按燃料庫方式、船舶類型、基礎設施類型、地區和細分市場預測(2026-2033年)
 液化天然氣燃料庫市場:依產品類型、應用和地區分類燃料庫服務市場:2026-2032年全球市場預測(依燃料類型、服務類型、船舶類型、服務形式、船舶尺寸、分銷管道和最終用戶分類)
 液化天然氣燃料庫市場規模、佔有率、趨勢和預測:按產品類型、應用和地區分類,2026-2034年
 全球船舶燃料庫服務市場-按燃料類型、船舶類型、燃料庫方式、地區和競爭格局分類的產業規模、佔有率、趨勢、機會和預測(2021-2031年)日本液化天然氣加註市場報告(按最終用戶(油輪船隊、貨櫃船隊、散裝船隊、渡輪和海上支援船隊以及其他)和地區分類,2026-2034 年)