

 |
市場調查報告書
商品編碼
2072447
液化天然氣(LNG)燃料庫:市場佔有率分析、產業趨勢與統計資料、成長預測(2026-2031)Liquefied Natural Gas (LNG) Bunkering - Market Share Analysis, Industry Trends & Statistics, Growth Forecasts (2026 - 2031) |
||||||
※ 本網頁內容可能與最新版本有所差異。詳細情況請與我們聯繫。
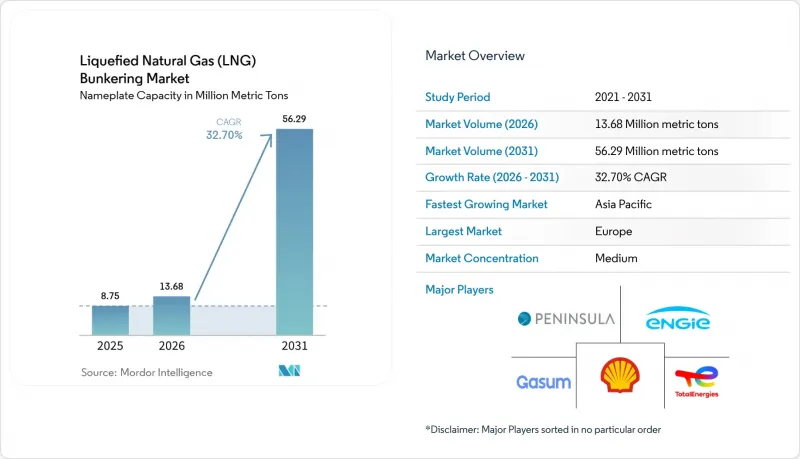
根據 Mordor Intelligence 的數據,液化天然氣 (LNG)燃料庫市場按額定容量計算,預計到 2025 年將達到 875 萬噸,到 2026 年將達到 1368 萬噸,到 2031 年將達到 5629 萬噸,2026 年至 2031 年的複合年成長率。
本報告按最終用戶(油輪船隊、貨櫃船隊、散裝貨船和雜貨船隊、渡輪和近海支援船以及其他最終用戶)和地區(北美、歐洲、亞太、南美以及中東和非洲)進行細分。市場規模和預測以數量(公噸)表示。
全球液化天然氣(LNG)燃料庫市場趨勢及洞察
促進遵守國際海事組織2020年硫排放法規
2020年生效的0.5%硫含量上限規定消除了高硫燃油的成本優勢,迫使船東在脫硫裝置、超低硫燃油或液化天然氣(LNG)之間做出選擇。到2024年,脫硫裝置的改裝數量穩定在5000艘左右,但在主要樞紐港口,LNG的價格仍然比超低硫燃油高出每噸150-250美元,這促使新造船的決策轉向雙燃料引擎。 2025年新加坡和鹿特丹港口國加強檢查,提高了違規成本,加速了船隊向LNG相容型船舶的現代化改造。
液化天然氣動力船舶累積訂單大幅增加。
根據船級社數據,截至2024年4月,全球共有535艘LNG動力船舶投入運營,另有509艘LNG動力船舶在訂單,其中貨櫃船佔總運力的一半以上。光是達飛海運集團(CMA CGM)就訂購了77艘LNG動力船舶,預計到2025年中期將交付44艘。大型貨櫃船訂單的集中,形成了一個良性循環,確保了燃料需求的穩定,進而帶動了樞紐港口基礎設施的進一步投資。
對燃油船和陸上儲存槽的高額資本投入
建造一艘7,500立方公尺的液化天然氣加註船成本在6,000萬美元至7,500萬美元之間,每年的營運成本可高達800萬美元。陸上儲存槽的投資超過1.2億美元,並且需要根據ISO 20519和IGF規則進行為期24個月的授權核准,這導致新興市場的專案延期。這一成本壁壘迫使次要航線的營運商繞道前往主要樞紐或攜帶額外的燃料,從而削弱了液化天然氣的經濟優勢。
細分市場分析
2025年,貨櫃船隊營運將佔液化天然氣(LNG)加註市場規模的39.7%,預計到2031年將以35.8%的複合年成長率成長。達飛輪船(CMA CGM)旗下44艘運作中的LNG動力船舶以及另外33艘在建船舶,充分體現了大型航運公司對LNG的大規模投入。能夠協商長期供應合約並在樞紐港獲得優先泊位是LNG應用的基礎。油輪船隊的LNG應用率仍低於新造船計畫的2%。這主要是由於租船人不願支付運費溢價,以及中東和西非裝貨碼頭缺乏LNG基礎設施。散裝船和雜貨船營運商也面臨類似的挑戰,因為燃料箱佔據了部分貨艙空間,而且貨運市場仍然分散。
液化天然氣燃料庫市場仍依賴亞太和歐洲航線的貨櫃運輸,導致新加坡、鹿特丹和美國墨西哥灣沿岸的基礎設施日益集中。挪威渡輪和海上支援船受益於補貼,補貼金額涵蓋了40%的改裝成本;而郵輪公司則採用液化天然氣以滿足地中海和加勒比海港口城市的空氣品質法規要求。未來的成長將取決於國際海事組織是否會收緊其2030年和2040年的碳排放強度目標,以及是否會將投資轉向甲醇和氨。初步徵兆表明,貨櫃航運公司可能會繼續保持其液化天然氣的使用,因為該網路的貨運量足以對沖燃料價格波動,並使資本成本能夠在大規模的船隊中攤銷。
區域分析
由於早期監管措施、密集的沿海航運網路以及歐洲大陸成熟的陸上基礎設施,歐洲將在2025年佔據液化天然氣(LNG)燃料庫市場72.4%的佔有率。到2025年中期,鹿特丹、安特衛普和斯堪地那維亞半島的港口將能夠同時為40多艘船舶燃料庫LNG。位於德國布倫斯比特爾和威廉港的改造後的浮式儲存再氣化裝置(FSRU)碼頭於2024年新增了LNG燃料庫能力,服務於波羅的海和北海航線。同樣在2024年,歐洲海事安全局(EMSA)修訂了相關指南,統一了安全規程並簡化了跨國作業流程。
預計到2031年,亞太地區將以40.5%的複合年成長率成長,主要得益於新加坡第二碼頭的投產、中國舟山碼頭的擴建以及韓國專用加油船的部署。 2024年,新加坡的加油供給能力將擴大至可同時為12艘船舶提供服務,從而滿足途經麻六甲海峽的定期貨運量。在中國,舟山一座3萬立方公尺的陸上儲槽將於2025年初投入運作,為國內沿海支線及散裝運輸提供服務。日本和韓國傾向於使用加油船而非陸上儲槽以降低初始投資成本,但這種策略存在容量限制,並且隨著船隊的擴張可能需要額外的資產。
北美市場仍屬於小眾市場,其大部分貨運量都在美國墨西哥灣沿岸處理。哈維海灣公司營運兩艘為海上供應船和貨櫃支線船提供燃料的船舶,但該公司正等待西海岸和加拿大港口建立更清晰的法規結構。預計到2025年,來自南美和中東及非洲的貨運量將佔總貨運量的不到3%。巴西石油公司已暫停在桑托斯港的擴建計劃,直到國內天然氣價格改革得以實施。由於巴拿馬沒有液化天然氣倉儲設施,燃料需求正轉向美國墨西哥灣沿岸。卡達能源公司的Q-LNG已訂購一艘將於2025年在哈馬德港營運的燃料船,預計於2027年交付,顯示中東地區未來存在成長潛力。
其他好處:
- Excel格式的市場預測(ME)表
- 3個月的分析師支持
目錄
第1章:引言
- 研究假設和市場定義
- 調查範圍
第2章:調查方法
第3章執行摘要
第4章 市場狀況
- 市場概覽
- 市場促進因素
- 促進遵守國際海事組織2020年硫排放法規
- 液化天然氣動力船舶累積訂單大幅增加。
- 全球液化天然氣燃料庫基礎設施的擴張
- 液化天然氣與低硫燃料油之間的成本競爭
- 電子甲烷的出現使得碳中和液化天然氣供應成為可能。
- 自動化數位雙胞胎解決方案可提高加油安全性
- 市場限制因素
- 對燃油船和陸上儲存槽的大量資本投資
- 液化天然氣現貨價格波動
- 整個生命週期中對甲烷洩漏和溫室氣體排放的擔憂
- 加大對甲醇和氨作為船用燃料的投資。
- 供應鏈分析
- 監理情勢
- 技術展望
- 波特五力模型
第5章 市場規模與成長預測
- 最終用戶
- 油輪船隊
- 貨櫃船隊
- 散裝船和雜貨船隊
- 渡輪和近海支援船
- 其他最終用戶
- 按地區
- 北美洲
- 美國
- 加拿大
- 墨西哥
- 歐洲
- 德國
- 法國
- 西班牙
- 義大利
- 荷蘭
- 瑞典
- 比利時
- 俄羅斯
- 其他歐洲國家
- 亞太地區
- 中國
- 日本
- 韓國
- 新加坡
- 馬來西亞
- 澳洲
- 其他亞太國家
- 南美洲
- 巴西
- 巴拿馬
- 阿根廷
- 其他南美國家
- 中東和非洲
- 阿拉伯聯合大公國
- 沙烏地阿拉伯
- 阿曼
- 南非
- 埃及
- 其他中東和非洲國家
- 北美洲
第6章 競爭情勢
- 市場集中度
- 策略趨勢(併購、聯盟、購電協議)
- 市場佔有率分析(主要公司的市場排名和佔有率)
- 公司簡介
- Shell plc
- TotalEnergies SE
- Gasum Oy
- ENGIE SA
- Peninsula Petroleum
- ENN Energy Holdings
- Korea Gas Corporation(KOGAS)
- Harvey Gulf International Marine
- Gazprom Neft PJSC
- Naturgy Energy Group
- Titan Clean Fuels
- Crowley Maritime Corp.
- CMA CGM SA
- MOL(LNG Solutions)
- NYK Line
- QatarEnergy(Q-LNG)
- ExxonMobil Marine Fuels
- Petronas Marine
- Bunker Holding A/S
- GTT(Gaztransport & Technigaz)
- Cryostar SAS
第7章 市場機會與未來展望
According to Mordor Intelligence, the liquefied natural gas bunkering market size in terms of nameplate capacity is projected to be 8.75 million metric tons in 2025, 13.68 million metric tons in 2026, and reach 56.29 million metric tons by 2031, growing at a CAGR of 32.70% from 2026 to 2031.
This report is Segmented by End User (Tanker Fleet, Container Fleet, Bulk and General Cargo Fleet, Ferries and OSV, and Other End-Users) and Geography (North America, Europe, Asia-Pacific, South America, and Middle East and Africa). The Market Sizes and Forecasts are Provided in Terms of Volume (Metric Tons).
Global Liquefied Natural Gas (LNG) Bunkering Market Trends and Insights
IMO 2020 Sulphur-Cap Compliance Push
The 0.5% sulfur cap that entered into force in 2020 eliminated the cost advantage of high-sulfur fuel oil, leaving owners with scrubbers, very-low-sulfur fuel oil, or LNG. Scrubber retrofits stabilized near 5,000 vessels by 2024, while LNG retained a USD 150-250 per metric-ton price edge over VLSFO in major hub ports, tipping newbuild decisions toward dual-fuel engines. Intensified port-state inspections in Singapore and Rotterdam during 2025 raised the cost of non-compliance, accelerating fleet renewal toward LNG-capable tonnage.
Rapid Growth in LNG-Powered Vessel Orderbook
Classification-society data showed 535 LNG-powered ships in service and 509 on order as of April 2024, with container ships accounting for over half of capacity. CMA CGM alone contracted 77 LNG-fueled vessels, taking delivery of 44 by mid-2025. The concentration of orders in large container units has created a virtuous loop of predictable fuel demand that underpins further infrastructure spending in hub ports.
High CAPEX for Bunkering Vessels and Shore Tanks
A 7,500 cubic-meter bunkering vessel demands USD 60-75 million to build and up to USD 8 million annually for operations. Shore-tank investments exceed USD 120 million and involve 24-month permitting under ISO 20519 and the IGF Code, which delays projects in emerging markets. This cost hurdle forces operators on secondary routes to detour to major hubs or carry additional fuel, eroding LNG's economic advantage.
Other drivers and restraints analyzed in the detailed report include:
- Expansion of Global LNG Bunkering Infrastructure
- Cost Competitiveness of LNG Versus Low-Sulphur Fuel Oils
- Methane-Slip and Life-Cycle GHG Concerns
For complete list of drivers and restraints, kindly check the Table Of Contents.
Segment Analysis
Container fleet operations accounted for 39.7% of the LNG bunkering market size in 2025 and are projected to grow at a 35.8% CAGR through 2031. CMA CGM's fleet of 44 operational LNG-powered vessels and 33 additional units on order illustrates the scale commitment by mega-carriers. The ability to negotiate long-term supply contracts and secure priority berths in hub ports underpins adoption. Tanker fleet uptake remains below 2% of the newbuild pipeline because charterers resist freight premiums, and loading terminals in the Middle East and West Africa lack LNG infrastructure. Bulk and general cargo operators face similar obstacles, as cargo-hold space is sacrificed to fuel tanks, and freight markets remain fragmented.
The LNG bunkering market continues to depend on container traffic along Asia-Europe and trans-Pacific corridors, reinforcing infrastructure concentration in Singapore, Rotterdam, and the U.S. Gulf. Ferries and offshore-support vessels in Norway benefit from subsidies that offset 40% of conversion costs, while cruise lines deploy LNG to meet port-city air-quality mandates in the Mediterranean and Caribbean. Future growth hinges on whether IMO tightens 2030 and 2040 carbon-intensity goals enough to tip investment toward methanol or ammonia. Early evidence suggests container carriers will maintain LNG commitments because network volume allows hedging against fuel-price swings and amortizing capital costs across large fleets.
Complete Report Scope:
- By End User
- Tanker Fleet
- Container Fleet
- Bulk and General Cargo Fleet
- Ferries and OSV
- Other End-Users
- By Geography
- North America
- United States
- Canada
- Mexico
- Europe
- Germany
- France
- Spain
- Italy
- Netherlands
- Sweden
- Belgium
- Russia
- Rest of Europe
- Asia-Pacific
- China
- Japan
- South Korea
- Singapore
- Malaysia
- Australia
- Rest of Asia-Pacific
- South America
- Brazil
- Panama
- Argentina
- Rest of South America
- Middle East and Africa
- United Arab Emirates
- Saudi Arabia
- Oman
- South Africa
- Egypt
- Rest of Middle East and Africa
- North America
Geography Analysis
Europe captured 72.4% of the LNG bunkering market share in 2025, supported by early regulatory moves, dense short-sea networks, and the continent's mature shore infrastructure. Rotterdam, Antwerp, and Scandinavian ports offered simultaneous bunkering for more than 40 vessels by mid-2025. Germany's repurposed FSRU terminals at Brunsbuttel and Wilhelmshaven added LNG bunkering capability in 2024, serving Baltic and North Sea routes. Updated European Maritime Safety Agency guidelines harmonized safety protocols and simplified cross-border operations in 2024.
Asia-Pacific is forecast to grow at a 40.5% CAGR through 2031, propelled by Singapore's second terminal, China's Zhoushan expansion, and South Korea's deployment of dedicated bunkering vessels. Singapore's bunkering capacity rose to 12 simultaneous operations in 2024, supporting liner volumes through the Malacca Strait. In China, Zhoushan's 30,000 cubic-meter shore tanks opened in early 2025, serving domestic coastal feeders and bulk trades. Japan and South Korea favor bunkering vessels over shore tanks to limit upfront capital, though this strategy caps throughput and may require additional assets as the fleet grows.
North America remains a niche, with the U.S. Gulf accounting for most regional volumes. Harvey Gulf operates two bunkering vessels serving offshore supply and container feeders, while West Coast and Canadian ports await clearer regulatory frameworks. South America and the Middle East & Africa contributed less than 3% of 2025 volumes. Petrobras paused expansion in Santos pending domestic gas-price reforms, and Panama lacks LNG storage, diverting bunkering demand to the U.S. Gulf. QatarEnergy's Q-LNG ordered a bunkering vessel in 2025 for delivery in 2027 to serve Hamad Port, signaling future growth potential in the Middle East.
- Shell plc
- TotalEnergies SE
- Gasum Oy
- ENGIE SA
- Peninsula Petroleum
- ENN Energy Holdings
- Korea Gas Corporation (KOGAS)
- Harvey Gulf International Marine
- Gazprom Neft PJSC
- Naturgy Energy Group
- Titan Clean Fuels
- Crowley Maritime Corp.
- CMA CGM SA
- MOL (LNG Solutions)
- NYK Line
- QatarEnergy (Q-LNG)
- ExxonMobil Marine Fuels
- Petronas Marine
- Bunker Holding A/S
- GTT (Gaztransport & Technigaz)
- Cryostar SAS
Additional Benefits:
- The market estimate (ME) sheet in Excel format
- 3 months of analyst support
TABLE OF CONTENTS
1 Introduction
- 1.1 Study Assumptions & Market Definition
- 1.2 Scope of the Study
2 Research Methodology
3 Executive Summary
4 Market Landscape
- 4.1 Market Overview
- 4.2 Market Drivers
- 4.2.1 IMO 2020 sulphur-cap compliance push
- 4.2.2 Rapid growth in LNG-powered vessel orderbook
- 4.2.3 Expansion of global LNG bunkering infrastructure
- 4.2.4 Cost competitiveness of LNG versus low-sulphur fuel oils
- 4.2.5 Emergence of e-methane enabling carbon-neutral LNG supply
- 4.2.6 Automation & digital-twin solutions improving bunkering safety
- 4.3 Market Restraints
- 4.3.1 High CAPEX for bunkering vessels & shore tanks
- 4.3.2 Volatility of LNG spot prices
- 4.3.3 Methane-slip and life-cycle GHG concerns
- 4.3.4 Rising investment shift toward methanol & ammonia bunkering
- 4.4 Supply-Chain Analysis
- 4.5 Regulatory Landscape
- 4.6 Technological Outlook
- 4.7 Porter's Five Forces
- 4.7.1 Bargaining Power of Suppliers
- 4.7.2 Bargaining Power of Buyers
- 4.7.3 Threat of New Entrants
- 4.7.4 Threat of Substitutes
- 4.7.5 Competitive Rivalry
5 Market Size & Growth Forecasts
- 5.1 By End User
- 5.1.1 Tanker Fleet
- 5.1.2 Container Fleet
- 5.1.3 Bulk and General Cargo Fleet
- 5.1.4 Ferries and OSV
- 5.1.5 Other End-Users
- 5.2 By Geography
- 5.2.1 North America
- 5.2.1.1 United States
- 5.2.1.2 Canada
- 5.2.1.3 Mexico
- 5.2.2 Europe
- 5.2.2.1 Germany
- 5.2.2.2 France
- 5.2.2.3 Spain
- 5.2.2.4 Italy
- 5.2.2.5 Netherlands
- 5.2.2.6 Sweden
- 5.2.2.7 Belgium
- 5.2.2.8 Russia
- 5.2.2.9 Rest of Europe
- 5.2.3 Asia-Pacific
- 5.2.3.1 China
- 5.2.3.2 Japan
- 5.2.3.3 South Korea
- 5.2.3.4 Singapore
- 5.2.3.5 Malaysia
- 5.2.3.6 Australia
- 5.2.3.7 Rest of Asia-Pacific
- 5.2.4 South America
- 5.2.4.1 Brazil
- 5.2.4.2 Panama
- 5.2.4.3 Argentina
- 5.2.4.4 Rest of South America
- 5.2.5 Middle East and Africa
- 5.2.5.1 United Arab Emirates
- 5.2.5.2 Saudi Arabia
- 5.2.5.3 Oman
- 5.2.5.4 South Africa
- 5.2.5.5 Egypt
- 5.2.5.6 Rest of Middle East and Africa
- 5.2.1 North America
6 Competitive Landscape
- 6.1 Market Concentration
- 6.2 Strategic Moves (M&A, Partnerships, PPAs)
- 6.3 Market Share Analysis (Market Rank/Share for key companies)
- 6.4 Company Profiles (includes Global level Overview, Market level overview, Core Segments, Financials as available, Strategic Information, Products & Services, and Recent Developments)
- 6.4.1 Shell plc
- 6.4.2 TotalEnergies SE
- 6.4.3 Gasum Oy
- 6.4.4 ENGIE SA
- 6.4.5 Peninsula Petroleum
- 6.4.6 ENN Energy Holdings
- 6.4.7 Korea Gas Corporation (KOGAS)
- 6.4.8 Harvey Gulf International Marine
- 6.4.9 Gazprom Neft PJSC
- 6.4.10 Naturgy Energy Group
- 6.4.11 Titan Clean Fuels
- 6.4.12 Crowley Maritime Corp.
- 6.4.13 CMA CGM SA
- 6.4.14 MOL (LNG Solutions)
- 6.4.15 NYK Line
- 6.4.16 QatarEnergy (Q-LNG)
- 6.4.17 ExxonMobil Marine Fuels
- 6.4.18 Petronas Marine
- 6.4.19 Bunker Holding A/S
- 6.4.20 GTT (Gaztransport & Technigaz)
- 6.4.21 Cryostar SAS
7 Market Opportunities & Future Outlook
- 7.1 White-space & Unmet-Need Assessment
 LNG燃料庫市場規模、佔有率和趨勢分析報告:按燃料庫方式、船舶類型、基礎設施類型、地區和細分市場預測(2026-2033年)
 液化天然氣燃料庫市場:燃料庫方式、組件類型、船舶類型、最終用戶和船舶尺寸分類-2026-2032年全球市場預測
 液化天然氣燃料庫市場:依產品類型、應用和地區分類
 2026年全球液化天然氣燃料庫市場報告燃料庫服務市場:2026-2032年全球市場預測(依燃料類型、服務類型、船舶類型、服務形式、船舶尺寸、分銷管道和最終用戶分類)
 液化天然氣燃料庫市場規模、佔有率、趨勢和預測:按產品類型、應用和地區分類,2026-2034年
 全球船舶燃料庫服務市場-按燃料類型、船舶類型、燃料庫方式、地區和競爭格局分類的產業規模、佔有率、趨勢、機會和預測(2021-2031年)日本液化天然氣加註市場報告(按最終用戶(油輪船隊、貨櫃船隊、散裝船隊、渡輪和海上支援船隊以及其他)和地區分類,2026-2034 年)
 液化天然氣燃料庫市場規模、佔有率和成長分析(按類型、產品類型、應用和地區分類)-2026-2033年產業預測
 全球液化天然氣 (LNG) 加註市場:按產品類型、應用和地區劃分 - 市場規模、行業趨勢、機會分析和預測 (2025-2033)