


 |
市場調查報告書
商品編碼
2115840
歐洲自行車共享:市場佔有率分析、產業趨勢與統計及成長預測(2026-2031)Europe Bike Sharing - Market Share Analysis, Industry Trends & Statistics, Growth Forecasts (2026 - 2031) |
||||||

※ 本網頁內容可能與最新版本有所差異。詳細情況請與我們聯繫。
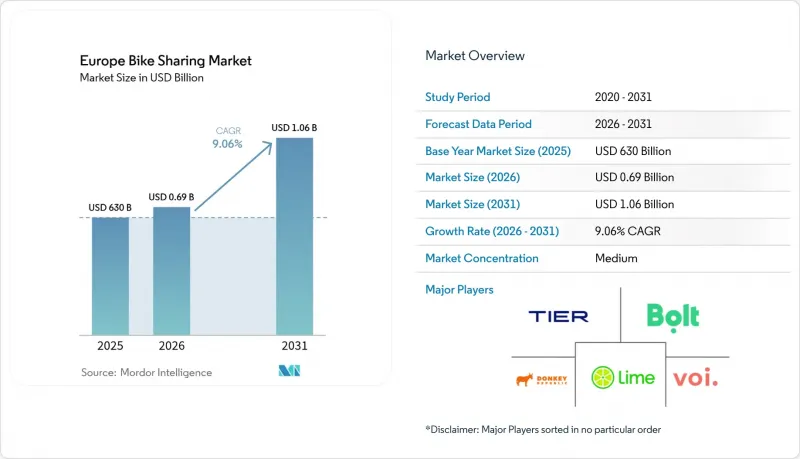
根據 Mordor Intelligence 估計,到 2026 年,歐洲自行車共享市場價值將達到 6.9 億美元,高於 2025 年的 6.3 億美元,預計到 2031 年將達到 10.6 億美元。
預計 2026 年至 2031 年的複合年成長率為 9.06%。
本報告按自行車類型(傳統自行車和電動自行車)、共享系統(固定樁式等)、預約方式(App/線上和自助服務終端/櫃檯)、使用者群體(通勤者等)、支付模式(付費使用制等)、車輛所有權模式(市政所有等)以及國家/地區(德國等)進行分類。市場預測以美元計價。
歐洲自行車共享市場的趨勢與洞察
共享交通工具中電動自行車的引進正在加速。
據營運商稱,每輛自行車的使用次數加倍甚至兩番,平均騎行距離有所增加,老年人和行動不便用戶的需求也在成長,所有這些因素都促使每輛自行車的收益增加。 2024年,Lime投資5,500萬美元,推出3萬輛新的電動自行車,優先考慮歐洲主要城市,因為這些城市受地形和通勤距離的限制,傳統自行車的使用受到阻礙。比利時和法國的市政獎勵計畫正在推動電動自行車的普及,並根據電池電量改善充電覆蓋範圍,進一步擴大了電動自行車的使用範圍。隨著電池價格下降和續航里程增加,營運商正在爭取更有利的採購條款,從而提高了歐洲共享單車市場的利潤率。
超低排放城市地區的出現
阿姆斯特丹將於2025年1月禁止內燃機摩托車和貨車進入市中心,充分體現了氣候政策如何推動對符合環保要求的微型出行方式的需求。巴黎和倫敦的類似法規擴大了共享單車的用戶群體,並鼓勵物流公司轉向以自行車為基礎的「最後一公里」配送。倫敦交通局(TfL)對棄置電動自行車處以50至100英鎊的罰款,體現了地方政府在公共空間的便利性和秩序之間尋求平衡的努力。那些能夠在監管區域內迅速擴大車隊規模的領先已經獲得了穩固的市場佔有率,並在歐洲共享單車市場站穩了腳跟。
來自電動滑板車和其他微型交通工具的激烈競爭。
像Voi Technology這樣獲利的電動滑板車公司正投入新資金進軍自行車市場,這給現有營運商帶來了壓力,並擠佔了道路空間。 Voi計劃在2025年在倫敦投放數千輛電動自行車,這加劇了交通途徑選擇的複雜性,如果價格競爭爆發,可能會導致每次騎行的利潤下降。擁有多種車型的車隊需要複雜的需求分配演算法和更多的資本投入,這考驗著歐洲自行車共享市場的財務韌性。雖然市政當局對車輛總數的限制保護了現有營運商,但也可能扼殺創新。
細分市場分析
至2025年,電動自行車將佔據歐洲共享單車市場55.88%的佔有率,預計到2031年,其市場佔有率將以9.49%的複合年成長率進一步擴大。都市區用戶青睞電動自行車更長的續航里程和更輕鬆的爬坡性能,而營運商則受益於單車使用率的提高和電池成本的降低。預計到2031年,歐洲電動自行車共享市場將快速成長,這反映了政策的支持以及城市居民傾向於選擇無需騎行即可通勤的出行方式的趨勢。傳統自行車在短途旅行、平坦地區和旅遊景點仍然具有成本效益,並在混合車隊中繼續發揮穩定作用。
區域地形影響著車隊組成。在丘陵起伏的里斯本,80%的公共自行車已經是電動的,而在地勢平坦的阿姆斯特丹,傳統自行車仍然是最後一公里出行的首選。採購項目的擴張使能夠提供模組化電池系統的德國和日本中置馬達供應商受益。調查數據顯示,47%的電動自行車使用者表示「節省燃料成本」是他們購買電動自行車的原因,這印證了推動共享服務使用量成長的宏觀經濟因素。營運商正在繼續試點為送貨人員提供電動自行車,從而在歐洲共享單車市場開闢了一條新的收入來源。
無樁共享單車模式無需固定站點,即可利用用戶的柔軟性和快速部署優勢,預計到2025年將佔總收入的68.10%。儘管申訴人行道堵塞,但歐洲當局更傾向於設立強制性指定區域而非全面禁止,這使得歐洲共享單車市場能夠保持無樁租賃的便利性。隨著營運商不斷完善用於停車管理的地理圍欄技術和人工智慧驅動的車輛平衡系統,該領域的前景一片光明。
在巴黎、哥本哈根和倫敦,一種名為「混合網路」(自由浮動的自行車可鎖定在劃線停車位上)的模式正在興起,這種模式既能滿足用戶需求,又能獲得監管部門的認可,預計到2031年將以8.43%的複合年成長率成長。像「Velib」這樣的固定停靠點模式在人口密集的城市地區仍然很受歡迎,而資金充足的站點式模式也展現出透過與公共交通卡整合而擴展到1000多個地點的潛力。因此,歐洲自行車共享市場正在適應各種基礎設施配置,以滿足不同的道路管理目標。
其他好處:
- Excel格式的市場預測(ME)表
- 3個月的分析師支持
目錄
第1章:引言
- 研究假設和市場定義
- 調查範圍
第2章:調查方法
第3章執行摘要
第4章 市場狀況
- 市場概覽
- 市場促進因素
- 共享服務中電動自行車的普及速度正在加速。
- 超低排放城市地區的出現
- 企業出行預算計畫正在提升用戶數量。
- 人工智慧驅動的動態再平衡可改善單位經濟效益。
- 歐盟促進下一代自行車基礎設施發展的措施
- 疫情後旅遊業的復甦帶動了休閒需求的成長。
- 市場限制因素
- 來自電動滑板車和其他微型交通工具的激烈競爭。
- 由於故意破壞和盜竊,營運成本不斷上升。
- 資本市場收緊限制了企業資金籌措。
- 地方政府競標和政策變化的波動性
- 價值供應鏈分析
- 監理情勢
- 技術展望
- 波特五力模型
- 投資和資金籌措趨勢
第5章 市場規模與成長預測
- 按自行車類型
- 傳統自行車
- 電動自行車(pederec,Speed pederec)
- 透過共享系統
- 對接類型
- 無樁
- 混合型(固定式+自由浮動式)
- 按預訂類型
- 基於應用程式/在線
- 自助服務亭/步行式服務
- 按用戶個人資料
- 通勤者
- 遊客和休閒用戶
- 送貨員/零工
- 按支付模式
- 付費使用制
- 訂閱/會員資格
- 按車隊自有模式
- 地方政府所有權
- 私人企業主
- 官民合作關係
- 國家
- 德國
- 英國
- 法國
- 義大利
- 西班牙
- 荷蘭
- 比利時
- 其他歐洲國家
第6章 競爭情勢
- 市場集中度
- 策略趨勢
- 市佔率分析
- 公司簡介
- Lime(Neutron Holdings Inc.)
- Tier Mobility SE
- nextbike GmbH(Tier)
- Donkey Republic ApS
- Voi Technology AB
- Dott BV
- Bolt Technology OU
- Bird Global Inc.
- PONY SAS
- Bleeper Active Ltd.
- JCDecaux SA(Cyclocity)
- Fifteen SAS
- Uber Technologies Inc.(Jump legacy)
- JOYRIDE Technologies Inc.
- PBSC Urban Solutions Inc.
- Swapfiets BV
- Fluctuo SAS
- Donkey Republic
- Beryl UK Ltd.
- Nextbike Polska SA
第7章 市場機會與未來展望
According to Mordor Intelligence, Europe bike sharing market size in 2026 is estimated at USD 690 million, growing from 2025 value of USD 630 million with 2031 projections showing USD 1.06 billion, growing at 9.06% CAGR over 2026-2031.
This report is Segmented by Bike Type (Conventional/Traditional Bicycles and Electric Bicycles), Sharing System (Docked and More), Booking Type (App-Based/Online and Kiosk/Walk-Up), User Profile (Commuters and More), Payment Model (Pay-As-You-Go and More), Fleet Ownership Model (Municipal-Owned and More), and Country (Germany, and More). The Market Forecasts are Provided in Terms of Value (USD).
Europe Bike Sharing Market Trends and Insights
Accelerating adoption of e-bikes in shared fleets
Operators cite 2-3 times more rides per vehicle, longer average trip length and stronger demand from older or less-fit riders, which jointly lift revenue per asset. Lime invested USD 55 million in 2024 to add 30,000 new e-bikes, prioritising European hubs where terrain or commuting distances limit classic cycling.Municipal incentive schemes in Belgium and France are reinforcing uptake by normalising electric cycling and improving residual battery-charging coverage. As battery prices fall and range improves, operators secure better procurement terms, widening margins in the Europe bike sharing market.
Emergence of ultra-low-emission urban zones
Amsterdam's January 2025 ban on combustion scooters and vans inside city cores exemplifies how climate policy channels demand toward compliant micro-mobility. Similar regulations in Paris and London expand the captive user pool for bike sharing services and nudge logistics companies into bicycle-based last-mile deliveries. Transport for London's fine regime of GBP 50-100 for misplaced e-bikes shows local authorities balancing accessibility with public-space order. First movers that can scale fleets quickly inside restricted areas gain defensible shares, anchoring their presence in the Europe bike sharing market.
Intense competition from e-scooters & other micro-mobility
Profit-positive e-scooter firms such as Voi Technology are injecting fresh capital to deploy bicycles, crowding curb space and putting price pressure on incumbents. Voi's plan to release thousands of e-bikes in London in 2025 will intensify mode-choice friction and may drive down per-ride revenue if price wars erupt. Multi-vehicle fleets demand sophisticated demand-allocation algorithms and raise capex needs, testing financial resilience in the Europe bike sharing market. Municipal caps on total vehicles often safeguard incumbents but risk dampening innovation.
Other drivers and restraints analyzed in the detailed report include:
- Corporate mobility-budget programmes boosting subscriptions
- AI-driven dynamic rebalancing improving unit economics
- Vandalism & theft driving up operating costs
For complete list of drivers and restraints, kindly check the Table Of Contents.
Segment Analysis
Electric bicycles accounted for 55.88% of Europe bike sharing market share in 2025 and are set to widen dominance via a 9.49% CAGR through 2031. Urban riders appreciate longer range and easier hill climbing, while operators earn more rides per asset and benefit from falling battery costs. The Europe bike sharing market size for e-bikes is projected to grow rapidly by 2031, mirroring policy support and city preference for low-sweat commuting. Conventional bicycles remain cost-efficient for very short trips, flatter geographies and tourist hotspots, maintaining a stabilising role in mixed fleets.
Local topography influences fleet mix: hilly Lisbon has already electrified 80% of its public bicycle stock, whereas flat Amsterdam still prefers classic bikes for last-mile hops. The widening procurement pipeline favours mid-drive motor suppliers in Germany and Japan who can deliver modular battery systems. Survey data show 47% of e-bike riders cite fuel-cost avoidance as a buying reason, underscoring macro drivers that translate into higher trip volumes for sharing schemes. Operators continue to pilot cargo e-bikes for delivery workers, opening niche revenue streams inside the Europe bike sharing market.
Dockless formats captured 68.10% revenue in 2025 on the promise of user flexibility and rapid rollouts without station hardware. Despite complaints about sidewalk clutter, European municipalities are leaning on designation-zone mandates rather than blanket bans, allowing the Europe bike sharing market to retain the convenience of station-free rentals. The segment shows positive outlook as operators refine geo-fenced parking and AI-guided rebalancing.
Hybrid networks-free-floating bikes that lock to painted bays-are emerging in Paris, Copenhagen and London, winning regulatory goodwill while preserving pick-up spontaneity, and expected to grow at 8.43% CAGR by 2031. Docked schemes such as Velib' still thrive in high-density cores, proving that well-funded station models can scale beyond 1,000 hubs when tethered to public-transport passes. The Europe bike sharing market therefore supports a spectrum of infrastructure configurations that align with varying curb-management objectives.
Complete Report Scope:
- By Bike Type
- Conventional/Traditional Bicycles
- Electric Bicycles (Pedelec, Speed-Pedelec)
- By Sharing System
- Docked
- Dockless
- Hybrid (Station-plus-Free-Floating)
- By Booking Type
- App-Based/Online
- Kiosk/Walk-Up
- By User Profile
- Commuters
- Tourists & Leisure Users
- Delivery/Gig Workers
- By Payment Model
- Pay-As-You-Go
- Subscription / Membership
- By Fleet Ownership Model
- Municipal-Owned
- Private-Operator-Owned
- Public-Private Partnership
- By Country
- Germany
- United Kingdom
- France
- Italy
- Spain
- Netherlands
- Belgium
- Rest of Europe
List of Companies Covered in this Report:
- Lime (Neutron Holdings Inc.)
- Tier Mobility SE
- nextbike GmbH (Tier)
- Donkey Republic ApS
- Voi Technology AB
- Dott B.V.
- Bolt Technology OU
- Bird Global Inc.
- PONY SAS
- Bleeper Active Ltd.
- JCDecaux SA (Cyclocity)
- Fifteen SAS
- Uber Technologies Inc. (Jump legacy)
- JOYRIDE Technologies Inc.
- PBSC Urban Solutions Inc.
- Swapfiets B.V.
- Fluctuo SAS
- Donkey Republic
- Beryl UK Ltd.
- Nextbike Polska S.A.
Additional Benefits:
- The market estimate (ME) sheet in Excel format
- 3 months of analyst support
TABLE OF CONTENTS
1 Introduction
- 1.1 Study Assumptions & Market Definition
- 1.2 Scope of the Study
2 Research Methodology
3 Executive Summary
4 Market Landscape
- 4.1 Market Overview
- 4.2 Market Drivers
- 4.2.1 Accelerating adoption of e-bikes in shared fleets
- 4.2.2 Emergence of ultra-low-emission urban zones
- 4.2.3 Corporate mobility-budget programmes boosting subscriptions
- 4.2.4 AI-driven dynamic rebalancing improving unit economics
- 4.2.5 EU NextGen cycling-infrastructure stimulus
- 4.2.6 Post-pandemic tourism rebound raising leisure usage
- 4.3 Market Restraints
- 4.3.1 Intense competition from e-scooters & other micro-mobility
- 4.3.2 Vandalism & theft driving up operating costs
- 4.3.3 Capital-market tightening curbing operator funding
- 4.3.4 Municipal tender volatility & policy reversals
- 4.4 Value/Supply-Chain Analysis
- 4.5 Regulatory Landscape
- 4.6 Technological Outlook
- 4.7 Porter's Five Forces
- 4.7.1 Bargaining Power of Suppliers
- 4.7.2 Bargaining Power of Buyers/Consumers
- 4.7.3 Threat of New Entrants
- 4.7.4 Threat of Substitute Products
- 4.7.5 Intensity of Competitive Rivalry
- 4.8 Investment & Funding Trends
5 Market Size & Growth Forecasts (Value (USD))
- 5.1 By Bike Type
- 5.1.1 Conventional/Traditional Bicycles
- 5.1.2 Electric Bicycles (Pedelec, Speed-Pedelec)
- 5.2 By Sharing System
- 5.2.1 Docked
- 5.2.2 Dockless
- 5.2.3 Hybrid (Station-plus-Free-Floating)
- 5.3 By Booking Type
- 5.3.1 App-Based/Online
- 5.3.2 Kiosk/Walk-Up
- 5.4 By User Profile
- 5.4.1 Commuters
- 5.4.2 Tourists & Leisure Users
- 5.4.3 Delivery/Gig Workers
- 5.5 By Payment Model
- 5.5.1 Pay-As-You-Go
- 5.5.2 Subscription / Membership
- 5.6 By Fleet Ownership Model
- 5.6.1 Municipal-Owned
- 5.6.2 Private-Operator-Owned
- 5.6.3 Public-Private Partnership
- 5.7 By Country
- 5.7.1 Germany
- 5.7.2 United Kingdom
- 5.7.3 France
- 5.7.4 Italy
- 5.7.5 Spain
- 5.7.6 Netherlands
- 5.7.7 Belgium
- 5.7.8 Rest of Europe
6 Competitive Landscape
- 6.1 Market Concentration
- 6.2 Strategic Moves
- 6.3 Market Share Analysis
- 6.4 Company Profiles (Includes Global Level Overview, Market Level Overview, Core Segments, Financials as Available, Strategic Information, Market Rank/Share for Key Companies, Products and Services, SWOT Analysis, and Recent Developments)
- 6.4.1 Lime (Neutron Holdings Inc.)
- 6.4.2 Tier Mobility SE
- 6.4.3 nextbike GmbH (Tier)
- 6.4.4 Donkey Republic ApS
- 6.4.5 Voi Technology AB
- 6.4.6 Dott B.V.
- 6.4.7 Bolt Technology OU
- 6.4.8 Bird Global Inc.
- 6.4.9 PONY SAS
- 6.4.10 Bleeper Active Ltd.
- 6.4.11 JCDecaux SA (Cyclocity)
- 6.4.12 Fifteen SAS
- 6.4.13 Uber Technologies Inc. (Jump legacy)
- 6.4.14 JOYRIDE Technologies Inc.
- 6.4.15 PBSC Urban Solutions Inc.
- 6.4.16 Swapfiets B.V.
- 6.4.17 Fluctuo SAS
- 6.4.18 Donkey Republic
- 6.4.19 Beryl UK Ltd.
- 6.4.20 Nextbike Polska S.A.
7 Market Opportunities & Future Outlook
- 7.1 White-Space & Unmet-Need Assessment

 2034年全球自行車共享市場預測-按自行車類型、共享模式、經營模式、技術、應用、最終用戶和地區分類的全球分析自行車共享網路市場:未來預測(至2034年)-按系統類型、自行車類型、共享模式、使用方式、最終用戶和地區分類的全球分析
 自行車共享市場規模、佔有率、趨勢和預測:按自行車類型、共享系統、應用和地區分類,2026-2034年
 2026年全球自行車共享市場報告2034年全球自行車共享市場預測-按自行車類型、共享系統類型、經營模式、技術、應用、最終用戶和地區分類的全球分析
 自行車共享市場:按服務類型、自行車類型、訂閱模式、按需計量型和用戶類型分類-2026-2032年全球預測
 自行車共享市場-全球產業規模、佔有率、趨勢、機會及預測(按自行車類型、共享系統、共用時長、地區和競爭格局分類,2021-2031年)
 自行車共享市場規模、佔有率和成長分析(按類型、系統、時間段和地區分類)—產業預測(2026-2033 年)2032年自行車共享市場預測:按自行車類型、共享系統、支付模式、最終用戶和地區分類的全球分析
 全球自行車共享服務市場—市場佔有率和排名、總收入和需求預測(2025-2031 年)