


 |
市場調查報告書
商品編碼
2115241
電動計程車:市場佔有率分析、行業趨勢和統計數據、成長預測(2026-2031)EV Taxi - Market Share Analysis, Industry Trends & Statistics, Growth Forecasts (2026 - 2031) |
||||||

※ 本網頁內容可能與最新版本有所差異。詳細情況請與我們聯繫。
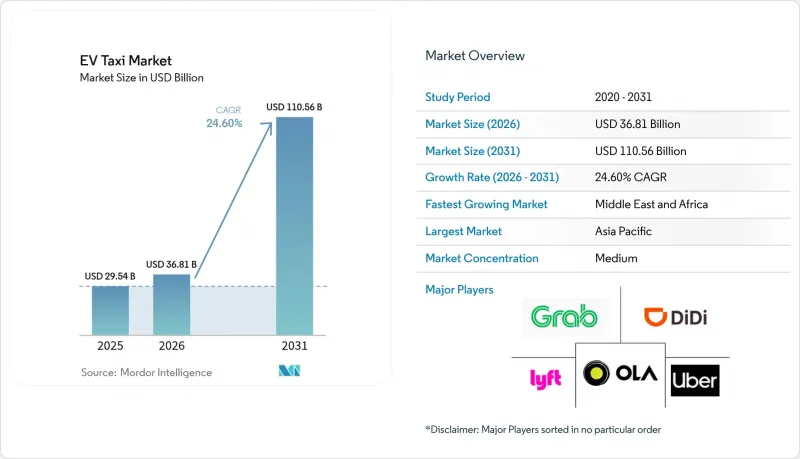
根據 Mordor Intelligence 估計,2026 年電動計程車市場價值將達到 368.1 億美元,高於 2025 年的 295.4 億美元,預計到 2031 年將達到 1,105.6 億美元。
預計從 2026 年到 2031 年,其複合年成長率將達到 24.6%。
本報告按動力系統(電池式電動車、插電式混合動力汽車等)、車輛類型(兩輪計程車、三輪計程車等)、服務模式(叫車、共乘等)、所有權類型(車隊所有權等)、電池容量(小於30千瓦時等)和地區進行分類。市場預測以美元計價。
全球電動計程車市場趨勢與洞察
2026年,總擁有成本(TCO)將保持不變
電池成本的快速下降(目前已低於每千瓦時100美元)和燃油價格的上漲正在推動經濟轉型。在長途計程車營運週期中,節省的燃油和維護成本可在部署後的三年內抵消高額的初始投資。購置補貼和加速折舊等獎勵措施進一步縮短了投資回收期。因此,營運商正在根據電動驅動系統而非柴油動力系統來調整其內部收益率 (IRR) 模型。作為回應,金融機構正在提供以可預測的現金流量節省為抵押的長期、低收益率貸款。
推動共享出行平台電氣化的努力
各平台都將永續性目標作為差異化優勢,並以此吸引投資。優步承諾在2040年實現零排放車隊,並致力於達成全球永續性目標。為了實現這一目標,優步建立了戰略合作夥伴關係,並制定了廣泛的籌資策略,例如與比亞迪等領先製造商簽署了電動車採購意向書。這些舉措顯示優步正從願景轉向具體實施,從而建立供應鏈,並在城市出行領域樹立標竿。同時,Lyft透過提供「綠色」選項(需向乘客收取額外費用)巧妙地引導其駕駛合作夥伴選擇電動車。此類保障措施創造了持續的需求,支援批量採購,並促使廠商分配專為計程車最佳化配置的車輛。
車輛因充電而運作長度
與汽油動力車輛相比,電動計程車充電時間更長,尖峰時段等待時間也更長,導致運作更長。在人口密集的城市,當換班高峰期恰逢充電站擁擠時,業者會明顯感受到這種影響。服務時間的損失直接轉化為收入減少和小費降低,這使得一些司機即使有補貼也猶豫是否要轉換電動計程車。雖然隨著兆瓦級充電基礎設施的普及和更完善的負載管理軟體的出現,這項限制有望得到緩解,但充電能力不足仍然是電動計程車普及的短期障礙。
細分市場分析
預計到2025年,電池式電動車(BEV)將佔電動計程車市場佔有率的62.72%,凸顯了電動計程車市場對簡單動力系統和低維護成本的重視。然而,由於擔心郊區高速公路充電站短缺,插電式混合動力汽車(PHEV)預計到2031年將以26.8%的複合年成長率快速成長。因此,在全國充電基礎設施密度達到正常水平之前,電動計程車行業可能會採取雙軌籌資策略。一些具有前瞻性的營運商已經在計劃於2028年後將混合動力汽車從零排放定義中移除的地區,開始向純電動車轉型。同時,燃料電池車的試點部署僅限於氫能走廊項目,目前僅佔電動計程車市場總佔有率的不到1%。
第二代插電式混合動力車(PHEV)將容量超過20千瓦時的電池與高效能增程器結合,實現了80公里的純電續航里程,足以滿足大部分城市出行需求。這種柔軟性對需要在資本投資和運作時間之間取得平衡的中型計程車業者極具吸引力。然而,分析師在比較五年現金流時認為,一旦充電等待時間降至12分鐘以下,純電動車(BEV)的淨現值將低於PHEV。這個轉折點可能會在2020年代末鞏固BEV的優勢。
到2025年,四輪轎車和掀背車將佔據電動計程車市場佔有率的73.46%,這主要得益於完善的法規和乘客對舒適性的期望。同時,預計到2031年,電動機車和踏板車將以27.9%的驚人複合年成長率成長。這一成長主要由印度尼西亞、印度和越南推動,這些國家道路狹窄、票價低廉且採用模組化電池組,這些因素都促進了電動摩托車和踏板車的普及。這些二輪車輛通常需要3-8千瓦時的電池,並且可以透過路邊換電在兩分鐘內恢復全部續航里程。
監管機構越來越認可摩托車作為合法計程車類型,並頒發與平台應用程式關聯的電子許可證。這種合法性正在改善駕駛人的收入前景,並擴大資金籌措管道。小型貨車和多用途乘用車(MPV)在客流量大的機場線路上仍然發揮作用。然而,預計這不會顯著動搖小型四輪車輛在電動計程車市場規模指標方面的主導地位。
區域分析
預計到2025年,亞太地區將佔據電動計程車市場43.02%的佔有率,這反映了中國強大的製造能力、印度摩托車市場的蓬勃發展以及日本、韓國和澳洲積極的政策獎勵。中國的省級雙證制度允許車輛營運商互換合規證書,從而提高了專案的經濟可行性。同時,印度的FAME-II補貼計畫透過促進電池組和充電器的在地化生產,加強國內供應鏈,有助於穩定零售價格。
預計到2031年,中東和非洲地區的年複合成長率將達到28.45%,位居全球之首。這主要得益於阿拉伯聯合大公國為2030年世博會推出的「零排放地面交通」計畫以及沙烏地阿拉伯的「NEOM」智慧城市計畫。優惠的電價和豐富的太陽能發電資源將進一步降低營運成本。埃及和摩洛哥正在開發電動計程車項目,這些項目由綠色債券融資,並利用了多邊機構提供的優惠貸款。
加州的「先進清潔車隊」規則樹立了榜樣,而紐約市則限制了新的內燃機計程車牌照的發放數量。歐洲受益於成熟的公共充電網路,但能源價格的持續波動仍然影響著駕駛者的投資回報。南美洲由於外匯風險和高昂的資本成本而落後,但巴西和哥倫比亞已開始試行夜間車輛充電費折扣。
其他好處:
- Excel格式的市場預測(ME)表
- 3個月的分析師支持
目錄
第1章:引言
- 研究假設和市場定義
- 調查範圍
第2章:調查方法
第3章執行摘要
第4章 市場狀況
- 市場概覽
- 市場促進因素
- 政府強制要求計程車零排放
- 預計到 2026 年將實現總擁有成本 (TCO) 持平。
- 在機場和城區擴建快速充電站
- 推動叫車平台電氣化的努力
- ESG掛鉤的地方政府資金籌措計劃
- 電池即服務 (BaaS) 訂閱經濟
- 市場限制因素
- 充電導致車輛運作增加
- 二手電動計程車的不確定殘值
- 都市區電網容量瓶頸
- 各汽車製造商正在推遲計程車車型的生產。
- 價值供應鏈分析
- 監理情勢
- 技術展望
- 波特五力模型
第5章 市場規模與成長預測
- 依推進類型
- 電池式電動車(BEV)
- 插電式混合動力車(PHEV)
- 混合動力電動車(HEV)
- 燃料電池電動車(FCEV)
- 車輛類型
- 摩托車計程車
- 三輪計程車
- 四輪計程車(轎車/掀背車)
- 多用途車輛/小型貨車
- 按服務模式
- 叫車(按需服務)
- 共乘
- 企業/機構車隊
- 機場和旅遊接駁車
- 自有車型
- 車隊車主/經營者
- 業主所有
- 租賃和訂閱
- 按電池容量
- 小於 30 千瓦時
- 30~60 kWh
- 60度或以上
- 按地區
- 北美洲
- 美國
- 加拿大
- 其他北美國家
- 南美洲
- 巴西
- 阿根廷
- 其他南美國家
- 歐洲
- 德國
- 英國
- 法國
- 義大利
- 西班牙
- 荷蘭
- 挪威
- 俄羅斯
- 其他歐洲國家
- 亞太地區
- 中國
- 印度
- 日本
- 韓國
- 澳洲
- 印尼
- 泰國
- 其他亞太國家
- 中東和非洲
- 阿拉伯聯合大公國
- 沙烏地阿拉伯
- 土耳其
- 埃及
- 南非
- 其他中東和非洲國家
- 北美洲
第6章 競爭情勢
- 市場集中度
- 策略趨勢
- 市佔率分析
- 公司簡介
- Lyft Inc.
- Ola Electric Mobility Pvt Ltd.(Ola Cabs)
- Uber Technologies Inc.
- Grab Holdings Ltd.
- Didi Chuxing Technology Co.
- GoGreen Cabs
- Phoenix Taxis
- CAB-EEZ Infra Tech Ltd
- XANHSM Green and Smart Mobility Indonesia(GSM)
- Prakriti E-Mobility Private Limited(Evera Cabs)
- eee-Mobility Solutions Private Limited
- Electric Cab North America
- Free Now GmbH
- Addison Lee Limited
- G7 New Energy Taxi(Beijing)Co.
- Yandex Go
- Bolt Technology OU
According to Mordor Intelligence, EV taxi market size in 2026 is estimated at USD 36.81 billion, growing from 2025 value of USD 29.54 billion with 2031 projections showing USD 110.56 billion, growing at 24.6% CAGR over 2026-2031.
This report is Segmented by Propulsion Type (Battery Electric Vehicle, Plug-In Hybrid Electric Vehicle, and More), Vehicle Type (Two-Wheeler Taxi, Three-Wheeler Taxi, and More), Service Model (Ride-Hailing, Ride-Sharing, and More), Ownership Model (Fleet-Owned, and More), Battery Capacity (Less Than 30 KWh, and More), and Geography. The Market Forecasts are Provided in Terms of Value (USD).
Global EV Taxi Market Trends and Insights
Total-Cost-of-Ownership Parity by 2026
Rapid battery cost declines-now under USD 100 per kWh-and high fuel prices drive economic inflection. In high-mileage taxi duty cycles, fuel and maintenance savings offset higher upfront pricing within three years of operation. Incentive structures such as purchase rebates and accelerated depreciation compress the payback horizon further. Operators consequently rewrite internal rate-of-return models around electric drivetrains rather than diesel powertrains. Lenders respond by offering longer-tenor, lower-coupon debt backed by predictable cash-flow savings.
Ride-Hailing Platform Electrification Commitments
Platforms use sustainability targets to differentiate and secure investor capital. Uber is striving toward its global sustainability objectives, pledging to achieve a zero-emission fleet by 2040. This goal is bolstered by strategic alliances and extensive procurement strategies, highlighted by a letter of intent to acquire electric vehicles from top manufacturers like BYD. Such actions indicate a transition from mere aspiration to tangible execution, empowering Uber to shape supply chains and set benchmarks in urban mobility. Meanwhile, Lyft offers riders "Green" options for a premium fare, subtly steering its driver partners towards electric models. Such guarantees create durable demand that underpins volume purchasing, catalyzing factory allocation for taxi-optimized trims.
High Vehicle Downtime Due to Charging
Electric taxis spend more time off-duty than gasoline equivalents because charging sessions are longer and queuing is common at peak hours. Operators in dense cities feel the pinch when simultaneous shift changes coincide with charger congestion. Lost service minutes translate directly to revenue attrition and tip reductions, making some drivers reluctant to convert even when subsidies exist. The constraint is expected to ease as megawatt charging and better load-management software scale, yet near-term capacity gaps still dampen adoption.
Other drivers and restraints analyzed in the detailed report include:
- Government Zero-Emission Taxi Mandates
- Expansion of Rapid-Charging Hubs at Airports and Urban Cores
- Uncertain Residual Values for Used E-Taxis
For complete list of drivers and restraints, kindly check the Table Of Contents.
Segment Analysis
Battery electric vehicles represented 62.72% share of the EV taxi market in 2025, illustrating that the electric vehicle taxi market favors drivetrain simplicity and low servicing costs. Plug-in hybrids, however, are gaining swiftly at a 26.8% CAGR through 2031, as operators hedge against sparse highway chargers in peri-urban zones. Therefore, the electric vehicle taxi industry will likely see dual-track procurement strategies until nationwide charging density normalizes. Forward-looking operators already pivot to pure electric in regions planning to exclude hybrids from zero-emission definitions after 2028. Meanwhile, fuel-cell pilots remain confined to hydrogen-corridor projects, collectively under 1% of the current electric vehicle taxi market.
Second-generation PHEVs pair 20+ kWh batteries with efficient range-extenders, allowing 80 km electric-only range that covers most intra-city trips. This flexibility appeals to mid-tier fleet operators who are balancing capex and uptime considerations. Nonetheless, when comparing five-year cash flows, analysts see BEVs achieving a lower net-present cost as soon as charger queuing times fall below twelve minutes. That inflection could lock in BEV dominance by the late decade.
Four-wheeler sedans and hatchbacks commanded 73.46% of the electric vehicle taxi market share during 2025, thanks to entrenched regulations and passenger comfort expectations. Yet electric motorcycles and scooters are registering a brisk 27.9% CAGR through 2031, led by Indonesia, India, and Vietnam, where narrow streets, low fares, and modular battery packs propel adoption. These two-wheeler formats often need 3-8 kWh batteries, opening the door to curbside swapping that restores full range in under two minutes.
Regulators increasingly recognize two-wheelers as legitimate taxi categories, issuing digital permits linked to platform apps. That legitimacy improves driver income visibility and accelerates financing availability. Minivans and MPVs retain a role in multi-passenger airport routes. Still, they are not forecast to materially disrupt the dominance of smaller four-wheelers within the electric vehicle taxi market size metrics.
Complete Report Scope:
- By Propulsion Type
- Battery Electric Vehicle (BEV)
- Plug-in Hybrid Electric Vehicle (PHEV)
- Hybrid Electric Vehicle (HEV)
- Fuel-Cell Electric Vehicle (FCEV)
- By Vehicle Type
- Two-wheeler Taxi
- Three-wheeler Taxi
- Four-wheeler Taxi (Sedan/Hatchback)
- Multi-Purpose Vehicle / Minivan
- By Service Model
- Ride-hailing (On-demand)
- Ride-sharing (Pooling)
- Corporate / Institutional Fleet
- Airport and Tourism Shuttle
- By Ownership Model
- Fleet-Owned / Operator
- Driver-Owned
- Leasing and Subscription
- By Battery Capacity
- Less than 30 kWh
- 30-60 kWh
- Above 60 kWh
- By Geography
- North America
- United States
- Canada
- Rest of North America
- South America
- Brazil
- Argentina
- Rest of South America
- Europe
- Germany
- United Kingdom
- France
- Italy
- Spain
- Netherlands
- Norway
- Russia
- Rest of Europe
- Asia-Pacific
- China
- India
- Japan
- South Korea
- Australia
- Indonesia
- Thailand
- Rest of Asia-Pacific
- Middle East and Africa
- United Arab Emirates
- Saudi Arabia
- Turkey
- Egypt
- South Africa
- Rest of Middle East and Africa
- North America
Geography Analysis
Asia-Pacific holds 43.02% share of the EV taxi market in 2025, reflecting China's manufacturing heft, India's two-wheeler boom, and proactive policy incentives in Japan, South Korea, and Australia. Provincial dual-credit schemes in China allow fleet operators to trade compliance certificates, improving project economics. India's FAME-II subsidies, meanwhile, boost localization of battery packs and chargers, deepening domestic supply chains that stabilize retail pricing.
The Middle East and Africa will record the fastest 28.45% CAGR through 2031, led by the United Arab Emirates' zero-emission ground-transport vision for Expo 2030 and Saudi Arabia's NEOM smart-city blueprint. Generous electricity tariffs and abundant solar capacity further reduce operating costs. Egypt and Morocco are rolling out green-bond-funded taxi electrification schemes, drawing on multilaterals for concessional finance.
California's Advanced Clean Fleets rule sets the tone, while New York City caps new internal-combustion taxi medallions. Europe benefits from mature public charging networks, but lingering energy-price volatility still impacts driver payback calculations. South America trails due to exchange-rate risk and elevated cost of capital, yet Brazil and Colombia have begun piloting tariff discounts for overnight fleet charging.
- Lyft Inc.
- Ola Electric Mobility Pvt Ltd. (Ola Cabs)
- Uber Technologies Inc.
- Grab Holdings Ltd.
- Didi Chuxing Technology Co.
- GoGreen Cabs
- Phoenix Taxis
- CAB-EEZ Infra Tech Ltd
- XANHSM Green and Smart Mobility Indonesia (GSM)
- Prakriti E-Mobility Private Limited (Evera Cabs)
- eee-Mobility Solutions Private Limited
- Electric Cab North America
- Free Now GmbH
- Addison Lee Limited
- G7 New Energy Taxi (Beijing) Co.
- Yandex Go
- Bolt Technology OU
Additional Benefits:
- The market estimate (ME) sheet in Excel format
- 3 months of analyst support
TABLE OF CONTENTS
1 Introduction
- 1.1 Study Assumptions and Market Definition
- 1.2 Scope of the Study
2 Research Methodology
3 Executive Summary
4 Market Landscape
- 4.1 Market Overview
- 4.2 Market Drivers
- 4.2.1 Government Zero-Emission Taxi Mandates
- 4.2.2 Total-Cost-Of-Ownership (TCO) Parity By 2026
- 4.2.3 Expansion Of Rapid-Charging Hubs at Airports/Urban Cores
- 4.2.4 Ride-Hailing Platform Electrification Commitments
- 4.2.5 ESG-Linked Municipal Financing Programs
- 4.2.6 Battery-as-a-Service Subscription Economics
- 4.3 Market Restraints
- 4.3.1 High Vehicle Downtime Due To Charging
- 4.3.2 Uncertain Residual Values for Used E-Taxis
- 4.3.3 Urban Grid-Capacity Bottlenecks
- 4.3.4 OEM Production Priority Away from Taxi Variants
- 4.4 Value / Supply-Chain Analysis
- 4.5 Regulatory Landscape
- 4.6 Technological Outlook
- 4.7 Porter's Five Forces
- 4.7.1 Threat of New Entrants
- 4.7.2 Bargaining Power of Buyers
- 4.7.3 Bargaining Power of Suppliers
- 4.7.4 Threat of Substitutes
- 4.7.5 Intensity of Competitive Rivalry
5 Market Size and Growth Forecasts (Value (USD))
- 5.1 By Propulsion Type
- 5.1.1 Battery Electric Vehicle (BEV)
- 5.1.2 Plug-in Hybrid Electric Vehicle (PHEV)
- 5.1.3 Hybrid Electric Vehicle (HEV)
- 5.1.4 Fuel-Cell Electric Vehicle (FCEV)
- 5.2 By Vehicle Type
- 5.2.1 Two-wheeler Taxi
- 5.2.2 Three-wheeler Taxi
- 5.2.3 Four-wheeler Taxi (Sedan/Hatchback)
- 5.2.4 Multi-Purpose Vehicle / Minivan
- 5.3 By Service Model
- 5.3.1 Ride-hailing (On-demand)
- 5.3.2 Ride-sharing (Pooling)
- 5.3.3 Corporate / Institutional Fleet
- 5.3.4 Airport and Tourism Shuttle
- 5.4 By Ownership Model
- 5.4.1 Fleet-Owned / Operator
- 5.4.2 Driver-Owned
- 5.4.3 Leasing and Subscription
- 5.5 By Battery Capacity
- 5.5.1 Less than 30 kWh
- 5.5.2 30-60 kWh
- 5.5.3 Above 60 kWh
- 5.6 By Geography
- 5.6.1 North America
- 5.6.1.1 United States
- 5.6.1.2 Canada
- 5.6.1.3 Rest of North America
- 5.6.2 South America
- 5.6.2.1 Brazil
- 5.6.2.2 Argentina
- 5.6.2.3 Rest of South America
- 5.6.3 Europe
- 5.6.3.1 Germany
- 5.6.3.2 United Kingdom
- 5.6.3.3 France
- 5.6.3.4 Italy
- 5.6.3.5 Spain
- 5.6.3.6 Netherlands
- 5.6.3.7 Norway
- 5.6.3.8 Russia
- 5.6.3.9 Rest of Europe
- 5.6.4 Asia-Pacific
- 5.6.4.1 China
- 5.6.4.2 India
- 5.6.4.3 Japan
- 5.6.4.4 South Korea
- 5.6.4.5 Australia
- 5.6.4.6 Indonesia
- 5.6.4.7 Thailand
- 5.6.4.8 Rest of Asia-Pacific
- 5.6.5 Middle East and Africa
- 5.6.5.1 United Arab Emirates
- 5.6.5.2 Saudi Arabia
- 5.6.5.3 Turkey
- 5.6.5.4 Egypt
- 5.6.5.5 South Africa
- 5.6.5.6 Rest of Middle East and Africa
- 5.6.1 North America
6 Competitive Landscape
- 6.1 Market Concentration
- 6.2 Strategic Moves
- 6.3 Market Share Analysis
- 6.4 Company Profiles (Includes Global and Market Level Overview, Core Segments, Financials, Strategic Info, Market Share, Products, Services & Recent Developments)
- 6.4.1 Lyft Inc.
- 6.4.2 Ola Electric Mobility Pvt Ltd. (Ola Cabs)
- 6.4.3 Uber Technologies Inc.
- 6.4.4 Grab Holdings Ltd.
- 6.4.5 Didi Chuxing Technology Co.
- 6.4.6 GoGreen Cabs
- 6.4.7 Phoenix Taxis
- 6.4.8 CAB-EEZ Infra Tech Ltd
- 6.4.9 XANHSM Green and Smart Mobility Indonesia (GSM)
- 6.4.10 Prakriti E-Mobility Private Limited (Evera Cabs)
- 6.4.11 eee-Mobility Solutions Private Limited
- 6.4.12 Electric Cab North America
- 6.4.13 Free Now GmbH
- 6.4.14 Addison Lee Limited
- 6.4.15 G7 New Energy Taxi (Beijing) Co.
- 6.4.16 Yandex Go
- 6.4.17 Bolt Technology OU

 全球計程車和豪華轎車服務市場
 東協計程車市場:市佔率分析、產業趨勢與統計及成長預測(2026-2031)
 計程車市場規模、市場佔有率、成長、全球產業分析、區域趨勢及2026-2034年預測。
 計程車服務市場:全球市場預測,2026-2032年計程車:市場佔有率分析、產業趨勢和統計數據、成長預測(2026-2031 年)摩托計程車服務市場-2026-2032年全球市場預測摩托車計程車服務市場-2026-2032年全球市場預測新能源汽車計程車市場:2026-2032年全球市場預測(按車輛類型、車身尺寸、驅動技術、續航里程、服務類型和最終用戶分類)
 2026年全球計程車服務市場報告豪華轎車服務市場:2026-2032年全球市場預測(依服務類型、時間長度、車輛燃料類型、車輛類型、最終用戶和預訂方式分類)