


 |
市場調查報告書
商品編碼
2115169
蒸氣鍋爐系統:市場佔有率分析、產業趨勢與統計、成長預測(2026-2031)Steam Boiler System - Market Share Analysis, Industry Trends & Statistics, Growth Forecasts (2026 - 2031) |
||||||

※ 本網頁內容可能與最新版本有所差異。詳細情況請與我們聯繫。
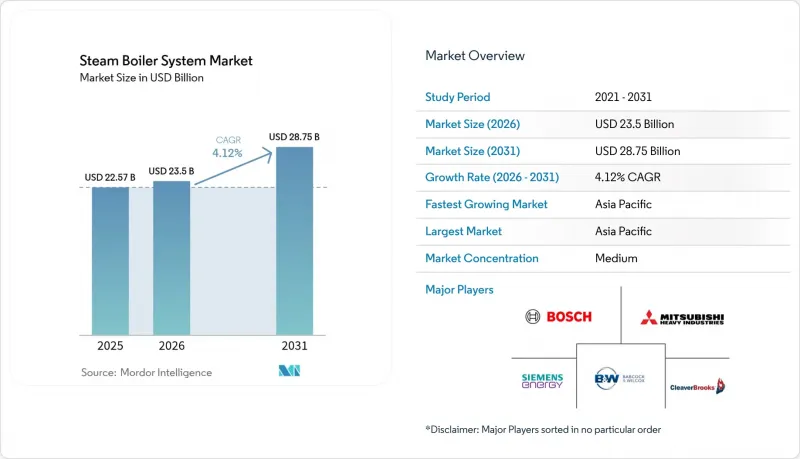
根據 Mordor Intelligence 預測,蒸氣鍋爐系統市場規模將從 2025 年的 225.7 億美元成長到 2026 年的 235 億美元,然後在 2031 年達到 287.5 億美元,2026 年至 2031 年的複合年成長率為 4.12%。
本報告按鍋爐類型(水管式、電極式/電式、其他)、燃料類型(天然氣/生質能、氫氣/合成燃料、其他)、生產能力(10-150 BHP、600 BHP 以上/利用規模、其他)、技術(冷凝式和非冷凝式)、最終用途工業(發電、製藥、化工、其他)和地區(北美、其他分類)、亞太、歐洲分類、其他)和地區。
全球蒸氣鍋爐系統市場趨勢與洞察
嚴格的排放法規
美國環保署 (EPA) 的 NESHAP 法規要求對功率超過 10 MMBtu/h 的鍋爐進行每兩年一次的調整和持續監測,從而鼓勵對低氮氧化物燃燒器、選擇性催化還原 (SCR) 技術和替代燃料進行投資。印度也在收緊類似的法規,目前正在討論的「2024 年鍋爐法案」將提高約 400 萬台鍋爐的檢查頻率,從而推動了對自診斷控制系統的需求。由於合規成本可能高達專案總預算的 15%,營運商往往傾向於選擇整合排放氣體處理系統、控制系統和服務合約的成套解決方案。這些法規正在推動水管和電極式鍋爐的設計發展,這些設計本身燃燒更清潔,並且能夠支援全電加熱。供應商正在將數位孿生技術(將合規儀表板與企業軟體整合)定位為檢驗即時效能和避免因違反法規而受到處罰的最具成本效益的方法。
食品和飲料加工能力快速成長
對低溫運輸的投資和更嚴格的衛生規程正在推動對符合製藥純度標準的食品級蒸氣的需求。撬裝式蒸汽鍋爐因其安裝時間比中央鍋爐房縮短高達 50% 而備受青睞,使加工商能夠根據季節性需求高峰調整產能。物聯網探頭可將即時資料流品質的資訊即時傳輸給生產線操作員,從而降低產品變質風險並簡化監管審核。不斷上漲的能源成本也促使人們對包裝車間用冷凝式火管鍋爐的興趣日益濃厚。同時,電極式蒸汽鍋爐系統幾乎可以瞬間為原位預熱 (SIP) 生產線提供不含燃燒污染物的潔淨蒸氣。這些優勢的結合正在擴大食品業蒸氣鍋爐系統的市場規模。
高昂的初始資本支出(Capex)和營運維護(O&M)成本
標準公用設施的建造成本為每噸小時 6,000 至 13,000 美元,但如果加上水處理、節熱器和網路安全控制系統,其生命週期成本將增加 40% 至 60%。由於中小企業難以資金籌措這些支出,原始設備製造商 (OEM) 開始提案「蒸汽即服務 (SaaS)」契約,客戶按噸付費,而供應商則承擔資產的所有權和維護義務。數位孿生技術可以減少意外停機時間,但其開發和數據整合成本會使專案資本增加 3% 至 5%,這在資本成本高達兩位數的新興市場構成了一大障礙。
細分市場分析
預計到2025年,水管鍋爐將佔蒸汽鍋爐市場57.86%的銷量,並繼續保持其在蒸氣鍋爐系統市場的主導地位。其較大的熱交換面積使其能夠承受600度C和270 bar的運作條件,因此廣泛應用於發電廠和石化廠。火管鍋爐由於製造流程更簡單、初始成本更低,在中等規模、壓力不超過250 psig的應用中仍然很受歡迎。同時,盤管式鍋爐和單程鍋爐在安裝面積比容量更重要的場合表現出色。
電極/電鍋爐的性能優於所有其他類型的鍋爐,複合年成長率高達 6.08%。兩者均能實現 99.9% 的電熱轉換效率和瞬時功率調節,因此在區域供熱和製藥行業的滅菌製程中備受青睞。 Vicinity Energy 在劍橋安裝的 42 兆瓦裝置便是其規模潛力的絕佳例證,該裝置為佔地 3000 萬平方英尺的物業提供無碳蒸氣。隨著再生能源價格的下降和電力普及率的提高,蒸氣鍋爐系統市場正在不斷擴張。
2025年,天然氣和生質能的銷售額仍佔總銷售額的41.62%,這得益於管道網路的建設以及它們作為可再生能源的良好口碑。頁岩氣生產保障了北美天然氣供應的穩定性,而生質能用戶則受惠於紙漿和造紙產業循環經濟的獎勵。由於空氣品質法規的實施,燃油發電廠的使用量正在下降,燃煤發電廠也正根據2030年至2035年間的逐步淘汰令逐步淘汰。
氫氣和合成燃料的複合年成長率最高,達5.63%。 2024年,威斯曼公司交付了其首個100%相容氫氣的冷凝水鍋爐系列。煉油廠已經開始生產廢氣氫氣,為現場蒸氣發生提供了一種低成本的原料。可在氫氣、天然氣和生物合成氣之間切換的混合燃燒器,憑藉其多燃料柔軟性,能夠緩解供應波動,並提升蒸氣鍋爐系統市場的吸引力。
區域分析
預計到2025年,亞太地區將佔全球銷售額的39.05%,並將在2031年之前以4.74%的複合年成長率成長。中國的煉油廠、水泥廠和化工聯合企業是基本負載蒸氣的主要來源,而印度的「印度製造」計畫正在推動中型成套設備的銷售。日本和韓國正在投資研發氫能相容於燃燒技術和超高效冷凝鍋爐陣列,並將這些創新技術出口到其東協成員國。
在北美,對設備更新的需求已趨於成熟。價格低廉的頁岩氣正在推動水管鍋爐的維修,而加州和東北部的脫碳計劃則促進了利用電力和氫能的試點項目的進展。隨著電力公司將營運數據貨幣化,採用數位孿生技術的服務合約也日益普及。
在歐洲,煤炭淘汰進程正在加速,資金正重新分配給生質能熱電聯產(CHP)和氫氣混合燃氣鍋爐。中東和非洲的成長動能強勁,成長超過5%,這主要得益於沙烏地阿拉伯的產業多元化和非洲工業走廊的建設。儘管預計南美洲的紙漿廠、礦業廠和農產品加工廠的訂單將保持穩定,但外匯波動正促使買家轉向模組化、「隨著業務成長分階段部署」的方案。這些趨勢共同推動了蒸氣鍋爐系統市場的均衡擴張。
其他福利
- Excel格式的市場預測(ME)表
- 3個月的分析師支持
目錄
第1章:引言
- 研究假設和市場定義
- 調查範圍
第2章:調查方法
第3章執行摘要
第4章 市場狀況
- 市場概覽
- 市場促進因素
- 嚴格的排放氣體法規
- 食品飲料加工能力快速成長(新冠疫情後低溫運輸蓬勃發展)
- 亞洲和非洲新興國家電力生產能力的擴張
- 將煉油廠鍋爐改造為與氫氣相容的系統。
- 利用數位孿生進行預測性維護
- 用於FPSO的模組化海上蒸汽產生器
- 市場限制因素
- 高昂的初始資本支出(Capex)和營運維護(O&M)成本
- 天然氣和煤炭價格波動
- 經合組織國家合格鍋爐操作員短缺
- 高合金管材中鎳鉻合金的供應風險
- 供應鏈分析
- 監理情勢
- 科技趨勢(人工智慧、物聯網、氫兼容材料)
- 波特五力模型
第5章 市場規模與成長預測
- 依鍋爐類型
- 水管式
- 火管式
- 線圈式/單程式
- 電極類型/電氣類型
- 按燃料類型
- 天然氣和生質能
- 油
- 煤炭
- 氫能和合成燃料
- 按產能(必和必拓)
- 10~150BHP
- 151~300BHP
- 301~600BHP
- 超過 600 匹馬力 / 實際規模
- 透過技術
- 簡寫型
- 非冷凝式
- 按最終用途行業分類
- 發電
- 石油煉製/石油化工
- 飲食
- 化學
- 紙漿和造紙
- 製藥
- 其他(紡織品、橡膠等)
- 按地區
- 北美洲
- 美國
- 加拿大
- 墨西哥
- 歐洲
- 德國
- 英國
- 法國
- 義大利
- 西班牙
- 俄羅斯
- 其他歐洲國家
- 亞太地區
- 中國
- 印度
- 日本
- 韓國
- 澳洲
- ASEAN
- 其他亞太國家
- 南美洲
- 阿根廷
- 巴西
- 其他南美國家
- 中東和非洲
- 沙烏地阿拉伯
- 阿拉伯聯合大公國
- 南非
- 埃及
- 其他中東和非洲國家
- 北美洲
第6章 競爭情勢
- 市場集中度
- 策略趨勢(併購、聯盟、購電協議)
- 市場佔有率分析(主要公司的市場排名和市場佔有率)
- 公司簡介
- Bosch Industriekessel
- Babcock & Wilcox Enterprises
- Mitsubishi Heavy Industries
- Siemens Energy
- Cleaver-Brooks
- Fulton Boiler Works
- Hurst Boiler & Welding
- General Electric
- ANDRITZ AG
- Forbes Marshall
- Thermax Ltd.
- Miura Co., Ltd.
- IHI Corporation
- Johnston Boiler Company
- Harbin Electric Boiler Co.
- Zhangjiagang Future Boiler
- Viessmann Group
- Superior Boiler
- Liming Energy Equipment
- Dongfang Boiler Group
第7章 市場機會與未來展望
According to Mordor Intelligence, the steam boiler system market size is expected to grow from USD 22.57 billion in 2025 to USD 23.5 billion in 2026 and is forecast to reach USD 28.75 billion by 2031 at 4.12% CAGR over 2026-2031.
This report is Segmented by Boiler Type (Water-Tube, Electrode/Electric, and More), Fuel Type (Natural Gas and Biomass, Hydrogen and Synthetic Fuels, and More), Capacity (10 To 150 BHP, Above 600 BHP/Utility-Scale, and More), Technology (Condensing and Non-Condensing), End-Use Industry (Power Generation, Pharmaceuticals, Chemicals, and More), and Geography (North America, Europe, Asia-Pacific, and More).
Global Steam Boiler System Market Trends and Insights
Stringent Emission-Control Regulations
The U.S. EPA's NESHAP mandate compels biennial tune-ups and continuous monitoring for boilers above 10 MMBtu/h, driving investment in low-NOx burners, selective catalytic reduction, and alternative fuels. Similar tightening is underway in India, where the pending Boilers Bill 2024 raises inspection frequency for roughly 4 million units, prompting demand for self-diagnostic control systems. Compliance outlays can reach 15% of total project budgets, so operators gravitate toward bundled solutions that integrate emission hardware, controls, and service contracts. These rules favor water-tube and electrode designs that inherently accommodate cleaner combustion or all-electric heating. By linking compliance dashboards to enterprise software, suppliers position digital twins as the least-cost pathway to verify real-time performance and avoid non-compliance penalties.
Surging Food & Beverage Processing Capacity
Cold-chain investments and stricter sanitation protocols have sharpened demand for culinary-grade steam that matches pharmaceutical purity benchmarks. Skid-mounted packages appeal because they curb installation time by up to 50% compared with central boiler rooms, letting processors align capacity with seasonal peaks. IoT probes now stream live-stream-quality data to line operators, cutting product-spoilage risk and simplifying regulatory audits. Rising utility bills amplify interest in condensing fire-tube units for packaging halls, whereas electrode systems supply near-instantaneous clean steam for SIP lines without combustion-related contaminants. These features collectively enlarge the food sector's steam boiler system market footprint.
High Upfront Capex & O&M Costs
Standard utility builds cost USD 6,000-13,000 per ton-hour, with water treatment, economizers, and cybersecure controls lifting lifecycle spend by 40-60%. Smaller firms struggle to finance such outlays, so OEMs now pitch steam-as-a-service contracts in which clients pay a per-ton tariff while suppliers retain asset ownership and maintenance obligations. Digital twins cut unscheduled outages, but their development and data-integration fees add 3-5% to project capital, a hurdle in emerging markets where the cost of capital hovers in double digits.
Other drivers and restraints analyzed in the detailed report include:
- Power-Plant Capacity Additions in Emerging Asia & Africa
- Hydrogen-Ready Boiler Retrofits in Refineries
- Volatile Natural-Gas & Coal Prices
For complete list of drivers and restraints, kindly check the Table Of Contents.
Segment Analysis
Water-tube units generated 57.86% of 2025 revenue, a commanding steam boiler system market lead. Their large surface area handles 600 °C and 270 bar service, a power and petrochemical complexes. Fire-tube designs remain popular in mid-range duties up to 250 psig due to simpler fabrication and lower upfront cost, while coil/once-through variants excel where footprint trumps capacity.
Electrode/electric boilers outpace every other type at a 6.08% CAGR. They deliver 99.9% electrical-to-thermal efficiency and instant modulation, prized in district energy and pharma sterilization. Vicinity Energy's 42 MW Cambridge installation exemplifies scale possibilities, supplying carbon-free steam to 30 million ft2 of real estate. As renewable electricity cheapens, electric penetration deepens, broadening the steam boiler system market.
Natural gas and biomass retained 41.62% of 2025 sales, thanks to pipeline reach and renewable credentials. Shale output underpins North American gas security, while biomass rollers benefit from circular-economy incentives in pulp and paper lines. Oil burners fade amid air-quality rules, and coal units retire under 2030-2035 phase-out edicts.
Hydrogen and synthetic fuels clock the fastest 5.63% CAGR. Viessmann shipped its first 100% H2-ready condensing boiler line in 2024. Refineries already produce off-gas hydrogen, offering low-cost feedstock for on-site steam. Hybrid burners that swap between H2, nat-gas, and bio-syngas mitigate supply volatility, reinforcing the steam boiler system market appeal of multi-fuel flexibility.
Complete Report Scope:
- By Boiler Type
- Water-Tube
- Fire-Tube
- Coil/Once-Through
- Electrode/Electric
- By Fuel Type
- Natural Gas and Biomass
- Oil
- Coal
- Hydrogen and Synthetic Fuels
- By Capacity (BHP)
- 10 to 150 BHP
- 151 to 300 BHP
- 301 to 600 BHP
- Above 600 BHP/Utility-Scale
- By Technology
- Condensing
- Non-condensing
- By End-Use Industry
- Power Generation
- Oil Refineries and Petrochemicals
- Food and Beverage
- Chemicals
- Pulp and Paper
- Pharmaceuticals
- Others (Textile, Rubber, etc.)
- By Geography
- North America
- United States
- Canada
- Mexico
- Europe
- Germnay
- United Kingdom
- France
- Italy
- Spain
- Russia
- Rest of Europe
- Asia Pacific
- China
- India
- Japan
- South Korea
- Australia
- ASEAN Countries
- Rest of Asia Pacific
- South America
- Argentina
- Brazil
- Rest of South America
- Middle East and Africa
- Saudi Arabia
- United Arab Emirates
- South Africa
- Egypt
- Rest of Middle East and Africa
- North America
Geography Analysis
Asia-Pacific generated 39.05% of global revenue in 2025 and expanded at a 4.74% CAGR through 2031. China's refinery, cement, and chemicals complexes fuel base-load steam, while India's Make-in-India program spurs mid-range package sales. Japan and South Korea invest in hydrogen-ready combustion and ultra-efficient condensing arrays, exporting those innovations across ASEAN sites.
North America shows mature replacement demand. Cheap shale gas sustains water-tube retrofits, but decarbonization policies in California and the Northeast propel electric and hydrogen pilots. Digital-twin service contracts gain traction as utilities monetize operational data.
Europe hastens away from coal, reallocating funds to biomass CHP and H2-blend gas boilers. The Middle East & Africa region charts a 5%-plus trajectory on the back of Saudi industrial diversification and African industrialization corridors. South America's pulp, mining, and agro-processing plants deliver steady orders, though currency volatility nudges buyers toward modular, pay-as-you-grow packages. Collectively, these currents keep the steam boiler system market in balanced expansion.
- Bosch Industriekessel
- Babcock & Wilcox Enterprises
- Mitsubishi Heavy Industries
- Siemens Energy
- Cleaver-Brooks
- Fulton Boiler Works
- Hurst Boiler & Welding
- General Electric
- ANDRITZ AG
- Forbes Marshall
- Thermax Ltd.
- Miura Co., Ltd.
- IHI Corporation
- Johnston Boiler Company
- Harbin Electric Boiler Co.
- Zhangjiagang Future Boiler
- Viessmann Group
- Superior Boiler
- Liming Energy Equipment
- Dongfang Boiler Group
Additional Benefits:
- The market estimate (ME) sheet in Excel format
- 3 months of analyst support
TABLE OF CONTENTS
1 Introduction
- 1.1 Study Assumptions & Market Definition
- 1.2 Scope of the Study
2 Research Methodology
3 Executive Summary
4 Market Landscape
- 4.1 Market Overview
- 4.2 Market Drivers
- 4.2.1 Stringent emission?control regulations
- 4.2.2 Surging food & beverage processing capacity (post-COVID cold-chain boom)
- 4.2.3 Power?plant capacity additions in emerging Asia & Africa
- 4.2.4 Hydrogen-ready boiler retrofits in refineries
- 4.2.5 Digital-twin enabled predictive maintenance
- 4.2.6 Modular offshore steam generators for FPSOs
- 4.3 Market Restraints
- 4.3.1 High upfront capex & O&M costs
- 4.3.2 Volatile natural-gas & coal prices
- 4.3.3 Shortage of certified boilermakers in OECD
- 4.3.4 Nickel & chromium supply risk for high-alloy tubing
- 4.4 Supply-Chain Analysis
- 4.5 Regulatory Landscape
- 4.6 Technological Outlook (AI, IoT, hydrogen-ready materials)
- 4.7 Porter's Five Forces
- 4.7.1 Bargaining Power of Suppliers
- 4.7.2 Bargaining Power of Buyers
- 4.7.3 Threat of New Entrants
- 4.7.4 Threat of Substitutes
- 4.7.5 Competitive Rivalry
5 Market Size & Growth Forecasts
- 5.1 By Boiler Type
- 5.1.1 Water-Tube
- 5.1.2 Fire-Tube
- 5.1.3 Coil/Once-Through
- 5.1.4 Electrode/Electric
- 5.2 By Fuel Type
- 5.2.1 Natural Gas and Biomass
- 5.2.2 Oil
- 5.2.3 Coal
- 5.2.4 Hydrogen and Synthetic Fuels
- 5.3 By Capacity (BHP)
- 5.3.1 10 to 150 BHP
- 5.3.2 151 to 300 BHP
- 5.3.3 301 to 600 BHP
- 5.3.4 Above 600 BHP/Utility-Scale
- 5.4 By Technology
- 5.4.1 Condensing
- 5.4.2 Non-condensing
- 5.5 By End-Use Industry
- 5.5.1 Power Generation
- 5.5.2 Oil Refineries and Petrochemicals
- 5.5.3 Food and Beverage
- 5.5.4 Chemicals
- 5.5.5 Pulp and Paper
- 5.5.6 Pharmaceuticals
- 5.5.7 Others (Textile, Rubber, etc.)
- 5.6 By Geography
- 5.6.1 North America
- 5.6.1.1 United States
- 5.6.1.2 Canada
- 5.6.1.3 Mexico
- 5.6.2 Europe
- 5.6.2.1 Germnay
- 5.6.2.2 United Kingdom
- 5.6.2.3 France
- 5.6.2.4 Italy
- 5.6.2.5 Spain
- 5.6.2.6 Russia
- 5.6.2.7 Rest of Europe
- 5.6.3 Asia Pacific
- 5.6.3.1 China
- 5.6.3.2 India
- 5.6.3.3 Japan
- 5.6.3.4 South Korea
- 5.6.3.5 Australia
- 5.6.3.6 ASEAN Countries
- 5.6.3.7 Rest of Asia Pacific
- 5.6.4 South America
- 5.6.4.1 Argentina
- 5.6.4.2 Brazil
- 5.6.4.3 Rest of South America
- 5.6.5 Middle East and Africa
- 5.6.5.1 Saudi Arabia
- 5.6.5.2 United Arab Emirates
- 5.6.5.3 South Africa
- 5.6.5.4 Egypt
- 5.6.5.5 Rest of Middle East and Africa
- 5.6.1 North America
6 Competitive Landscape
- 6.1 Market Concentration
- 6.2 Strategic Moves (M&A, Partnerships, PPAs)
- 6.3 Market Share Analysis (Market Rank/Share for key companies)
- 6.4 Company Profiles (includes Global level Overview, Market level overview, Core Segments, Financials as available, Strategic Information, Products & Services, and Recent Developments)
- 6.4.1 Bosch Industriekessel
- 6.4.2 Babcock & Wilcox Enterprises
- 6.4.3 Mitsubishi Heavy Industries
- 6.4.4 Siemens Energy
- 6.4.5 Cleaver-Brooks
- 6.4.6 Fulton Boiler Works
- 6.4.7 Hurst Boiler & Welding
- 6.4.8 General Electric
- 6.4.9 ANDRITZ AG
- 6.4.10 Forbes Marshall
- 6.4.11 Thermax Ltd.
- 6.4.12 Miura Co., Ltd.
- 6.4.13 IHI Corporation
- 6.4.14 Johnston Boiler Company
- 6.4.15 Harbin Electric Boiler Co.
- 6.4.16 Zhangjiagang Future Boiler
- 6.4.17 Viessmann Group
- 6.4.18 Superior Boiler
- 6.4.19 Liming Energy Equipment
- 6.4.20 Dongfang Boiler Group
7 Market Opportunities & Future Outlook
- 7.1 White-space & Unmet-need Assessment

 蒸氣鍋爐系統市場:2026-2032年全球市場預測(依燃料類型、鍋爐類型、安裝類型、容量範圍和應用分類)
 蒸氣鍋爐除氣罐市場預測至2034年-按產品類型、容量、材質、銷售管道、技術、最終用戶和地區分類的全球分析
 全球商用蒸氣鍋爐市場規模、佔有率、趨勢和成長分析報告:2026-2034年燃氣蒸氣鍋爐系統市場按壓力類型、安裝類型、燃料類型、產品類型、容量範圍和應用分類,全球預測(2026-2032年)
 燃氣渦輪機和蒸氣渦輪:全球市場蒸氣鍋爐系統市場:預測(2025-2030 年)
 全球工業用燃氣低溫鍋爐市場
 蒸汽鍋爐系統市場-全球產業規模、佔有率、趨勢、機會和預測,按鍋爐類型、按組件、按最終用途行業、按地區和競爭情況細分,2020-2030 年
 商用蒸汽鍋爐市場機會、成長動力、產業趨勢分析及 2025 - 2034 年預測蒸汽鍋爐市場機會、成長動力、產業趨勢分析及 2025 - 2034 年預測