


 |
市場調查報告書
商品編碼
2115159
美國報關代理:市場佔有率分析、行業趨勢和統計數據、成長預測(2026-2031 年)US Customs Brokerage - Market Share Analysis, Industry Trends & Statistics, Growth Forecasts (2026 - 2031) |
||||||

※ 本網頁內容可能與最新版本有所差異。詳細情況請與我們聯繫。
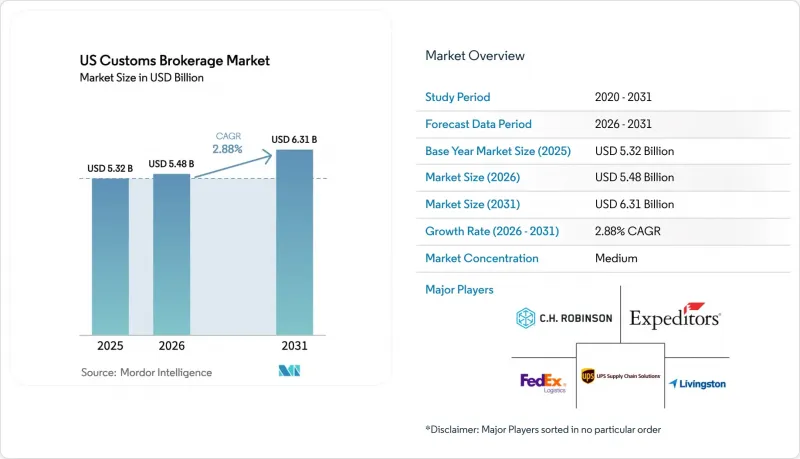
根據 Mordor Intelligence 估計,美國海關經紀市場在 2026 年的價值為 54.8 億美元,預計在預測期(2026-2031 年)內將以 2.88% 的複合年成長率成長,到 2031 年達到 63.1 億美元。
美國報關代理市場的趨勢與洞察
海關清關流程的數位化和自動化
自動化商業環境 (ACE) 的採用率已達 98%,每年處理超過 3,500 萬份正式海關申報單。透過與合作夥伴機構的協作,海關處理週期已從數天縮短至數小時。領先的報關行已採用基於機器學習的分類工具,其編碼分配準確率超過 95%,從而減少了人工操作,使員工能夠專注於諮詢工作。美國海關與邊防安全局 (CBP) 2024-2028 年 IT藍圖撥款 18 億美元用於區塊鏈試點計畫和基於人工智慧的風險評分,這進一步提高了參與企業該市場的技術門檻。
電子商務中微型進口商的興起,導致他們需要頻繁辦理清關手續。
預計到2025年,將有超過40萬家美國公司進口商品,比2019年成長60%。其中,微型進口商將佔總數的38%。為了應對這一趨勢,數位仲介正在推出自助服務入口網站和固定費率模式,以吸引那些尋求透明定價的創業家。雖然像亞馬遜全球物流這樣的平台正在簡化跨境履約,但許多小規模托運人卻因錯誤分類貨物或忽視標籤法規而增加了合規風險。那些能夠在自動化和主動教育之間取得平衡的仲介正在贏得這部分分散客戶群的信任。
合格報關員短缺導致薪資上漲。
2025年10月,報關員執照考試的通過率降至15%以下,而報關員的平均年齡超過43歲。中級合格專業人員的薪資比2022年高出20-30%。由於資深員工退休,沒有自動化預算的小規模公司在服務交付方面面臨許多限制。
細分市場分析
到2025年,海運將占美國清關市場佔有率的58.63%,這主要得益於進口商對經濟高效的貨櫃運輸方式的偏好。隨著電子商務和對時間要求較高的行業將速度放在首位,預計到2031年,美國空運清關市場將以4.09%的複合年成長率成長。雖然快遞拼箱營運商正在利用一體化的海關服務來縮短清關週期,但西南走廊的陸路邊境卡車和鐵路進口業務正在蓬勃發展。
疫情後貨櫃運輸可靠性的提升雖然進一步鞏固了海運的成本優勢,但反覆出現的勞資糾紛和艙位分配限制導致一些托運人即使面臨更高的運費,也仍然選擇空運來運輸高價值貨物。擁有多模態專業知識的報關行最能贏得那些需要在季節性需求週期中平衡速度和成本的客戶。
到2025年,與貨運代理合作或與第三方物流(3PL)整合的企業將佔據65.46%的市場佔有率。這反映出托運人傾向於選擇「一站式」物流解決方案,將清關、運輸和倉儲整合在一起。同時,純粹的報關行正以3.51%的複合年成長率成長,因為在受FDA監管的商品和自由貿易區運作等複雜領域,需要專業知識。
Purolator於2025年2月以6.844億美元收購Livingston International,凸顯了產業重組的勢頭,因為綜合性營運商正在尋求更先進的合規能力。專業報關行則透過專注於行業特定專業知識和個人化服務來應對這一趨勢,而這些服務在大規模網路中難以複製。
其他福利
- Excel格式的市場預測(ME)表
- 3個月的分析師支持
目錄
第1章:引言
- 研究假設和市場定義;研究範圍
第2章:調查方法
第3章執行摘要
第4章 市場狀況
- 市場概覽
- 市場促進因素
- 疫情後美國進口量成長復甦
- 關稅和貿易協定規則的變化所帶來的複雜性
- 海關清關流程的數位化和自動化(ACE、PGA入口網站)
- 電子商務中微型進口商的興起,導致他們需要頻繁辦理清關手續。
- 將ACE數據的加值分析服務貨幣化
- 美國海關與邊境保護局的「21世紀海關框架」為報關員創造了新的增值角色。
- 市場限制因素
- 貿易政策波動性加劇會導致預測風險。
- 與準備有關強迫勞動和環境、社會及治理(ESG)的文件相關的合規成本增加。
- 由於合格報關員短缺,薪資上漲
- 自助報關軟體的普及正在侵蝕報關行的佣金利潤。
- 價值供應鏈分析
- 監理情勢
- 技術展望
- 波特五力模型
第5章 市場規模與成長預測
- 按服務類型
- 報關
- 貿易合規諮詢
- 關稅退稅/報銷服務
- 貨運仲介業務
- 透過交通工具
- 海
- 航空
- 追蹤
- 鐵路
- 按最終用戶行業分類
- 消費品和零售
- 車
- 電子與高科技
- 農業和食品
- 藥品和醫療保健
- 按客戶規模
- 大型進口商(年進口額達5,000萬美元或以上)
- 中型進口商(年營業額500萬美元至5,000萬美元)
- 小規模和微型進口商(低於500萬美元)
- 按地區
- 東北
- 中西部
- 東南部
- 西南
- 西
第6章 競爭情勢
- 市場集中度
- 策略趨勢
- 市佔率分析
- 公司簡介
- Expeditors International of Washington, Inc.
- CH Robinson Worldwide, Inc.
- UPS Supply Chain Solutions
- FedEx Logistics
- 利文斯頓國際(已被 Purolator 收購)
- DHL Global Forwarding
- Kuehne+Nagel Inc.
- DSV(incl. DB Schenker)
- AN Deringer, Inc.
- Flexport, Inc.
- CEVA物流(已被CMA CGM收購)
- OEC Group
- BDP International
- SEKO Logistics
- Kerry物流(美國)
- Nippon Express
- GEODIS USA
- CH Powell Co.
- Alba Wheels Up International
- GHY USA Inc.
第7章 市場機會與未來展望
According to Mordor Intelligence, the US customs brokerage market size is estimated at USD 5.48 billion in 2026, and is expected to reach USD 6.31 billion by 2031, at a CAGR of 2.88% during the forecast period (2026-2031).
This report is Segmented by Mode of Transport (Ocean / Sea, Air, and More), by Broker Type (Pure Customs Brokers and More), by Importer Size (Large Enterprises and More), by Digital Adoption (Traditional Brokerages and More), by End-Use Industry (Retail and E-Commerce and More), by Region (West, Southwest, and More). The Market Forecasts are Provided in Terms of Value (USD).
US Customs Brokerage Market Trends and Insights
Digitization and Automation of Customs Processes
Automated Commercial Environment adoption stands at 98%, handling above 35 million formal entries annually. Integration with partner agencies has compressed clearance cycles from days to hours. Leading brokers deploy machine-learning classification tools that achieve more than 95% code-assignment accuracy, cutting manual touchpoints and freeing staff for advisory work. CBP's 2024-2028 IT roadmap earmarks USD 1.8 billion for blockchain pilots and AI-based risk scoring, further raising the technology bar for market participants.
Rise of E-commerce Micro-Importers Requiring High-Frequency Clearances
More than 400,000 US businesses imported goods in 2025, up 60% since 2019, with micro-importers representing 38% of the total. Digital brokers have responded with self-service portals and flat-fee models that appeal to entrepreneurs seeking transparent pricing. Platforms such as Amazon Global Logistics streamline cross-border fulfillment, yet many small shippers misclassify goods or overlook labeling rules, amplifying compliance risk. Brokers balancing automation with proactive education win loyalty in this dispersed client base.
Shortage of Licensed Customs Brokers Driving Wage Inflation
The October 2025 Customs Broker License Exam posted a sub-15% pass rate, while the average broker age exceeds 43 years. Mid-level licensed professionals now command salaries 20-30% higher than 2022 levels. Smaller firms without automation budgets face service constraints as veteran staff retire.
Other drivers and restraints analyzed in the detailed report include:
- Monetization of ACE Data into Value-Added Analytics Services
- CBP "21st Century Customs Framework" Unlocking New Broker Roles
- Expansion of DIY Self-Filing Software Eroding Fee Margins
For complete list of drivers and restraints, kindly check the Table Of Contents.
Segment Analysis
Ocean freight held 58.63% of the United States customs brokerage market share in 2025 as importers favored cost-efficient containerized shipping. The United States customs brokerage market size tied to air cargo is projected to grow at a 4.09% CAGR through 2031 as e-commerce and time-sensitive industries prioritize speed. Express integrators leverage integrated clearance to shorten cycle times, while land-border truck and rail entries gain ground in the Southwest corridor.
Container reliability improvements following pandemic disruption have reinforced the ocean's cost advantage, yet recurring labor actions and slot allocation constraints spur some shippers to shift high-value goods to air despite the premium freight cost. Brokers with multi-modal expertise are best positioned to capture clients that balance speed and cost across seasonal demand cycles.
Forwarder-linked and 3PL-integrated operators controlled a 65.46% share in 2025, reflecting shippers' preference for single-invoice logistics solutions that bundle clearance, carriage, and warehousing. Pure customs brokers grew at a 3.51% CAGR as complex verticals such as FDA-regulated goods and foreign-trade-zone operations demanded specialized knowledge.
The acquisition of Livingston International by Purolator for USD 684.4 million in February 2025 underlines consolidation momentum as integrated operators seek deep compliance capabilities. Niche brokers respond by doubling down on vertical intelligence and personalized service that larger networks struggle to replicate.
Complete Report Scope:
- By Service Type
- Customs Clearance
- Trade Compliance Advisory
- Duty Drawback & Refund Services
- Freight Forwarding-Linked Brokerage
- By Mode of Transport
- Ocean
- Air
- Truck
- Rail
- By End-user Industry
- Consumer Goods & Retail
- Automotive
- Electronics & Hi-Tech
- Agriculture & Food
- Pharmaceuticals & Healthcare
- By Client Size
- Enterprise Importers (more than $50 M annual imports)
- Mid-market Importers ($5-50 M)
- Small & Micro Importers (less than $5 M)
- By Geography
- Northeast
- Midwest
- Southeast
- Southwest
- West
List of Companies Covered in this Report:
- Expeditors International of Washington, Inc.
- C.H. Robinson Worldwide, Inc.
- UPS Supply Chain Solutions
- FedEx Logistics
- Livingston International (acquired by Purolator)
- DHL Global Forwarding
- Kuehne + Nagel Inc.
- DSV (incl. DB Schenker)
- A.N. Deringer, Inc.
- Flexport, Inc.
- CEVA Logistics (Acquired by CMA CGM)
- OEC Group
- BDP International
- SEKO Logistics
- Kerry Logistics (USA)
- Nippon Express
- GEODIS USA
- C.H. Powell Co.
- Alba Wheels Up International
- GHY USA Inc.
Additional Benefits:
- The market estimate (ME) sheet in Excel format
- 3 months of analyst support
TABLE OF CONTENTS
1 Introduction
- 1.1 Study Assumptions & Market Definition Scope of the Study
2 Research Methodology
3 Executive Summary
4 Market Landscape
- 4.1 Market Overview
- 4.2 Market Drivers
- 4.2.1 Growth in U.S. import volumes rebounding post-pandemic
- 4.2.2 Complexity stemming from shifting tariff & trade-agreement rules
- 4.2.3 Digitization & automation of customs processes (ACE, PGA portals)
- 4.2.4 Rise of e-commerce micro-importers requiring high-frequency clearances
- 4.2.5 Monetization of ACE data into value-added analytics services
- 4.2.6 CBP "21st Century Customs Framework" unlocking new broker value-added roles
- 4.3 Market Restraints
- 4.3.1 Heightened trade-policy volatility creating forecasting risk
- 4.3.2 Rising compliance costs for forced-labor & ESG documentation
- 4.3.3 Shortage of licensed customs brokers driving wage inflation
- 4.3.4 Expansion of DIY self-filing software eroding broker fee margins
- 4.4 Value / Supply-Chain Analysis
- 4.5 Regulatory Landscape
- 4.6 Technological Outlook
- 4.7 Porter's Five Forces
- 4.7.1 Threat of New Entrants
- 4.7.2 Bargaining Power of Buyers
- 4.7.3 Bargaining Power of Suppliers
- 4.7.4 Threat of Substitutes
- 4.7.5 Competitive Rivalry
5 Market Size & Growth Forecasts (Value, USD)
- 5.1 By Service Type
- 5.1.1 Customs Clearance
- 5.1.2 Trade Compliance Advisory
- 5.1.3 Duty Drawback & Refund Services
- 5.1.4 Freight Forwarding-Linked Brokerage
- 5.2 By Mode of Transport
- 5.2.1 Ocean
- 5.2.2 Air
- 5.2.3 Truck
- 5.2.4 Rail
- 5.3 By End-user Industry
- 5.3.1 Consumer Goods & Retail
- 5.3.2 Automotive
- 5.3.3 Electronics & Hi-Tech
- 5.3.4 Agriculture & Food
- 5.3.5 Pharmaceuticals & Healthcare
- 5.4 By Client Size
- 5.4.1 Enterprise Importers (more than $50 M annual imports)
- 5.4.2 Mid-market Importers ($5-50 M)
- 5.4.3 Small & Micro Importers (less than $5 M)
- 5.5 By Geography
- 5.5.1 Northeast
- 5.5.2 Midwest
- 5.5.3 Southeast
- 5.5.4 Southwest
- 5.5.5 West
6 Competitive Landscape
- 6.1 Market Concentration
- 6.2 Strategic Moves
- 6.3 Market Share Analysis
- 6.4 Company Profiles (includes Global level Overview, Market level overview, Core Segments, Financials as available, Strategic Information, Market Rank/Share for key companies, Products & Services, and Recent Developments)
- 6.4.1 Expeditors International of Washington, Inc.
- 6.4.2 C.H. Robinson Worldwide, Inc.
- 6.4.3 UPS Supply Chain Solutions
- 6.4.4 FedEx Logistics
- 6.4.5 Livingston International (acquired by Purolator)
- 6.4.6 DHL Global Forwarding
- 6.4.7 Kuehne + Nagel Inc.
- 6.4.8 DSV (incl. DB Schenker)
- 6.4.9 A.N. Deringer, Inc.
- 6.4.10 Flexport, Inc.
- 6.4.11 CEVA Logistics (Acquired by CMA CGM)
- 6.4.12 OEC Group
- 6.4.13 BDP International
- 6.4.14 SEKO Logistics
- 6.4.15 Kerry Logistics (USA)
- 6.4.16 Nippon Express
- 6.4.17 GEODIS USA
- 6.4.18 C.H. Powell Co.
- 6.4.19 Alba Wheels Up International
- 6.4.20 GHY USA Inc.
7 Market Opportunities & Future Outlook

 2026年全球海關清關服務市場報告
 歐洲報關代理:市場佔有率分析、產業趨勢與統計及成長預測(2026-2031 年)南美洲報關代理:市場佔有率分析、產業趨勢與統計及成長預測(2026-2031 年)
 海關清關服務市場:依服務類型、運輸方式、客戶類型、貨物類型及最終用戶產業分類-2026-2032年全球市場預測
 報關的全球市場:服務類型·各終端用戶產業 (~2035年)拉丁美洲報關:市場佔有率分析、產業趨勢與成長預測(2025-2030 年)亞太地區報關業務 -市場佔有率分析、產業趨勢、統計數據和成長預測(2025-2030 年)
 報關中介市場評估:服務·運輸手段·客戶類型·終端用戶·各地區的機會及預測 (2018-2032年)