


 |
市場調查報告書
商品編碼
2114148
付款閘道:市場佔有率分析、產業趨勢與統計、成長預測(2026-2031)Payment Gateway - Market Share Analysis, Industry Trends & Statistics, Growth Forecasts (2026 - 2031) |
||||||

※ 本網頁內容可能與最新版本有所差異。詳細情況請與我們聯繫。
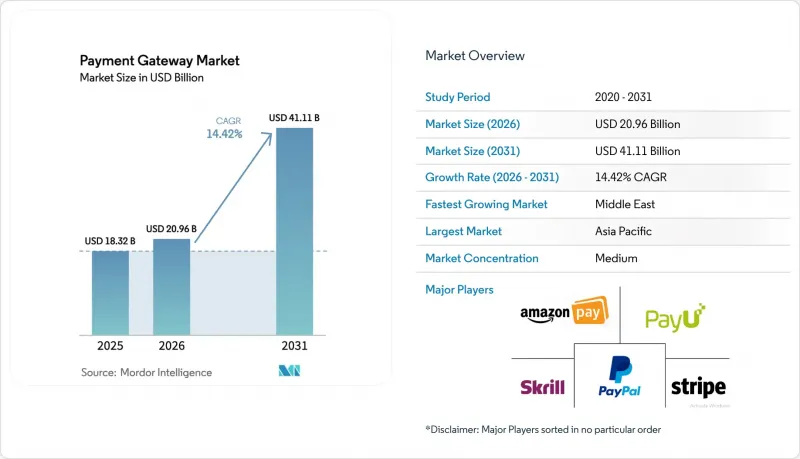
據 Mordor Intelligence 稱,2025 年付款閘道市場價值 183.2 億美元,預計到 2031 年將達到 411.1 億美元,而 2026 年為 209.6 億美元,預測期(2026-2031 年)的複合年成長率為 14.4%。
本報告按類型(託管和自託管)、公司規模(中小企業和大型企業)、通路(線上/網頁、行動應用程式、店內POS(全通路))、終端用戶產業(零售和電子商務、旅遊和酒店、銀行、金融服務和保險等)以及地區進行細分。市場預測以美元計價。
全球付款閘道市場趨勢與洞察
即時支付基礎設施的爆炸性成長正在加速亞太地區付款閘道的部署。
印度的統一支付介面(UPI)在2024年處理了1,310億筆交易,較去年同期成長58%。同時,泰國的PromptPay預計到2025年中期註冊用戶將超過5,600萬人。這些即時支付網路透過將每筆交易成本降低40至60個基點並實現即時支付,提高了商家的流動性。新加坡的PayNow Corporate正在將其服務範圍擴展到B2B發票,鼓勵供應商避免使用貿易信用額度。整合這些支付網路的支付閘道器正在建立相對於以銀行卡為中心的競爭對手的價格優勢,而這一趨勢目前正在蔓延到沙烏地阿拉伯的Mada和奈及利亞的即時支付系統。
跨境電子商務的成長正在推動歐洲中小企業對多幣種路由的需求。
2024年,歐洲中小企業跨境線上銷售額達890億歐元(950億美元),較2023年成長19%,但42%的商家表示外匯兌換摩擦是限制成長的一大障礙。提供動態貨幣轉換和智慧收單路由的付款閘道將外匯手續費控制在1.5%以下,大幅提升了商家的利潤率。 2024年,1.8萬家歐洲中小企業採用了Stripe的多幣種支付服務,而Adyen的機器學習引擎則將跨境交易的核准通過率提高了2.4個百分點。歐盟的《數位服務法》強制要求費用透明揭露,從而推動了對具成本效益支付基礎設施的需求。
不斷上漲的支付方案費用正在給微交易閘道器的利潤率帶來壓力。
2024年4月,Visa和萬事達卡將交換費平均上調了8個基點,導致5美元交易的總處理成本上升至4.2%。數位商品交易企業面臨的壓力最大,支付閘道器營運商為了防止客戶流失,承擔了高達一半的費用上漲。 PayPal報告稱,其交易利潤率下降了140個基點,其中60個基點是由於支付方案費用的增加。雖然即時帳戶間轉帳可以節省成本,但在歐洲和北美,這項服務仍然較為分散。
細分市場分析
預計2026年至2031年間,本地部署的支付閘道器將以16.46%的複合年成長率成長,顯著高於付款閘道市場的整體成長率。大規模商家願意每年支付5萬至15萬美元的PCI DSS一級認證費用,因為直接存取權杖化邏輯可以減少14%的超售風險,並實現與企業資源規劃(ERP)系統的深度整合。託管解決方案在2025年佔據了付款閘道市場56.66%的佔有率,其快速部署和合規整合優勢依然顯著,但其「黑盒」特性限制了對詐欺防制過濾器的個人化調整。
混合模式正在彌合這一差距。 Stripe Elements 透過提供託管結帳前端並向商家後端發送令牌,在易於整合和資料所有權之間取得了平衡。金融服務公司更傾向於這種架構,因為巴塞爾協議 III 的資本監管不利於依賴外部支付處理商。 Worldpay 的白牌閘道器軟體開發工具包 (SDK) 允許銀行將支付功能整合到其消費者應用程式中,在歐洲試點專案中,應用程式內支付交易量增加了 22%。
預計到2025年,中小企業(SME)將佔付款閘道市場交易量的65.62%,這主要得益於無需預付軟體成本的無程式碼工具以及「按需收費」的靈活合約模式。同時,大型企業預計到2031年將以15.82%的複合年成長率成長,透過將編配和財務管理服務整合到現有工作流程中,進一步擴大付款閘道市場的規模。 Stripe的企業級套餐平均年合約價值為42萬美元,而中小企業套餐的平均年合約價值僅為8,000美元,凸顯了中小企業的巨大獲利潛力。
編配工具正日益受到關注。 Checkout.com 的「Flow」功能透過在支付閘道器和收購方之間分配流量,降低了 18% 的處理成本並提高了核准通過率。技術資源有限的中小型企業往往更傾向於使用一體化控制面板。 Square 在將「先買後付」(BNPL)和會員模組整合到一個入口網站後,預計到 2024 年將在北美新增 34 萬家商家。 SOC 2 Type II 等安全認證仍然是高階市場的重要差異化因素,在淘汰小規模供應商方面發揮重要作用。
區域分析
預計到 2025 年,亞太地區將佔全球收入的 39.74%,這主要得益於支付寶、微信支付和印度的 UPI 的推動,這三者在 2024 年分別處理了超過 1,200 億筆和 1,310 億筆交易。QR碼的廣泛應用,加上政府支持的即時支付系統,正在鞏固該地區的主導地位。
預計到2031年,中東地區的複合年成長率將達到16.79%,成為付款閘道市場各地區中成長最快的地區。沙烏地阿拉伯的「2030願景」旨在2025年實現70%的交易無現金化,而阿拉伯聯合大公國(阿拉伯聯合大公國)正與14家銀行合作試辦央行數位貨幣(CBDC),以簡化跨境支付。各國監管政策鼓勵收單機構投資收購方基礎設施,加速付款閘道在零售和旅館業的普及應用。
預計到2025年,北美將佔全球銷售額的28%,但隨著銀行卡普及率接近飽和,成長速度正在放緩。歐洲受惠於PSD2推動的系統升級,到2025年中期,78%的商家已遷移至3-D Secure 2.2。南美洲的數位化進程仍在快速推進,巴西的「Pix」在2024年處理了420億筆即時支付交易。非洲市場仍然較為分散,但奈及利亞的「Paystack」與加納的「GhIPSS」之間的合作,是跨境即時支付管道發展的早期跡象。
其他好處:
- Excel格式的市場預測(ME)表
- 3個月的分析師支持
目錄
第1章:引言
- 研究假設和市場定義
- 調查範圍
第2章:調查方法
第3章執行摘要
第4章 市場狀況
- 市場概覽
- 市場促進因素
- 即時支付網路的爆炸性成長正在加速亞太地區付款閘道的部署。
- 跨境電子商務的成長正在推動歐洲中小企業對多幣種支付的需求。
- 監管要求(例如 PSD2-SCA)要求升級到令牌化、3-DS 相容的閘道器。
- 先買後付結算方式的激增導致每筆交易的 API 呼叫次數增加。
- 超市連鎖店非接觸式錢包的蓬勃發展正在推動全通路支付閘道器的普及。
- 人工智慧驅動的動態風險評分技術能夠實現高價值交易中的順暢身份驗證。
- 市場限制因素
- 不斷上漲的交易費用正在擠壓小額交易的支付閘道器利潤空間。
- 層出不窮的扣回爭議帳款詐騙正在損害商家的信任。
- 印度、巴西和俄羅斯的資料本地化法律使代幣庫的架構變得複雜。
- 由於 IPv6 部署有限,低延遲結算 API 中出現了封包分片問題。
- 產業價值鏈分析
- 監理展望
- 宏觀經濟因素對市場的影響
- 波特五力分析
第5章 市場規模與成長預測
- 按主機類型
- 託管
- 自託管
- 按公司規模
- 小型企業
- 大公司
- 通道特異性
- 線上 - 網路
- 在行動應用程式中
- 店內POS - 全通路
- 按最終用途行業分類
- 零售與電子商務
- 旅遊與飯店
- 銀行業、金融服務業及保險業
- 媒體與娛樂
- 其他終端用戶產業
- 按地區
- 北美洲
- 美國
- 加拿大
- 墨西哥
- 歐洲
- 德國
- 英國
- 法國
- 北歐的
- 其他歐洲國家
- 亞太地區
- 中國
- 印度
- 日本
- 韓國
- 東南亞
- 其他亞太國家
- 南美洲
- 巴西
- 阿根廷
- 其他南美國家
- 中東
- 沙烏地阿拉伯
- 阿拉伯聯合大公國
- 土耳其
- 其他中東國家
- 非洲
- 南非
- 奈及利亞
- 其他非洲國家
- 北美洲
第6章 競爭情勢
- 市場集中度
- 策略趨勢
- 市佔率分析
- 公司簡介
- PayPal Holdings Inc.
- Stripe Inc.
- PayU Payments Private Limited(Naspers Limited)
- Amazon Payments Inc.
- Block Inc.
- Adyen NV
- Alipay.com Co. Ltd.
- WePay Inc.(JPMorgan Chase Bank NA)
- CyberSource Corporation(Visa Inc.)
- Checkout.com Group SA
- Razorpay Software Private Limited
- Paytm Payments Services Limited
- Mollie BV
- Ingenico Group SA(Worldline SA)
- Payoneer Inc.
- Worldpay LLC(Fidelity National Information Services Inc.)
- Klarna Bank AB
- BlueSnap Inc.
- Rapyd Financial Network Ltd.
- Nuvei Corporation
- dLocal Ltd.
第7章 市場機會與未來展望
According to Mordor Intelligence, the payment gateway market size was valued at USD 18.32 billion in 2025 and is estimated to grow from USD 20.96 billion in 2026 to reach USD 41.11 billion by 2031, at a CAGR of 14.42% during the forecast period (2026-2031).
This report is Segmented by Type (Hosted, and Self-Hosted), Enterprise Size (Small and Medium Enterprises (SME), and Large Enterprises), Channel (Online / Web, Mobile In-App, and In-Store POS (Omnichannel)), End-User Industry (Retail and E-Commerce, Travel and Hospitality, Banking, Financial Services and Insurance (BFSI), and More), and Geography. The Market Forecasts are Provided in Terms of Value (USD).
Global Payment Gateway Market Trends and Insights
Explosion of Real-Time Payment Rails Accelerating Gateway Adoption in Asia Pacific
India's Unified Payments Interface processed 131 billion transactions in 2024, up 58% year on year, while Thailand's PromptPay surpassed 56 million registered users by mid-2025. These instant-settlement networks cut per-transaction costs by 40-60 basis points and deliver real-time settlement, boosting merchant liquidity. Singapore's PayNow Corporate broadened the scope to business-to-business invoices, encouraging suppliers to forego trade-credit lines. Gateways that integrate these rails achieve a pricing edge over card-centric rivals, a trend now spreading to Saudi Arabia's Mada and Nigeria's Instant Payment system.
Cross-Border E-Commerce Growth Driving Demand for Multi-Currency Routing Among European SMEs
European SMEs booked EUR 89 billion (USD 95 billion) in cross-border online sales in 2024, a 19% jump from 2023, yet 42% of merchants cited currency-conversion friction as a growth barrier. Gateways offering dynamic currency conversion and intelligent acquirer routing shrink foreign-exchange markups to below 1.5%, saving merchants substantial margin. Stripe's multi-currency settlement attracted 18,000 European SMEs in 2024, while Adyen's machine-learning engine lifted authorization by 2.4 percentage points on cross-border flows. The European Union's Digital Services Act now enforces transparent fee disclosure, intensifying demand for cost-efficient payment rails.
Rising Scheme Fees Squeezing Gateway Margins for Micro-Transactions
Visa and Mastercard lifted interchange fees by an average of eight basis points in April 2024, raising the all-in processing cost of a USD 5 purchase above 4.2%. Digital goods merchants face the steepest squeeze, and gateway providers have absorbed up to half of the fee increase to curb churn. PayPal reported a 140-basis-point contraction in its transaction margin, with scheme-fee inflation accounting for 60 basis points. Real-time account-to-account transfers offer cost relief but remain fragmented in Europe and North America.
Other drivers and restraints analyzed in the detailed report include:
- Regulatory Mandates such as PSD2-SCA Forcing Upgrades to Tokenized 3-DS-Ready Gateways
- Surge in BNPL Checkout Options Expanding API Calls Per Transaction
- Persistent Cross-Border Chargeback Fraud Undermining Merchant Trust
For complete list of drivers and restraints, kindly check the Table Of Contents.
Segment Analysis
Self-hosted gateways are projected to expand at a 16.46% CAGR from 2026 to 2031, comfortably outpacing the overall payment gateway market growth. Larger merchants tolerate the annual USD 50,000-150,000 PCI DSS Level 1 certification cost because direct access to tokenization logic trims overselling by 14% and supports deeper enterprise resource planning integrations. Hosted solutions, which held 56.66% payment gateway market share in 2025, remain compelling for fast deployment and bundled compliance but their black-box nature restricts bespoke fraud-filter tuning.
Hybrid models are narrowing the divide. Stripe Elements presents a hosted checkout front end but transmits tokens to the merchant's back end, balancing ease of integration with data ownership. Financial-services firms favor this architecture because Basel III capital rules penalize reliance on external processors. Worldpay's white-label gateway software development kit lets banks embed acceptance inside their consumer apps, driving a 22% lift in in-app volumes during European pilots.
SMEs accounted for 65.62% of 2025 activity in the payment gateway market, buoyed by no-code tools and pay-as-you-grow contracts that remove upfront software fees. Large enterprises, however, are set to grow at a 15.82% CAGR through 2031, expanding the payment gateway market size by layering orchestration and treasury services onto existing flows. Stripe's enterprise bundle averages USD 420,000 in annual contract value versus USD 8,000 for SMEs, underscoring the revenue potential.
Orchestration tools are top of mind. Checkout.com's Flow routes traffic across gateways and acquirers to cut processing costs 18% and improve approval ratios. SMEs, constrained by technical bandwidth, lean toward all-in-one dashboards; Square attracted 340,000 new North American merchants in 2024 after merging BNPL and loyalty modules into a single portal. Security certifications such as SOC 2 Type II remain a differentiator in the high-end segment, screening out smaller providers.
Complete Report Scope:
- By Host Type
- Hosted
- Self-Hosted
- By Enterprise Size
- Small and Medium Enterprises
- Large Enterprises
- By Channel
- Online - Web
- Mobile In-App
- In-Store POS - Omnichannel
- By End-User Industry
- Retail and E-Commerce
- Travel and Hospitality
- Banking Financial Services and Insurance
- Media and Entertainment
- Other End-User Industries
- By Geography
- North America
- United States
- Canada
- Mexico
- Europe
- Germany
- United Kingdom
- France
- Nordics
- Rest of Europe
- Asia Pacific
- China
- India
- Japan
- South Korea
- South-East Asia
- Rest of Asia Pacific
- South America
- Brazil
- Argentina
- Rest of South America
- Middle East
- Saudi Arabia
- United Arab Emirates
- Turkey
- Rest of Middle East
- Africa
- South Africa
- Nigeria
- Rest of Africa
- North America
Geography Analysis
Asia Pacific commanded 39.74% of global revenue in 2025, anchored by Alipay, WeChat Pay, and India's UPI clearing more than 120 billion, and 131 billion transactions respectively in 2024. Widespread QR-code adoption coupled with government-backed instant rails cements the region's leadership position.
The Middle East is projected to register a 16.79% CAGR through 2031, the highest regional pace in the payment gateway market. Saudi Arabia's Vision 2030 calls for 70% cashless transactions by 2025, and the United Arab Emirates is piloting a CBDC with 14 banks to streamline cross-border settlements. Local mandates have spurred acquirer investment in contactless infrastructure, catalyzing gateway adoption across retail and hospitality.
North America contributed 28% of 2025 revenue but is slowing as card penetration nears saturation. Europe benefits from PSD2-driven upgrades; 78% of merchants migrated to 3-D Secure 2.2 by mid-2025. South America's digital sprint continues, with Brazil's Pix handling 42 billion instant payments in 2024. Africa remains fragmented, yet Nigeria's Paystack integration with Ghana's GhIPSS is an early sign of cross-border instant-payment corridors.
- PayPal Holdings Inc.
- Stripe Inc.
- PayU Payments Private Limited (Naspers Limited)
- Amazon Payments Inc.
- Block Inc.
- Adyen N.V.
- Alipay.com Co. Ltd.
- WePay Inc. (JPMorgan Chase Bank N.A.)
- CyberSource Corporation (Visa Inc.)
- Checkout.com Group S.A.
- Razorpay Software Private Limited
- Paytm Payments Services Limited
- Mollie B.V.
- Ingenico Group S.A. (Worldline S.A.)
- Payoneer Inc.
- Worldpay LLC (Fidelity National Information Services Inc.)
- Klarna Bank AB
- BlueSnap Inc.
- Rapyd Financial Network Ltd.
- Nuvei Corporation
- dLocal Ltd.
Additional Benefits:
- The market estimate (ME) sheet in Excel format
- 3 months of analyst support
TABLE OF CONTENTS
1 INTRODUCTION
- 1.1 Study Assumptions and Market Definition
- 1.2 Scope of the Study
2 RESEARCH METHODOLOGY
3 EXECUTIVE SUMMARY
4 MARKET LANDSCAPE
- 4.1 Market Overview
- 4.2 Market Drivers
- 4.2.1 Explosion of Real-Time Payment Rails Accelerating Gateway Adoption in Asia Pacific
- 4.2.2 Cross-Border E-Commerce Growth Driving Demand for Multi-Currency Routing Among European SMEs
- 4.2.3 Regulatory Mandates such as PSD2-SCA Forcing Upgrades to Tokenised 3-DS-Ready Gateways
- 4.2.4 Surge in BNPL Checkout Options Expanding API Calls Per Transaction
- 4.2.5 Contactless-Wallet Boom in Grocery Chains Spurring Omnichannel Gateway Deployment
- 4.2.6 AI-Powered Dynamic Risk Scoring Enabling Frictionless Authentication for High-Value Transactions
- 4.3 Market Restraints
- 4.3.1 Rising Scheme Fees Squeezing Gateway Margins for Micro-Transactions
- 4.3.2 Persistent Cross-Border Chargeback Fraud Undermining Merchant Trust
- 4.3.3 Data-Localisation Laws in India Brazil and Russia Complicating Token-Vault Architectures
- 4.3.4 Limited IPv6 Adoption Causing Packet Fragmentation Issues in Low-Latency Payment APIs
- 4.4 Industry Value Chain Analysis
- 4.5 Regulatory Outlook
- 4.6 Impact of Macroeconomic Factors on the Market
- 4.7 Porter's Five Forces Analysis
- 4.7.1 Threat of New Entrants
- 4.7.2 Bargaining Power of Buyers
- 4.7.3 Bargaining Power of Suppliers
- 4.7.4 Threat of Substitutes
- 4.7.5 Competitive Rivalry
5 MARKET SIZE AND GROWTH FORECASTS (VALUE)
- 5.1 By Host Type
- 5.1.1 Hosted
- 5.1.2 Self-Hosted
- 5.2 By Enterprise Size
- 5.2.1 Small and Medium Enterprises
- 5.2.2 Large Enterprises
- 5.3 By Channel
- 5.3.1 Online - Web
- 5.3.2 Mobile In-App
- 5.3.3 In-Store POS - Omnichannel
- 5.4 By End-User Industry
- 5.4.1 Retail and E-Commerce
- 5.4.2 Travel and Hospitality
- 5.4.3 Banking Financial Services and Insurance
- 5.4.4 Media and Entertainment
- 5.4.5 Other End-User Industries
- 5.5 By Geography
- 5.5.1 North America
- 5.5.1.1 United States
- 5.5.1.2 Canada
- 5.5.1.3 Mexico
- 5.5.2 Europe
- 5.5.2.1 Germany
- 5.5.2.2 United Kingdom
- 5.5.2.3 France
- 5.5.2.4 Nordics
- 5.5.2.5 Rest of Europe
- 5.5.3 Asia Pacific
- 5.5.3.1 China
- 5.5.3.2 India
- 5.5.3.3 Japan
- 5.5.3.4 South Korea
- 5.5.3.5 South-East Asia
- 5.5.3.6 Rest of Asia Pacific
- 5.5.4 South America
- 5.5.4.1 Brazil
- 5.5.4.2 Argentina
- 5.5.4.3 Rest of South America
- 5.5.5 Middle East
- 5.5.5.1 Saudi Arabia
- 5.5.5.2 United Arab Emirates
- 5.5.5.3 Turkey
- 5.5.5.4 Rest of Middle East
- 5.5.6 Africa
- 5.5.6.1 South Africa
- 5.5.6.2 Nigeria
- 5.5.6.3 Rest of Africa
- 5.5.1 North America
6 COMPETITIVE LANDSCAPE
- 6.1 Market Concentration
- 6.2 Strategic Moves
- 6.3 Market Share Analysis
- 6.4 Company Profiles (includes Global level Overview, Market level overview, Core Segments, Financials as available, Strategic Information, Market Rank/Share for key companies, Products and Services, and Recent Developments)
- 6.4.1 PayPal Holdings Inc.
- 6.4.2 Stripe Inc.
- 6.4.3 PayU Payments Private Limited (Naspers Limited)
- 6.4.4 Amazon Payments Inc.
- 6.4.5 Block Inc.
- 6.4.6 Adyen N.V.
- 6.4.7 Alipay.com Co. Ltd.
- 6.4.8 WePay Inc. (JPMorgan Chase Bank N.A.)
- 6.4.9 CyberSource Corporation (Visa Inc.)
- 6.4.10 Checkout.com Group S.A.
- 6.4.11 Razorpay Software Private Limited
- 6.4.12 Paytm Payments Services Limited
- 6.4.13 Mollie B.V.
- 6.4.14 Ingenico Group S.A. (Worldline S.A.)
- 6.4.15 Payoneer Inc.
- 6.4.16 Worldpay LLC (Fidelity National Information Services Inc.)
- 6.4.17 Klarna Bank AB
- 6.4.18 BlueSnap Inc.
- 6.4.19 Rapyd Financial Network Ltd.
- 6.4.20 Nuvei Corporation
- 6.4.21 dLocal Ltd.
7 MARKET OPPORTUNITIES AND FUTURE OUTLOOK
- 7.1 White-Space and Unmet-Need Assessment

 印度付款閘道:市場佔有率分析、產業趨勢與統計及成長預測(2026-2031)
 付款閘道市場:2026-2032年全球市場預測(付款閘道類型、支付方式、支付格式、部署類型、產業和組織規模分類)西班牙付款閘道:市佔率分析、產業趨勢與統計及成長預測(2026-2031 年)
 2026年全球收據式優惠市場報告中國付款閘道:市場佔有率分析、產業趨勢與統計及成長預測(2026-2031)
 付款閘道市場 - 全球產業規模、佔有率、趨勢、機會、預測:按類型、最終用途、企業規模、地區和競爭格局分類,2021-2031 年
 付款閘道市場機會、成長要素、產業趨勢分析及2026-2035年預測
 付款閘道市場規模、佔有率和成長分析:按類型、企業規模、最終用戶和地區分類-2026-2033年產業預測
 付款閘道市場報告:按應用程式、互動方式和地區分類(2026-2034 年)
 付款閘道市場規模、佔有率和趨勢分析報告:按類型、企業規模、最終用途、地區和細分市場預測(2026-2033 年)