


 |
市場調查報告書
商品編碼
2114001
油田設備:市場佔有率分析、產業趨勢與統計、成長預測(2026-2031)Oilfield Equipment - Market Share Analysis, Industry Trends & Statistics, Growth Forecasts (2026 - 2031) |
||||||

※ 本網頁內容可能與最新版本有所差異。詳細情況請與我們聯繫。
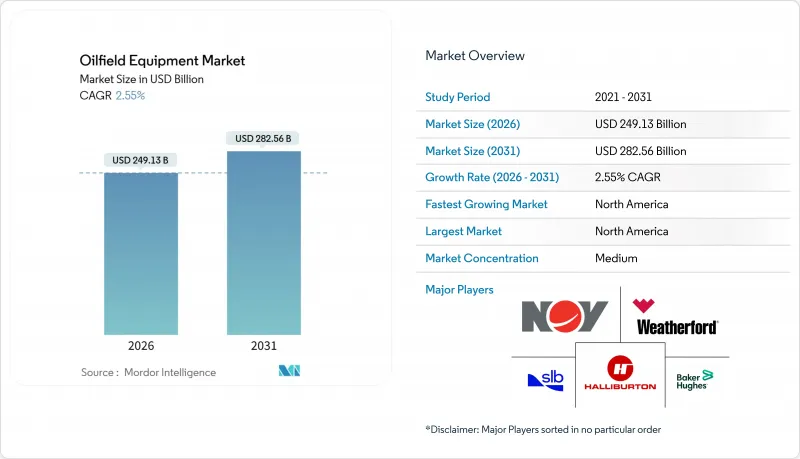
根據 Mordor Intelligence 估計,2026 年油田設備市值為 2,491.3 億美元,預計在預測期(2026-2031 年)內將以 2.55% 的複合年成長率成長,到 2031 年達到 2,825.6 億美元。
本報告按設備類型(鑽井設備、生產和乾預設備、成品設備及其他設備)、安裝地點(陸上和海上)、井型(傳統型和傳統型)以及地區(北美、歐洲、亞太、南美以及中東和非洲)進行細分。市場規模和預測均以美元計價。
全球油田設備市場趨勢與洞察
不斷增加的深海和超深海項目正在推動對海底設備的需求。
2024年至2025年間,共有18個深海計畫做出最終投資決定(FID),每個計畫投資額均超過10億美元,是前兩年的兩倍。光是巴西的鹽層下下層開發項目,例如Buzios 9和Mero 4,就需要64套海底鑽井設備和大規模軟性立管,而高規格生產設備的大規模訂單也持續成長。在圭亞那的Stubbroke區塊,新增了錘頭、Pluma和Picker-El三個項目,所有這些項目都需要第六代鑽井船和20,000 psi的防噴器,而只有少數供應商能夠提供這些設備。西非再次成為關注焦點,Total Energy投資60億美元的Camino計畫採用海底回接方式連接FPSO,將損益平衡點控制在每桶35美元。監管機構的影響力也不斷增強。在挪威,對於深度超過 1500 公尺的油井,現在強制要求使用雙剪切閘板防噴器,這正逐漸成為全球保險公司越來越重要的標準。
從 2024 年開始,資本支出 (CAPEX) 的復甦和鑽機數量的增加將釋放積壓的設備訂單。
預計2025年,全球上游資本支出將達5,250億美元,較2024年成長14%,結束先前連續五年的萎縮趨勢。北美陸上鑽井鑽機數量預計將成長9%,到2025年平均達到621座,而浮體式鑽機的利用率預計將上升至84%,推動超深水鑽井船的日收益超過45萬美元。國民油井巴科公司(NOV)的鑽井設備訂單累積訂單到2025年底將達21億美元,其中包括計畫於2027年前交付的防噴器(BOP)和頂驅系統。生產商正擴大選擇自動化管材處理系統和即時水下感測器,這些系統可將油井建造時間縮短多達20%。中東國家石油公司(NOC)已訂購 52 台新的陸上鑽機,並計劃在 2025 年投入使用,以滿足其天然氣開發目標,從而提振了對高規格鑽機平台的需求。
原油價格波動阻礙了油氣探勘開發預算和專案批准。
預計2025年布蘭特原油價格將在每桶68美元至88美元之間波動,季度波動幅度超過15%。這縮短了專案工期。第二季度,當油價跌破每桶70美元時,全球22%的最終投資決策(FID)被延後。由於利潤率下降,二疊紀盆地的營運商正迅速關閉鑽機,導致成品設備需求波動。深水開發案需要原油價格高於每桶60美元才能達到15%的投資報酬率,而價格波動可能導致專案核准決策延遲長達18個月,進而導致設備訂單延遲。根據Technip FMC的報告,其2025年海底設備訂單積壓中,有30%包含價格掛鉤條款,允許在布蘭特原油價格跌破閾值時延遲交付。到 2025 年,中小型獨立公司平均削減了 18% 的探勘預算,縮減了地震探勘和鑽井活動。
細分市場分析
到2025年,鑽井設備將佔油田設備市場的37.3%,預計到2031年將以2.6%的年均成長率成長,這主要得益於自動化鑽機台系統減少了非生產時間。墨西哥灣和北海的高壓高溫油井需要20,000 psi的防噴器,其成本比15,000 psi的防噴器高出800萬至1200萬美元,這為認證供應商帶來了高利潤率。生產和介入工具受益於老舊油井對人工採油、撓曲油管和修井鑽機的需求,而完井設備的需求則因可溶性材料的普及而增加,這些材料無需清理作業,每口井可節省20萬至40萬美元的成本。儘管來自亞洲製造商的競爭壓力日益增加,但高品質的接頭和耐腐蝕合金使歐美鋼鐵廠能夠在酸性氣體環境中獲得 15-20% 的價格溢價。
電動潛水泵、智慧旋轉導向系統和即時鑽井分析表明,數位化正從試點階段走向標準實踐。營運商報告稱,機器學習平台正在最佳化鑽頭重量和轉速,從而將鑽井天數減少12%至18%,這種成本節約效果在多井平台開發中得到了協同放大。在油田設備市場,將數位介面和遠端監控功能整合到硬體中的製造商仍然備受青睞,預計鑽井設備將在主要類別中實現最高的成長率。
區域分析
預計到2025年,北美將佔全球銷售額的36.3%,並呈現最高的成長率,到2031年複合年成長率將達到3.4%。這主要得益於二疊紀盆地的重組、墨西哥灣油田租賃競標創下的3.82億美元的最高競標,以及加拿大油砂鑽探活動的增加。在美國,預計2025年將有621座陸上鑽井鑽機運作,而海上日均產量為190萬桶。這主要歸功於基礎設施升級,使損益平衡點提高到每桶40-50美元。在加拿大,管道擴建將進一步增加Montney和杜韋爾奈地區的鑽探活動,而墨西哥的紮馬油田預計將於2027年達到日產16.5萬桶的峰值產量,這將需要海底設施和FPSO(浮式生產儲油卸油設備)產能。
在沙烏地阿美和阿布達比國家石油公司(ADNOC)每年總合800億美元的上游投資支持下,中東和非洲也紛紛效法。這項投資包括新建40座海上鑽油平臺和擴建大規模天然氣處理設施。奈及利亞和安哥拉的財政狀況正艱難應對,這影響了深海油氣開發的獲利能力,但隨著尼日爾Delta地區安全形勢的改善,陸上項目仍在繼續推進。隨著國營石油公司(NOC)追求更高的效率,技術需求正轉向模組化鑽機和積極的數位轉型。
亞太地區是成長最快的消費市場,這主要得益於中國四個新的海上開發項目以及印度採購12座鑽井鑽機以加速克里希納-戈達瓦里探勘。儘管馬來西亞的卡薩瓦利天然氣項目和澳洲的斯卡伯勒開發案帶動了區域海底設備訂單的強勁成長,但日本和韓國正在投資建造浮體式液化天然氣再氣化,這些裝置需要高壓泵和錨碇系統。在南美洲,巴西的鹽鹽層下開發案預計將在2025年至2027年間安裝64套海底採油樹,而阿根廷的瓦卡穆埃爾塔油田則推動了非傳統資源的採購。歐洲的情況則是喜憂參半。英國在北海的支出在2025年下降了11%,但挪威批准了15個採用電氣化平台的新開發項目,以降低碳排放強度。
其他好處:
- Excel格式的市場預測(ME)表
- 3個月的分析師支持
目錄
第1章:引言
- 研究假設和市場定義
- 調查範圍
第2章:調查方法
第3章執行摘要
第4章 市場狀況
- 市場概覽
- 市場促進因素
- 深海和超深海工程儲備增加
- 頁岩油和緻密油鑽探活動的擴張
- 從2024年起,資本投資和鑽井鑽機數量將逐步恢復
- 亞太地區能源需求的激增正在推動新油田的開發。
- 關稅促使油田管閥門製造回歸日本,本地化生產也將隨之興起。
- 甲烷洩漏法規正在加速對低排放量BOP(金字塔底層)產品的需求。
- 市場限制因素
- 原油價格波動給探勘與生產預算帶來了壓力。
- 遵守環境法規的成本不斷上升
- 海上設施需要大量資本投資和較長的投資回收期。
- 半導體和合金供應鏈的瓶頸導致交貨延遲。
- 供應鏈分析
- 監理情勢
- 技術展望
- 波特五力模型
- 石油和天然氣生產及消費預測
- 陸上及海上運作鑽機數量及預測
- 陸上和海上資本支出(CAPEX)預測
第5章 市場規模與成長預測
- 依設備類型
- 挖掘設備
- 生產和乾預設備
- 已完成的設備
- 其他設備類型
- 按位置
- 陸上
- 離岸
- 按井類型
- 傳統的
- 傳統型
- 按地區
- 北美洲
- 美國
- 加拿大
- 墨西哥
- 歐洲
- 挪威
- 英國
- 俄羅斯
- 荷蘭
- 德國
- 其他歐洲國家
- 亞太地區
- 中國
- 印度
- 日本
- 韓國
- 東南亞國協
- 澳洲
- 其他亞太國家
- 南美洲
- 巴西
- 阿根廷
- 哥倫比亞
- 其他南美國家
- 中東和非洲
- 沙烏地阿拉伯
- 阿拉伯聯合大公國
- 伊朗
- 奈及利亞
- 南非
- 其他中東和非洲國家
- 北美洲
第6章 競爭情勢
- 市場集中度
- 策略趨勢(併購、聯盟、購電協議)
- 市場佔有率分析(主要公司的市場排名和佔有率)
- 公司簡介
- Schlumberger Ltd.
- Halliburton Co.
- Baker Hughes Co.
- Weatherford International plc
- National Oilwell Varco Inc.
- TechnipFMC plc
- Aker Solutions ASA
- Tenaris SA
- Vallourec SA
- Oceaneering International Inc.
- Subsea 7 SA
- Saipem SpA
- Transocean Ltd.
- KCA Deutag
- Expro Group Holdings NV
- Liberty Energy Inc.
- Superior Energy Services Inc.
- NOV Inc.-Rig Technologies
- ChampionX Corp.
- Forum Energy Technologies Inc.
第7章 市場機會與未來展望
According to Mordor Intelligence, the oilfield equipment market size is estimated at USD 249.13 billion in 2026, and is expected to reach USD 282.56 billion by 2031, at a CAGR of 2.55% during the forecast period (2026-2031).
This report is Segmented by Equipment Type (Drilling Equipment, Production and Intervention Equipment, Completion Equipment, and Other Equipment Types), Location (Onshore and Offshore), Well Type (Conventional and Unconventional), and Geography (North America, Europe, Asia-Pacific, South America, and Middle East and Africa). The Market Sizes and Forecasts are Provided in Terms of Value (USD).
Global Oilfield Equipment Market Trends and Insights
Rising Deep- & Ultra-Deepwater Project Pipeline Propels Subsea Equipment Demand
Final investment decisions for 18 deepwater projects over USD 1 billion each were reached in 2024-2025, double the tally from the prior two-year period. Brazil's pre-salt developments, such as Buzios 9 and Mero 4, alone require 64 subsea trees and extensive flexible risers, sustaining large orders for high-specification production hardware. Guyana's Stabroek Block added Hammerhead, Pluma, and Pickerel, all demanding sixth-generation drillships and 20,000 psi BOPs that only a handful of suppliers can provide. West Africa re-entered the queue with TotalEnergies' USD 6 billion Kaminho project that relies on subsea tiebacks to FPSOs, which curbs breakeven to USD 35 per barrel. Regulatory influence is rising; Norway now mandates dual-shear-ram BOPs for wells deeper than 1,500 m, a benchmark insurers increasingly require worldwide.
CAPEX Recovery and Rig-Count Rebound Post-2024 Unlock Pent-Up Equipment Orders
Global upstream CAPEX climbed to USD 525 billion in 2025, a 14% jump from 2024, ending a five-year contraction. North American land-rig counts averaged 621 in 2025, up 9%, while floater utilization rose to 84%, driving day rates for ultra-deepwater drillships above USD 450,000. National Oilwell Varco's drilling-equipment backlog hit USD 2.1 billion at year-end 2025, covering BOPs and top-drive systems scheduled through 2027. Producers increasingly select automated pipe-handling and real-time downhole sensors that shorten well-construction timelines by up to 20%. Middle-East NOCs ordered 52 new land rigs in 2025 to meet gas development goals, reinforcing demand for high-specification rig packages.
Oil-Price Volatility Undermining E&P Budgets and Project Sanctioning
Brent crude ranged from USD 68 to USD 88 in 2025, with swings above 15% each quarter that compressed planning horizons and delayed 22% of global FIDs during the second quarter when prices dipped below USD 70. Permian operators idle rigs quickly when margins narrow, creating uneven demand for completion gear. Deepwater ventures require oil above USD 60 to yield 15% returns, and volatility can defer sanction decisions by up to 18 months, dragging equipment orders with them. TechnipFMC reported that 30% of its 2025 subsea backlog contained price-contingent clauses allowing delivery deferral when Brent falls below thresholds. Smaller independents cut exploration budgets by 18% on average in 2025, reducing seismic and drilling activity.
Other drivers and restraints analyzed in the detailed report include:
- Methane-Leak Rules Accelerating Demand for Low-Emission BOPs and Wellhead Systems
- Surging APAC Energy Demand Feeding New Field Developments and Equipment Orders
- High Offshore Equipment CAPEX and Long Payback Cycles Constraining Investment
For complete list of drivers and restraints, kindly check the Table Of Contents.
Segment Analysis
Drilling equipment accounted for 37.3% of the oilfield equipment market in 2025 and is projected to grow at 2.6% through 2031, propelled by automated rig-floor systems that cut non-productive time. High-pressure, high-temperature wells in the Gulf of Mexico and the North Sea require 20,000 psi BOPs that carry price tags of USD 8-12 million higher than 15,000 psi units, supporting premium margins for certified suppliers. Production and intervention tools benefit from aging wells that need artificial lift, coiled tubing, and workover rigs, while completion equipment gains from dissolvable materials that remove cleanout runs and shave USD 200,000-400,000 per well. Competitive pressure is rising from Asian fabricators, yet premium connections and corrosion-resistant alloys allow Western mills to secure 15-20% price premiums in sour-gas environments.
Electric submersible pumps, intelligent rotary steerable systems, and real-time drilling analytics illustrate how digitalization is moving from pilot phase to standard practice. Operators report 12-18% reductions in drilling days when machine-learning platforms optimize bit weight and rotary speed, savings that compound over multi-well pad developments. The oilfield equipment market continues to reward manufacturers that embed digital interfaces and remote-monitoring capabilities into hardware, positioning drilling equipment for the highest growth among the major categories.
Complete Report Scope:
- By Equipment Type
- Drilling Equipment
- Production and Intervention Equipment
- Completion Equipment
- Other Equipment Types
- By Location
- Onshore
- Offshore
- By Well Type
- Conventional
- Unconventional
- By Geography
- North America
- United States
- Canada
- Mexico
- Europe
- Norway
- United Kingdom
- Russia
- Netherlands
- Germany
- Rest of Europe
- Asia Pacific
- China
- India
- Japan
- South Korea
- ASEAN Countries
- Australia
- Rest of Asia Pacific
- South America
- Brazil
- Argentina
- Colombia
- Rest of South America
- Middle East and Africa
- Saudi Arabia
- United Arab Emirates
- Iran
- Nigeria
- South Africa
- Rest of Middle East and Africa
- North America
Geography Analysis
North America generated 36.3% of 2025 revenue and shows the strongest 3.4% CAGR through 2031, supported by Permian consolidation, Gulf of Mexico lease auctions that yielded USD 382 million in high bids, and an uptick in Canadian oil sands drilling. The U.S. operated 621 active land rigs in 2025, while offshore output averaged 1.9 million bpd amid infrastructure upgrades that move breakevens toward USD 40-50 per barrel. Canada's pipeline expansions unlocked incremental drilling in the Montney and Duvernay, and Mexico's Zama field approaches peak output of 165,000 bpd in 2027, necessitating subsea kits and FPSO capacity.
The Middle East and Africa follow, buoyed by USD 80 billion in combined annual upstream investment from Saudi Aramco and ADNOC, including 40 new offshore rigs and significant gas-processing expansions. Nigeria and Angola struggle with fiscal terms that depress deepwater economics, yet the Niger Delta onshore projects carry on under improved security. Technology demand shifts toward modular rigs and aggressive digitalization as NOCs chase efficiency gains.
Asia Pacific is the fastest-moving consumer market, driven by China's four new offshore schemes and India's 12-rig procurement to accelerate Krishna-Godavari exploration. Malaysia's Kasawari gas project and Australia's Scarborough development strengthen regional subsea equipment orders, while Japan and South Korea invest in floating LNG regasification units requiring high-pressure pumps and mooring systems. South America rests on Brazil's pre-salt plan for 64 subsea trees between 2025-2027, whereas Argentina's Vaca Muerta pushes unconventional purchases. Europe shows divergence: UK North Sea spending fell 11% in 2025, but Norway approved 15 new developments outfitted with electrified platforms that reduce carbon intensity.
- Schlumberger Ltd.
- Halliburton Co.
- Baker Hughes Co.
- Weatherford International plc
- National Oilwell Varco Inc.
- TechnipFMC plc
- Aker Solutions ASA
- Tenaris S.A.
- Vallourec S.A.
- Oceaneering International Inc.
- Subsea 7 S.A.
- Saipem S.p.A.
- Transocean Ltd.
- KCA Deutag
- Expro Group Holdings N.V.
- Liberty Energy Inc.
- Superior Energy Services Inc.
- NOV Inc. - Rig Technologies
- ChampionX Corp.
- Forum Energy Technologies Inc.
Additional Benefits:
- The market estimate (ME) sheet in Excel format
- 3 months of analyst support
TABLE OF CONTENTS
1 Introduction
- 1.1 Study Assumptions & Market Definition
- 1.2 Scope of the Study
2 Research Methodology
3 Executive Summary
4 Market Landscape
- 4.1 Market Overview
- 4.2 Market Drivers
- 4.2.1 Rising deep- & ultra-deepwater project pipeline
- 4.2.2 Expansion of shale & tight-oil drilling activity
- 4.2.3 CAPEX recovery and rig-count rebound post-2024
- 4.2.4 Surging APAC energy demand feeding new field developments
- 4.2.5 Tariff-led reshoring & localization of OCTG/valves manufacturing
- 4.2.6 Methane-leak rules accelerating demand for low-emission BOPs
- 4.3 Market Restraints
- 4.3.1 Oil-price volatility undermining E&P budgets
- 4.3.2 Rising environmental-compliance costs
- 4.3.3 High offshore equipment CAPEX & long payback cycles
- 4.3.4 Semiconductor/alloy supply-chain bottlenecks delaying deliveries
- 4.4 Supply-Chain Analysis
- 4.5 Regulatory Landscape
- 4.6 Technological Outlook
- 4.7 Porter's Five Forces
- 4.7.1 Bargaining Power of Suppliers
- 4.7.2 Bargaining Power of Buyers
- 4.7.3 Threat of New Entrants
- 4.7.4 Threat of Substitutes
- 4.7.5 Industry Rivalry
- 4.8 Crude-Oil and Natural Gas Production & Consumption Outlook
- 4.9 Onshore & Offshore Active-Rig Count and Forecast
- 4.10 Onshore vs Offshore CAPEX Forecast
5 Market Size & Growth Forecasts
- 5.1 By Equipment Type
- 5.1.1 Drilling Equipment
- 5.1.2 Production and Intervention Equipment
- 5.1.3 Completion Equipment
- 5.1.4 Other Equipment Types
- 5.2 By Location
- 5.2.1 Onshore
- 5.2.2 Offshore
- 5.3 By Well Type
- 5.3.1 Conventional
- 5.3.2 Unconventional
- 5.4 By Geography
- 5.4.1 North America
- 5.4.1.1 United States
- 5.4.1.2 Canada
- 5.4.1.3 Mexico
- 5.4.2 Europe
- 5.4.2.1 Norway
- 5.4.2.2 United Kingdom
- 5.4.2.3 Russia
- 5.4.2.4 Netherlands
- 5.4.2.5 Germany
- 5.4.2.6 Rest of Europe
- 5.4.3 Asia Pacific
- 5.4.3.1 China
- 5.4.3.2 India
- 5.4.3.3 Japan
- 5.4.3.4 South Korea
- 5.4.3.5 ASEAN Countries
- 5.4.3.6 Australia
- 5.4.3.7 Rest of Asia Pacific
- 5.4.4 South America
- 5.4.4.1 Brazil
- 5.4.4.2 Argentina
- 5.4.4.3 Colombia
- 5.4.4.4 Rest of South America
- 5.4.5 Middle East and Africa
- 5.4.5.1 Saudi Arabia
- 5.4.5.2 United Arab Emirates
- 5.4.5.3 Iran
- 5.4.5.4 Nigeria
- 5.4.5.5 South Africa
- 5.4.5.6 Rest of Middle East and Africa
- 5.4.1 North America
6 Competitive Landscape
- 6.1 Market Concentration
- 6.2 Strategic Moves (M&A, Partnerships, PPAs)
- 6.3 Market Share Analysis (Market Rank/Share for key companies)
- 6.4 Company Profiles (includes Global level Overview, Market level overview, Core Segments, Financials as available, Strategic Information, Products & Services, and Recent Developments)
- 6.4.1 Schlumberger Ltd.
- 6.4.2 Halliburton Co.
- 6.4.3 Baker Hughes Co.
- 6.4.4 Weatherford International plc
- 6.4.5 National Oilwell Varco Inc.
- 6.4.6 TechnipFMC plc
- 6.4.7 Aker Solutions ASA
- 6.4.8 Tenaris S.A.
- 6.4.9 Vallourec S.A.
- 6.4.10 Oceaneering International Inc.
- 6.4.11 Subsea 7 S.A.
- 6.4.12 Saipem S.p.A.
- 6.4.13 Transocean Ltd.
- 6.4.14 KCA Deutag
- 6.4.15 Expro Group Holdings N.V.
- 6.4.16 Liberty Energy Inc.
- 6.4.17 Superior Energy Services Inc.
- 6.4.18 NOV Inc. - Rig Technologies
- 6.4.19 ChampionX Corp.
- 6.4.20 Forum Energy Technologies Inc.
7 Market Opportunities & Future Outlook
- 7.1 White-space & Unmet-Need Assessment

 旋轉傾斜台市場:全球市場預測,2026-2032年
 海上油田服務:市場佔有率分析、產業趨勢與統計、成長預測(2026-2031)油田設備市場:2026-2032年全球市場預測(按設備類型、作業階段、鑽井技術、服務類型、應用和最終用戶分類)
 油田租賃服務市場:全球產業規模、市場佔有率、趨勢、機會和預測(按設備、應用和地區分類)、競爭格局(2021-2031 年)油田設備租賃服務:市場佔有率分析、產業趨勢及統計、成長預測(2026-2031)
 油田設備租賃市場規模、佔有率和成長分析:按設備、應用、最終用戶產業和地區分類-2026-2033年產業預測高膨脹可回收橋塞市場:依設定深度、回收機制、材料、額定壓力和應用分類-全球預測,2026-2032年按鑽機移動性、井架類型、負載能力、應用、鑽井深度和最終用戶分類的油井鑽井架市場-全球預測,2026-2032年
 油田設備租賃服務市場規模、佔有率及成長分析(依設備、服務類型、應用、最終用戶及地區分類)-2026-2033年產業預測橋塞市場 - 全球產業規模、佔有率、趨勢、機會、預測(按類型、現狀、材料、應用、地區和競爭格局分類),2021-2031年