


 |
市場調查報告書
商品編碼
2113808
人體感應器:市場佔有率分析、產業趨勢與統計、成長預測(2026-2031)Occupancy Sensor - Market Share Analysis, Industry Trends & Statistics, Growth Forecasts (2026 - 2031) |
||||||

※ 本網頁內容可能與最新版本有所差異。詳細情況請與我們聯繫。
據 Mordor Intelligence 稱,2025 年人體感應器市值為 31 億美元,預計到 2031 年將從 2026 年的 32.6 億美元成長至 41.6 億美元,預測期(2026-2031 年)的複合年成長率為 5.04%。
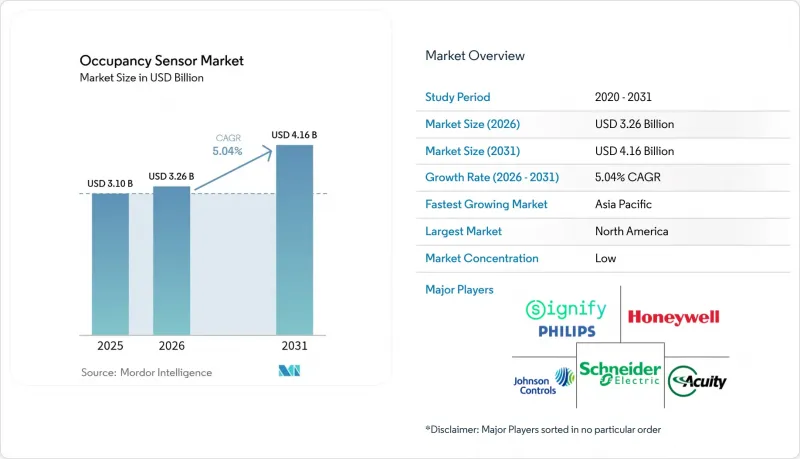
本報告依網路連接方式(有線、無線)、技術(被動紅外線 (PIR)、超音波、微波及其他)、安裝類型(吸頂式、壁掛式及其他)、安裝方式(維修、新建)、建築類型(住宅、商業、工業/倉庫及其他)、應用領域和地區進行細分。市場預測以美元計價。
全球人體感應器市場趨勢與洞察
美國和歐盟更嚴格的淨零排放建築規範:根據入住率強制停工。
加州第24號法規強制要求建築物配備佔用偵測系統,以便在建築物無人居住20分鐘內關閉電源插座和通風系統。 2021年國際節能標準(IECC)也強制要求在封閉空間內採用自動化控制。一項旨在2030年改造3500萬棟建築的歐洲維修計畫也遵循這些法規,其主要驅動力是法規遵從而非節能。因此,商業地產業主正在將感測器安裝納入設計方案,而不是在施工後再加裝。這一趨勢正在推動整個佔用感測器市場的潛在需求。
中國的「雙碳」藍圖正在推動智慧照明的發展。
中國力爭在2030年前實現碳排放達峰,並在2060年前實現碳中和,這一目標正推動智慧建築的維修,尤其強調基於感測器的自動化。公共機構的案例研究表明,採用運動檢測技術的物聯網照明系統全面升級改造,可實現超過20%的節能效果。由於區域差異,軟硬體一體化的承包工程比單獨銷售組件更具優勢,尤其是在預算充足、技術能力強的一線城市。
2.4GHz網狀網路中的射頻擁塞和電池消耗
在良好的無線電條件下,擁有 192 個節點的 Zigbee 網路可以保持低於 200 毫秒的延遲,但當與 Wi-Fi 頻道重疊時,丟包率會急劇上升。頻繁的重傳會縮短附扣電池的壽命,並增加電池供電設備的維護成本。因此,除非能夠使用頻段規劃工具,否則建築業主通常不願意將關鍵負載無線化。
細分市場分析
至2025年,有線產品將佔全球銷售額的61.55%,凸顯其在人體感應器市場核心建築系統中的重要角色。由於設施管理人員優先考慮抗無線干擾能力和供電便利性,以乙太網路為基礎的數位尋址網路正在成為新建商業建築照明和暖通空調控制的基礎。在管道空間有限的維修環境中,由於安裝時間較短,無線節點較受歡迎。這解釋了網狀網路產品預計到2031年將以12.18%的複合年成長率成長的原因。混合設計也正在興起,它透過使用有線主幹為支援PoE供電的照明設備供電,並在外圍部署Thread或Zigbee感測器,從而兼顧可靠性和柔軟性。
無線市場的成長主要由協議整合驅動。 「Matter-over-Thread」(物質優先於線程)打破了傳統的廠商鎖定,例如Aqara等廠商推出了可在蘋果、亞馬遜和谷歌生態系統中自動配置的佔用感測器。飛利浦Hue展示了一項軟體更新,使燈泡能夠作為運動感測器,這預示著一種架構的潛力:所有燈具都成為資料節點。這模糊了連接類別之間的界限,並擴展了可能的安裝範圍。
預計到2025年,被動紅外線(PIR)技術將佔49.72%的市場佔有率,進一步鞏固其在人體感應器市場的成本優勢。受對更高精度需求的驅動,結合PIR和超音波或毫米波雷達的雙技術模組市場正以13.12%的複合年成長率快速成長,這些模組能夠檢測細微的動作和靜止的居住者。德州儀器(TI)的AWRL6844雷達將每個節點的成本降低了20美元,使其應用範圍從高階設施擴展到更廣泛的領域。
人工智慧驅動的邊緣處理技術透過學習特定設施的佔用模式來減少誤報。 BoschSensatek的目標是到2030年部署100億個智慧感測器,其中90%將整合人工智慧引擎,用於分析晶片上的原始波形。這項技術將提升材料清單(BOM)的價值,並進一步鞏固該平台在佔用感測器市場的地位。
區域分析
到2025年,北美將佔據最大的銷售佔有率。在美國,根據加州能源法規第24條和2021年版《國際節能規範》(IECC),商業設施必須配備自動斷電系統,這構成了市場需求的基礎。加拿大也呈現類似的趨勢,由於其漫長的供暖季,人們對基於佔用率的供暖控制表現出濃厚的興趣。在正在進行的維修項目中,城市中心2.4GHz頻段的擁擠是一項挑戰,因此,結合有線骨幹網和Sub-GHz頻段頻段無線網路的混合部署方案正在被推廣。
在歐洲,預計「翻新浪潮」計畫將帶來強勁成長,該計畫的目標是到2030年翻新3,500萬棟建築。德國、英國和法國已頒布國家建築規範,其中包含根據人員佔用情況自動關閉照明和通風的功能。遵守GDPR(一般資料保護規則)增加了成本,並延緩了人工智慧分析的普及,但提供本地資料處理的平台供應商正在努力緩解這些障礙。無線協定的細分迫使整合商依賴多重通訊協定閘道器,這增加了系統的複雜性,但同時,人員佔用感測器市場的業務收益也在成長。
預計到2031年,亞太地區將維持最高的複合年成長率。中國的「雙碳」計劃正在加速智慧建築的強制普及,尤其是在主要城市的公共部門專案中,部署感測器後能耗降低了20%。在日本和韓國,結合毫米波和人工智慧以最佳化舒適度的高階解決方案正日益受到青睞。雖然經濟實惠的被動紅外線(PIR)節點在印度和東南亞佔據主導地位,但班加羅爾和新加坡的商業辦公園區正在採用符合全球企業ESG目標的平台架構。這種多樣性為供應商提供了進入整個人體感應器市場的多層次機會。
其他好處
- Excel格式的市場預測(ME)表
- 3個月的分析師支持
目錄
第1章:引言
- 研究假設和市場定義
- 調查範圍
第2章:調查方法
第3章執行摘要
第4章 市場狀況
- 市場概覽
- 市場促進因素
- 美國和歐盟更嚴格的淨零排放建築規範:根據入住率強制停工。
- 新冠疫情時代,北美和歐盟的辦公大樓維修迎來了一波快速浪潮。
- 中國的「雙碳」藍圖正在推動智慧照明的發展。
- 利用物聯網進行空間利用分析,進而擴大感測器銷售。
- 利用 CMS 和 MDR 提高醫療床位運轉率的計畫。
- 透過降低多感測器晶片組的成本來發展暖通空調OEM管道
- 市場限制因素
- 2.4GHz網狀網路中的射頻擁塞和電池消耗
- 高溫資料中心發生誤報事件
- 無線標準混亂阻礙了歐盟的維修和安裝工作。
- 人工智慧人才分析中的 GDPR/CCPA 合規成本
- 價值供應鏈分析
- 監理展望
- 技術展望
- 波特五力分析
- 技術概述
- 投資分析
第5章 市場規模與成長預測
- 網路連線
- 有線
- 無線的
- Wi-Fi
- Zigbee
- Z-Wave
- 透過技術
- 被動紅外線(PIR)
- 超音波
- 微波
- 雙多技術(PIR+毫米波等)
- 毫米波/調頻連續波雷達
- 按安裝類型
- 吸頂式
- 壁掛式
- 辦公桌和家具一體化
- 嵌入式/嵌入式照明燈具
- 按安裝類型
- 維修和安裝
- 新建工程
- 依建築類型
- 住宅
- 商業
- 工業和倉儲
- 醫療和護理機構
- 政府/教育
- 透過使用
- 照明控制
- 暖通空調(HVAC/通風)
- 安全監控
- 行人流量測量和空間利用率
- 監測床位和廁所使用情況
- 按地區
- 北美洲
- 美國
- 加拿大
- 墨西哥
- 南美洲
- 巴西
- 阿根廷
- 其他南美國家
- 歐洲
- 英國
- 德國
- 法國
- 義大利
- 北歐國家(瑞典、挪威、丹麥、芬蘭)
- 其他歐洲國家
- 中東
- 沙烏地阿拉伯
- 阿拉伯聯合大公國
- 土耳其
- 其他中東國家
- 非洲
- 南非
- 奈及利亞
- 其他非洲國家
- 亞太地區
- 中國
- 日本
- 印度
- 韓國
- 澳洲
- 其他亞太國家
- 北美洲
第6章 競爭情勢
- 市場集中度
- 策略趨勢
- 市佔率分析
- 公司簡介
- Signify(Philips Lighting)
- Honeywell International Inc.
- Schneider Electric SE
- Johnson Controls International plc
- Legrand SA
- Eaton Corporation plc
- Acuity Brands, Inc.
- Leviton Manufacturing Co., Inc.
- Lutron Electronics Co., Inc.
- Hubbell Incorporated
- Siemens AG(Enlighted)
- Texas Instruments Incorporated
- Panasonic Corporation
- Bosch Sensortec GmbH
- Omron Corporation
- Delta Electronics, Inc.
- RAB Lighting Inc.
- SensorWorx(BEL Products)
- Stanley Black and Decker(STANLEY Security)
- OccupEye Ltd
- Pammvi Group
- General Electric Co.
第7章 市場機會與未來展望
According to Mordor Intelligence, the occupancy sensor market size was valued at USD 3.10 billion in 2025 and estimated to grow from USD 3.26 billion in 2026 to reach USD 4.16 billion by 2031, at a CAGR of 5.04% during the forecast period (2026-2031).
This report is Segmented by Network Connectivity (Wired, Wireless), Technology (Passive Infrared (PIR), Ultrasonic, Microwave, and More), Mounting Type (Ceiling-Mounted, Wall-Mounted, and More), Installation Type (Retrofit, New Construction), Building Type (Residential, Commercial, Industrial & Warehousing, and More), Application, and Geography. The Market Forecasts are Provided in Terms of Value (USD).
Global Occupancy Sensor Market Trends and Insights
Stricter net-zero building codes in U.S./EU mandating occupancy-based shut-off
California's Title 24 now requires occupancy sensing for receptacle and ventilation shut-off within 20 minutes of vacancy, while the 2021 International Energy Conservation Code mandates automatic controls in enclosed spaces. European renovation programs targeting 35 million buildings by 2030 echo these rules, making compliance rather than energy savings the primary adoption trigger. Commercial owners therefore embed sensors in construction documents rather than adding them post-build. This dynamic lifts baseline demand across the occupancy sensor market.
China dual-carbon roadmap boosting smart lighting IoT
China's goal of a 2030 carbon peak and 2060 neutrality propels smart building retrofits that favor sensor-based automation. Case studies in public institutions show energy savings above 20% after IoT lighting overhauls that rely on motion detection. Provincial disparity means turnkey packages that combine hardware and software succeed better than component sales, especially in tier-1 cities where budgets and technical skills align.
RF congestion & battery drain in 2.4 GHz mesh networks
Zigbee networks carrying 192 nodes keep sub-200 ms latency under clean radio conditions, yet packet loss rises sharply when Wi-Fi channels overlap. Frequent retransmits shorten coin-cell lifespan, raising maintenance costs for battery-powered devices. Building owners therefore hesitate to shift critical loads to wireless unless spectrum planning tools are in place.
Other drivers and restraints analyzed in the detailed report include:
- IoT-driven space utilization analytics upselling sensors
- Healthcare bed-occupancy programs under CMS & MDR
- False-positive events in high-heat data centers
For complete list of drivers and restraints, kindly check the Table Of Contents.
Segment Analysis
The wired category accounted for 61.55% of global 2025 revenues, confirming its central role in core building systems within the occupancy sensor market. Facility managers value immunity to radio interference and easier power delivery, so Ethernet-based digital addressable networks anchor lighting and HVAC controls in new commercial construction. Retrofit environments with limited conduit space lean toward wireless nodes that reduce installation labor, which explains the 12.18% CAGR forecast for mesh-based products through 2031. Hybrid designs are emerging: a wired backbone feeds PoE luminaires while Thread or Zigbee sensors populate the periphery, balancing reliability and flexibility.
Wireless growth is driven by protocol convergence. Matter-over-Thread eliminates prior vendor lock-in, and vendors like Aqara released presence sensors that self-commission across Apple, Amazon, and Google ecosystems. Philips Hue demonstrated a software update that lets light bulbs double as motion sensors, hinting at an architecture where every luminaire becomes a data node. This blurs the lines between connectivity classes and broadens addressable installations for the
Passive infrared achieved a 49.72% share in 2025, reinforcing its cost advantage inside the occupancy sensor market. Demand for higher fidelity propels dual-technology modules at a 13.12% CAGR, combining PIR with ultrasonic or mmWave radar to catch minor movements and stationary occupants. Texas Instruments' AWRL6844 radar lowers per-node cost by USD 20, expanding adoption beyond premium installations.
AI-enabled edge processing reduces nuisance alarms by learning site-specific occupancy patterns. Bosch Sensortec targets 10 billion intelligent sensors by 2030, with 90% embedding AI engines that distill raw waveforms on-chip. These developments increase bill-of-material value and reinforce platform stickiness inside the occupancy sensor market.
Complete Report Scope:
- By Network Connectivity
- Wired
- Wireless
- Wi-Fi
- Zigbee
- Z-Wave
- By Technology
- Passive Infrared (PIR)
- Ultrasonic
- Microwave
- Dual / Multi-Technology (PIR + mmWave, etc.)
- mmWave / FMCW Radar
- By Mounting Type
- Ceiling-Mounted
- Wall-Mounted
- Desk / Furniture-Integrated
- In-Fixture / Embedded Luminaire
- By Installation Type
- Retrofit
- New Construction
- By Building Type
- Residential
- Commercial
- Industrial and Warehousing
- Healthcare and Assisted Living
- Government and Education
- By Application
- Lighting Control
- HVAC and Ventilation
- Security and Surveillance
- People Counting and Space Utilization
- Bed / Restroom Occupancy Monitoring
- By Geography
- North America
- United States
- Canada
- Mexico
- South America
- Brazil
- Argentina
- Rest of South America
- Europe
- United Kingdom
- Germany
- France
- Italy
- Nordics (Sweden, Norway, Denmark, Finland)
- Rest of Europe
- Middle East
- Saudi Arabia
- UAE
- Turkey
- Rest of Middle East
- Africa
- South Africa
- Nigeria
- Rest of Africa
- Asia-Pacific
- China
- Japan
- India
- South Korea
- Australia
- Rest of Asia-Pacific
- North America
Geography Analysis
North America held the largest revenue share in 2025. The United States anchors demand with Title 24 and the 2021 IECC requiring automated shut-off across commercial spaces. Canada follows similar patterns and shows strong interest in occupancy-based heating due to long heating seasons. Ongoing retrofits contend with dense 2.4 GHz spectrum in urban cores, driving hybrid deployments that mix wired backbones and sub-GHz wireless.
Europe registers solid growth under the Renovation Wave program that targets 35 million buildings by 2030. Germany, the United Kingdom, and France institute national building codes that embed occupancy-triggered lighting and ventilation cut-offs. GDPR compliance adds cost and slows AI analytics roll-outs, yet platform vendors that offer on-premise data processing mitigate these barriers. Fragmented wireless protocols force integrators to rely on multiprotocol gateways, elevating system complexity but also boosting services revenue inside the occupancy sensor market.
Asia-Pacific records the fastest CAGR to 2031. China's dual-carbon policy accelerates smart building mandates, especially in tier-1 metros where public-sector projects showcase 20% energy reduction after sensor installations. Japan and South Korea emphasize premium solutions that pair mmWave with AI for comfort optimization. In India and Southeast Asia, cost-efficient PIR nodes dominate, yet commercial office parks in Bengaluru and Singapore adopt platform architectures that align with global corporate ESG goals. This heterogeneity offers multi-tiered entry points for vendors across the occupancy sensor market.
- Signify (Philips Lighting)
- Honeywell International Inc.
- Schneider Electric SE
- Johnson Controls International plc
- Legrand S.A.
- Eaton Corporation plc
- Acuity Brands, Inc.
- Leviton Manufacturing Co., Inc.
- Lutron Electronics Co., Inc.
- Hubbell Incorporated
- Siemens AG (Enlighted)
- Texas Instruments Incorporated
- Panasonic Corporation
- Bosch Sensortec GmbH
- Omron Corporation
- Delta Electronics, Inc.
- RAB Lighting Inc.
- SensorWorx (B.E.L. Products)
- Stanley Black and Decker (STANLEY Security)
- OccupEye Ltd
- Pammvi Group
- General Electric Co.
Additional Benefits:
- The market estimate (ME) sheet in Excel format
- 3 months of analyst support
TABLE OF CONTENTS
1 INTRODUCTION
- 1.1 Study Assumptions and Market Definition
- 1.2 Scope of the Study
2 RESEARCH METHODOLOGY
3 EXECUTIVE SUMMARY
4 MARKET LANDSCAPE
- 4.1 Market Overview
- 4.2 Market Drivers
- 4.2.1 Stricter Net-Zero Building Codes in U.S./EU Mandating Occupancy-Based Shut-off
- 4.2.2 Rapid Retrofit Wave of Post-COVID Office Stock (NA and EU)
- 4.2.3 China Dual-Carbon Roadmap Boosting Smart Lighting
- 4.2.4 IoT-Driven Space Utilization Analytics Upselling Sensors
- 4.2.5 Healthcare Bed-Occupancy Programs Under CMS and MDR
- 4.2.6 Multi-Sensor Chipset Cost Decline Opening HVAC OEM Channel
- 4.3 Market Restraints
- 4.3.1 RF Congestion and Battery Drain in 2.4 GHz Mesh Networks
- 4.3.2 False-Positive Events in High-Heat Data Centers
- 4.3.3 Fragmented Wireless Standards Hindering EU Retrofits
- 4.3.4 GDPR/CCPA Compliance Cost for AI People Analytics
- 4.4 Value / Supply-Chain Analysis
- 4.5 Regulatory Outlook
- 4.6 Technological Outlook
- 4.7 Porter's Five Forces Analysis
- 4.7.1 Threat of New Entrants
- 4.7.2 Bargaining Power of Buyers
- 4.7.3 Bargaining Power of Suppliers
- 4.7.4 Threat of Substitutes
- 4.7.5 Competitive Rivalry
- 4.8 Technology Snapshot
- 4.9 Investment Analysis
5 MARKET SIZE AND GROWTH FORECASTS (VALUE)
- 5.1 By Network Connectivity
- 5.1.1 Wired
- 5.1.2 Wireless
- 5.1.2.1 Wi-Fi
- 5.1.2.2 Zigbee
- 5.1.2.3 Z-Wave
- 5.2 By Technology
- 5.2.1 Passive Infrared (PIR)
- 5.2.2 Ultrasonic
- 5.2.3 Microwave
- 5.2.4 Dual / Multi-Technology (PIR + mmWave, etc.)
- 5.2.5 mmWave / FMCW Radar
- 5.3 By Mounting Type
- 5.3.1 Ceiling-Mounted
- 5.3.2 Wall-Mounted
- 5.3.3 Desk / Furniture-Integrated
- 5.3.4 In-Fixture / Embedded Luminaire
- 5.4 By Installation Type
- 5.4.1 Retrofit
- 5.4.2 New Construction
- 5.5 By Building Type
- 5.5.1 Residential
- 5.5.2 Commercial
- 5.5.3 Industrial and Warehousing
- 5.5.4 Healthcare and Assisted Living
- 5.5.5 Government and Education
- 5.6 By Application
- 5.6.1 Lighting Control
- 5.6.2 HVAC and Ventilation
- 5.6.3 Security and Surveillance
- 5.6.4 People Counting and Space Utilization
- 5.6.5 Bed / Restroom Occupancy Monitoring
- 5.7 By Geography
- 5.7.1 North America
- 5.7.1.1 United States
- 5.7.1.2 Canada
- 5.7.1.3 Mexico
- 5.7.2 South America
- 5.7.2.1 Brazil
- 5.7.2.2 Argentina
- 5.7.2.3 Rest of South America
- 5.7.3 Europe
- 5.7.3.1 United Kingdom
- 5.7.3.2 Germany
- 5.7.3.3 France
- 5.7.3.4 Italy
- 5.7.3.5 Nordics (Sweden, Norway, Denmark, Finland)
- 5.7.3.6 Rest of Europe
- 5.7.4 Middle East
- 5.7.4.1 Saudi Arabia
- 5.7.4.2 UAE
- 5.7.4.3 Turkey
- 5.7.4.4 Rest of Middle East
- 5.7.5 Africa
- 5.7.5.1 South Africa
- 5.7.5.2 Nigeria
- 5.7.5.3 Rest of Africa
- 5.7.6 Asia-Pacific
- 5.7.6.1 China
- 5.7.6.2 Japan
- 5.7.6.3 India
- 5.7.6.4 South Korea
- 5.7.6.5 Australia
- 5.7.6.6 Rest of Asia-Pacific
- 5.7.1 North America
6 COMPETITIVE LANDSCAPE
- 6.1 Market Concentration
- 6.2 Strategic Moves
- 6.3 Market Share Analysis
- 6.4 Company Profiles (includes Global level Overview, Market level overview, Core Segments, Financials as available, Strategic Information, Market Rank/Share for key companies, Products and Services, and Recent Developments)
- 6.4.1 Signify (Philips Lighting)
- 6.4.2 Honeywell International Inc.
- 6.4.3 Schneider Electric SE
- 6.4.4 Johnson Controls International plc
- 6.4.5 Legrand S.A.
- 6.4.6 Eaton Corporation plc
- 6.4.7 Acuity Brands, Inc.
- 6.4.8 Leviton Manufacturing Co., Inc.
- 6.4.9 Lutron Electronics Co., Inc.
- 6.4.10 Hubbell Incorporated
- 6.4.11 Siemens AG (Enlighted)
- 6.4.12 Texas Instruments Incorporated
- 6.4.13 Panasonic Corporation
- 6.4.14 Bosch Sensortec GmbH
- 6.4.15 Omron Corporation
- 6.4.16 Delta Electronics, Inc.
- 6.4.17 RAB Lighting Inc.
- 6.4.18 SensorWorx (B.E.L. Products)
- 6.4.19 Stanley Black and Decker (STANLEY Security)
- 6.4.20 OccupEye Ltd
- 6.4.21 Pammvi Group
- 6.4.22 General Electric Co.
7 MARKET OPPORTUNITIES AND FUTURE OUTLOOK
- 7.1 White-Space and Unmet-Need Assessment

 無線人體感應器:市場佔有率分析、產業趨勢與統計及成長預測(2026-2031 年)
 人體感應器市場-2026-2032年全球市場預測
 人體感應器市場報告:按網路類型、技術、建築類型、覆蓋範圍、應用和地區分類,2026-2034 年
 人體感應器市場:按感測器類型、應用和地區分類
 全球人體感應器市場規模、佔有率、趨勢和成長分析報告(2026-2034年)智慧人體感應器照明應用市場:2026-2032年全球市場預測(以整合方式、連接方式、安裝方式、安裝方法、最終用戶和應用領域分類)
 桌面佔用感測器市場規模、佔有率和成長分析(按感測器類型、連接技術、應用、最終用戶和地區分類)—2026-2033年產業預測
 人體感應器市場分析及預測(至2035年):依類型、產品類型、服務、技術、組件、應用、最終用戶、功能、安裝類型分類有線人體感應器市場分析及預測(至2035年):依類型、產品類型、服務、技術、組件、應用、功能、安裝類型、設備及最終用戶分類無線人體感應器市場分析及預測(至2035年):依類型、產品類型、服務、技術、組件、應用、形式、部署方式、最終用戶及功能分類