


 |
市場調查報告書
商品編碼
2113745
酒精飲料包裝:市場佔有率分析、產業趨勢與統計、成長預測(2026-2031)Alcoholic Drinks Packaging - Market Share Analysis, Industry Trends & Statistics, Growth Forecasts (2026 - 2031) |
||||||

※ 本網頁內容可能與最新版本有所差異。詳細情況請與我們聯繫。
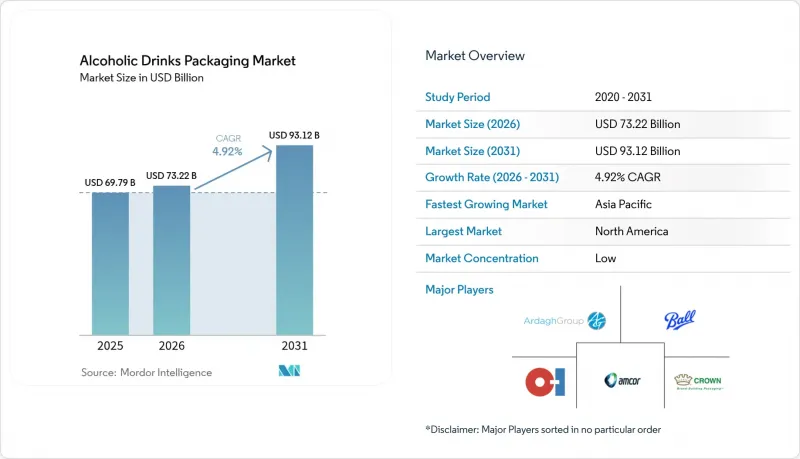
據估計,2026年酒精飲料包裝市值將達到732.2億美元,高於2025年的697.9億美元,預計到2031年將達到931.2億美元。
預計從 2026 年到 2031 年,其複合年成長率將達到 4.92%。
本報告按材質(金屬、玻璃、塑膠及其他材質)、包裝類型(瓶裝、金屬罐裝、袋裝及其他包裝類型)、產品(啤酒、烈酒、葡萄酒、即飲雞尾酒及其他產品)、配銷通路(Off-Trade零售、On-Trade/HoReCa、電商及免稅店)和地區進行細分。市場預測以美元計價。
全球酒精飲料包裝市場趨勢與洞察
對永續和環保包裝的需求日益成長
擴大生產者責任制目前已覆蓋歐洲超過60%的飲料銷售,並正在加速玻璃廢棄物的回收。帝亞吉歐計畫在2024年投資1,600萬英鎊(約2,030萬美元)用於紙質烈酒瓶的商業化,目標是到2030年售出1億個。百加得正與Encirc公司合作開發氫燃料反應器,可將每噸玻璃生產的排放量減少90%。 EcoSpirits公司的噸袋系統已在15個市場投入使用,該系統可消除一次性玻璃瓶,並將每公升的廢棄物減少85%。保樂力加報告稱,到2025年,透過長期玻璃廢棄物處理契約,其再生玻璃的使用量將增加23%。這些進展表明,遵守環境法規如今與品牌建立和成本效益密切相關。
即飲型酒精飲料的快速擴張
2024年,即飲雞尾酒的成長率達到18%,超過了所有其他類別。鋁罐憑藉其便攜性和12個月的保存期限,佔據了92%的市場佔有率。帝亞吉歐旗下的摩根船長即飲系列採用了先進的330毫升數位印刷罐,降低了40%的設置成本,並實現了1萬罐的小批量生產。日本和韓國也出現了類似的趨勢,三得利和樂天七星推出了符合當地偏好的罐裝威士卡調酒和日本燒酒。監管機構的關注點仍然集中在食品接觸材料和配料標籤上,但鑑於該品類的利潤率相對較低,合規性尚可控制。
原料和能源成本波動
2024年,鋁均價為每噸2,420美元,較上年上漲14%,對易拉罐利潤率帶來壓力。歐洲天然氣價格上漲導致玻璃製造成本增加18%,每個易拉罐額外增加0.08至0.12歐元。受原油價格波動影響,PET樹脂價格在每噸950至1180美元之間波動。儘管進行了避險,Ball公司仍額外承擔了3.4億美元的原物料成本。為因應這項挑戰,玻璃製造商正在推動熔爐電氣化改造,例如Alder公司位於瑞典的工廠利用水力發電,使每噸成本降低了22%。 2024年,歐盟排放交易體系(EU ETS)下的碳排放權成本使玻璃和鋁的成本均增加了每噸15歐元,凸顯了能源政策與包裝產業經濟之間的密切聯繫。
細分市場分析
到2025年,玻璃將佔葡萄酒和高階烈酒市場銷售額的54.05%,鞏固其在該市場的主導地位。在這些市場中,玻璃的惰性和品牌傳承是關鍵考量。金屬材質在酒精飲料包裝市場正加速發展,預計到2031年,鋁的複合年成長率將達到6.35%,主要得益於即飲雞尾酒、罐裝葡萄酒和精釀淡啤酒的日益普及。 2020年至2024年間,金屬材料的複合年成長率達到5.9%,隨著啤酒廠採用數位印刷技術,這為其進一步應用奠定了基礎。
到2024年,Veralia在歐洲玻璃製造爐中回收玻璃的使用率平均達到58%,這不僅緩解了原料成本壓力,也滿足了生態標籤的要求。紙張和生物基複合材料仍處於試驗階段,但帝亞吉歐在2030年實現1億個紙瓶的目標表明,未來它們將被廣泛採用。由於塑膠的阻隔性,其普及速度較為緩慢,但在一些領域,例如軟包裝袋和迷你瓶,塑膠的抗衝擊性優於傳統玻璃瓶,因此已形成了一個小眾市場。監管的重點是ISO 14044標準定義的生命週期評估(LCA),這迫使品牌發布環境產品聲明(EPD)。隨著永續發展報告標準的日益嚴格,能夠檢驗碳排放數據並確保玻璃屑穩定供應的供應商將佔據最佳優勢。
預計到2025年,瓶裝啤酒將佔總銷售量的58.20%。這項預測得到了葡萄酒和高級啤酒市場成熟趨勢的支持,消費者偏好玻璃瓶裝的美感以及標籤上引人入勝的故事。同時,金屬罐裝啤酒預計將以7.05%的複合年成長率成長,其應用範圍將從啤酒擴展到烈酒和葡萄酒,因為消費者需要「即買即走」的便利性。精釀啤酒商已採用內部數位印刷技術,將設計製作前置作業時間從八週縮短至兩天,並能夠推出限量5000瓶的限量版啤酒,從而在酒吧內製造話題。
儘管袋裝商品的市佔率仍不足3%,但它們在電商市場持續成長,其輕巧的特性已使破損成本降低了40%。盒中袋和可重複填充的托特包滿足了實體店的需求以及免稅專供商品的需求,從而強化了循環供應鏈模式。 Ardaag報告稱,金屬酒罐的出貨量增加了12%,這對於瞄準節日銷售的澳洲品牌而言尤其顯著。押金返還計劃促進了回收利用,在消費者便利性和監管獎勵之間取得了平衡。 ISO 11683可回收性標準正在影響零售貨架的商品分配,因為零售連鎖店現在要求使用更易於分離的包裝形式。
區域分析
2025年,北美地區佔全球銷售額的39.10%,這主要得益於精釀啤酒的創新、頂級烈酒的推出以及促進高回收率的嚴格押金返還規定。然而,由於品類成熟導致銷售成長放緩,儘管高階產品組合提升了利潤率,但預計到2031年的複合年成長率僅為3.95%。 2025年,歐洲地區佔全球銷售額的32.40%,面臨德國啤酒銷售量下滑的壓力,但法國和義大利的葡萄酒包裝以及東歐的烈酒銷售表現強勁。將於2027年生效的歐盟數位產品護照計畫鼓勵供應商採用基於區塊鏈的可追溯性和QR碼標籤,詳細說明回收成分和使用後的處置方法。 OI已開始在波蘭和西班牙部署電爐,每噸排放量減少了一半,並有助於滿足各地區的監管合規要求。
亞太地區預計將以7.95%的複合年成長率成為酒精飲料包裝市場成長最快的地區,這主要得益於中國和印度的都市化以及收入的成長。亞洲開發銀行(亞銀)預測,到2030年,中產階級人口將達到35億,這將支撐高階包裝的需求。波爾公司在印度的新工廠預計每年將供應12億個罐裝包裝,這反映了其旨在降低運輸成本和縮短前置作業時間的在地化策略。東南亞地區也受惠於皇冠公司在柬埔寨的擴張,其產能將提高30%,以滿足該地區即飲飲料市場的成長需求。
巴西和阿根廷仍然是關鍵市場,儘管外匯波動推高了進口鋁和玻璃的成本,但其成長勢頭依然強勁。 Veraria公司向尋求高階出口瓶的拉丁美洲烈酒製造商出口的玻璃製品數量增加了9%。中東和非洲地區的市佔率仍不到5%,但在阿拉伯聯合大公國和南非的免稅店和外籍人士零售市場,對頂級烈酒的需求正在成長。目前正在進行基礎設施投資,以加強低溫運輸和回收系統,凸顯了循環包裝模式的長期潛力。隨著人們對成分標籤和年齡限制等法規的日益關注,出口商發現區域合規性正在與國際標準接軌。
其他好處:
- Excel格式的市場預測(ME)表
- 3個月的分析師支持
目錄
第1章:引言
- 研究假設和市場定義
- 調查範圍
第2章:調查方法
第3章執行摘要
第4章 市場狀況
- 市場概覽
- 市場促進因素
- 開發中國家可支配所得增加
- 對永續和環保包裝材料的需求日益成長
- 酒精飲料日益精細化,推動了對高檔包裝的需求。
- 即飲型酒精飲料的快速擴張
- 啤酒生產商正向內部數位罐體印刷平台轉型
- 在高稅收市場中採用可重複填充的酒類托特包
- 市場限制因素
- 原料和能源成本波動
- 由於嚴格的環境法規,包裝成本增加。
- 由於與電動車電池的競爭,鋁罐出現供不應求。
- 歐盟強制性數位產品護照增加了標籤標註的複雜性。
- 產業價值鏈分析
- 宏觀經濟因素對市場的影響
- 監理情勢
- 技術展望
- 波特五力分析
第5章 市場規模與成長預測
- 材料
- 金屬
- 玻璃
- 塑膠
- 其他材料
- 按包裝類型
- 瓶子
- 金屬罐
- 小袋
- 其他包裝類型
- 依產品
- 啤酒
- 烈酒
- 葡萄酒
- 即飲雞尾酒
- 其他產品
- 透過分銷管道
- Off-Trade零售
- On-Trade/飯店餐飲
- 電子商務
- 免稅店
- 按地區
- 北美洲
- 美國
- 加拿大
- 墨西哥
- 歐洲
- 英國
- 法國
- 德國
- 義大利
- 西班牙
- 其他歐洲國家
- 亞太地區
- 中國
- 印度
- 日本
- 韓國
- 其他亞太國家
- 南美洲
- 巴西
- 阿根廷
- 其他南美國家
- 中東和非洲
- 中東
- 阿拉伯聯合大公國
- 土耳其
- 其他中東國家
- 非洲
- 南非
- 奈及利亞
- 其他非洲國家
- 中東
- 北美洲
第6章 競爭情勢
- 市場集中度
- 策略趨勢
- 市佔率分析
- 公司簡介
- Amcor plc
- Mondi plc
- Ball Corporation
- Compagnie de Saint-Gobain SA
- Tetra Laval International SA
- Crown Holdings Inc.
- Krones AG
- Sidel SA
- Owens-Illinois Inc.
- Ardagh Group SA
- Verallia SA
- Vidrala SA
- Gerresheimer AG
- Smurfit WestRock
- International Paper Company
- CANPACK SA
- Toyo Seikan Group Holdings Ltd.
- Vetropack Holding Ltd.
- EcoSpirits Global Pte. Ltd.
第7章 市場機會與未來展望
According to Mordor Intelligence, the alcoholic drinks packaging market size in 2026 is estimated at USD 73.22 billion, growing from 2025 value of USD 69.79 billion with 2031 projections showing USD 93.12 billion, growing at 4.92% CAGR over 2026-2031.
This report is Segmented by Material (Metal, Glass, Plastic, Other Materials), Package Type (Bottles, Metal Cans, Pouches, Other Package Types), Product (Beer, Spirits, Wine, Ready-To-Drink Cocktails, Other Products), Distribution Channel (Off-Trade Retail, On-Trade/HoReCa, E-Commerce, Duty Free), and Geography. The Market Forecasts are Provided in Terms of Value (USD).
Global Alcoholic Drinks Packaging Market Trends and Insights
Growing Demand for Sustainable and Eco-Friendly Packaging
Extended producer responsibility schemes now cover more than 60% of European beverage sales and are spurring faster collection of glass cullet.Diageo invested GBP 16 million (USD 20.3 million) in 2024 to commercialize a paper-based spirits bottle, targeting 100 million units by 2030. Bacardi partnered with Encirc on a hydrogen-fueled furnace that lowers glass-production emissions by 90% per ton. EcoSpirits' tote system, already active in 15 markets, eliminates single-use glass and trims waste by 85% per liter. Pernod Ricard reported a 23% uptick in recycled-content glass use in 2025, secured through long-term cullet contracts. These moves demonstrate how environmental compliance is now closely tied to branding and cost efficiency.
Rapid Expansion of Ready-To-Drink Alcoholic Beverages
RTD cocktails outpaced every other category with 18% growth in 2024. Aluminum cans captured a 92% market share thanks to their portability and 12-month shelf life.Aluminum cans captured a 92% market share thanks to their portability and 12-month shelf life. Diageo's Captain Morgan RTD line adopted digitally printed 330 milliliter sleek cans, cutting set-up costs by 40% and enabling runs as small as 10,000 units. A similar momentum is visible in Japan and South Korea, where Suntory and Lotte Chilsung have launched canned highballs and soju drinks tailored to local tastes. Regulatory attention remains focused on food-contact linings and ingredient disclosures, but compliance is manageable given the category's relatively narrow margins.
Fluctuating Raw Material and Energy Costs
Aluminum averaged USD 2,420 per metric ton in 2024, up 14% year-over-year, pressuring can margins.European natural-gas spikes increased glass-production costs by 18%, resulting in surcharges of EUR 0.08 to EUR 0.12 per bottle. PET resin traded between USD 950 and USD 1,180 per ton amid volatility in crude oil prices. Ball absorbed USD 340 million in additional raw material spend despite hedging. In response, glass makers are electrifying furnaces; Ardagh's hydro-powered Swedish site cut per-ton costs by 22%. Carbon allowances under the EU ETS added EUR 15 per ton to both glass and aluminum in 2024, underscoring the link between energy policy and packaging economics.
Other drivers and restraints analyzed in the detailed report include:
- Premiumization of Alcoholic Drinks Fuelling High-End Containers
- Rising Disposable Income in Developing Countries
- Aluminum Can Body Shortage from EV Battery Competition
For complete list of drivers and restraints, kindly check the Table Of Contents.
Segment Analysis
Glass held 54.05% of 2025 revenue, solidifying its dominance in wine and high-end spirits, where inertness and brand heritage are key considerations. The alcoholic drinks packaging market is experiencing accelerated growth in metal, with aluminum forecast to post a 6.35% CAGR through 2031, driven by the rise of RTD cocktails, canned wine, and lightweight craft beer launches. Metal's prior 5.9% CAGR from 2020 to 2024 now serves as a launchpad for faster uptake as breweries integrate digital printing.
Recycled-content glass usage averaged 58% in Verallia's European furnaces in 2024, alleviating input cost pressure while meeting eco-label requirements. Paper and bio-based composites remain experimental, yet Diageo's target of 100 million paper bottles by 2030 indicates future traction. Plastic lags due to barrier limits, though pouches and miniatures create small niches where shatter resistance trumps tradition. Regulatory focus centers on life-cycle assessments, as outlined in ISO 14044, prompting brands to publish Environmental Product Declarations. Suppliers capable of validating carbon data and ensuring a stable supply of cullet are best positioned as sustainability reporting becomes more stringent.
Bottles contributed 58.20% of 2025 revenue, riding entrenched wine and premium-beer norms that favor glass aesthetics and storytelling labels. Metal cans, however, are projected to register a 7.05% CAGR, moving beyond beer into spirits and wine as consumers seek grab-and-go convenience. Craft brewers embraced in-house digital printing, cutting artwork lead times from eight weeks to two days, and enabling 5,000-unit special editions that drive taproom buzz.
Pouches hold a share of under 3% yet are growing in e-commerce, where lighter shipments lower breakage costs by 40%. Bag-in-box and refillable totes cater to on-premise needs and duty-free exclusives, thereby strengthening circular supply models. Ardagh logged a 12% uptick in metal-wine can shipments, especially among Australian brands targeting festival sales. Deposit-return schemes reward recycling, aligning consumer convenience with regulatory incentives. ISO 11683 recyclability standards now influence retailer shelf allocations as chains demand easily sortable formats.
Complete Report Scope:
- By Material
- Metal
- Glass
- Plastic
- Other Materials
- By Package Type
- Bottles
- Metal Cans
- Pouches
- Other Package Types
- By Product
- Beer
- Spirits
- Wine
- Ready-To-Drink Cocktails
- Other Products
- By Distribution Channel
- Off-Trade Retail
- On-Trade / HoReCa
- E-Commerce
- Duty Free
- By Geography
- North America
- United States
- Canada
- Mexico
- Europe
- United Kingdom
- France
- Germany
- Italy
- Spain
- Rest of Europe
- Asia-Pacific
- China
- India
- Japan
- South Korea
- Rest of Asia-Pacific
- South America
- Brazil
- Argentina
- Rest of South America
- Middle East and Africa
- Middle East
- United Arab Emirates
- Turkey
- Rest of Middle East
- Africa
- South Africa
- Nigeria
- Rest of Africa
- Middle East
- North America
Geography Analysis
North America captured 39.10% of 2025 revenue, driven by craft-beer innovations, premium-spirit launches, and stringent deposit-return regulations that foster high recycling rates. Yet, growth is projected at a modest 3.95% CAGR through 2031, as category maturity tempers unit expansion, even while a premium SKU mix improves margins. Europe contributed 32.40% in 2025, facing pressure from declining German beer volumes but showing resilience in French and Italian wine packaging, as well as Eastern European spirits sales. The EU Digital Product Passport, effective as of 2027, is encouraging suppliers to adopt blockchain traceability and QR-code labels that detail the recycled content and end-of-life options. O-I began deploying electric furnaces in Poland and Spain, cutting emissions by half per ton and supporting regional compliance needs.
The Asia-Pacific region is set to grow at an 7.95% CAGR, the fastest among the alcoholic drinks packaging markets, as China and India urbanize and incomes rise. The Asian Development Bank forecasts a 3.5 billion-strong middle class by 2030, which is expected to support demand for premium packages. Ball's new Indian plant will supply 1.2 billion cans annually, reflecting a localization strategy aimed at lowering freight costs and shortening lead times. Southeast Asia also benefits from Crown's Cambodian expansion, which adds 30% capacity to cover RTD growth in the region.
Brazil and Argentina being the dominant countries, despite currency headwinds that increase the cost of imported aluminum and glass. Verallia grew glass shipments 9% to Latin American distillers seeking premium export bottles. Middle East and Africa remain below 5%, but the United Arab Emirates and South Africa show premium spirits momentum in duty-free and expatriate retail. Infrastructure investments to bolster cold chains and recycling systems are underway, revealing long-term potential for circular packaging models. Regulatory focus on ingredient labeling and age controls is spreading, harmonizing regional compliance with international standards for exporters.
- Amcor plc
- Mondi plc
- Ball Corporation
- Compagnie de Saint-Gobain SA
- Tetra Laval International SA
- Crown Holdings Inc.
- Krones AG
- Sidel SA
- Owens-Illinois Inc.
- Ardagh Group SA
- Verallia SA
- Vidrala SA
- Gerresheimer AG
- Smurfit WestRock
- International Paper Company
- CANPACK SA
- Toyo Seikan Group Holdings Ltd.
- Vetropack Holding Ltd.
- EcoSpirits Global Pte. Ltd.
Additional Benefits:
- The market estimate (ME) sheet in Excel format
- 3 months of analyst support
TABLE OF CONTENTS
1 INTRODUCTION
- 1.1 Study Assumptions and Market Definition
- 1.2 Scope of the Study
2 RESEARCH METHODOLOGY
3 EXECUTIVE SUMMARY
4 MARKET LANDSCAPE
- 4.1 Market Overview
- 4.2 Market Drivers
- 4.2.1 Rising Disposable Income in Developing Countries
- 4.2.2 Growing Demand for Sustainable and Eco-Friendly Packaging
- 4.2.3 Premiumization of Alcoholic Drinks Fuelling High-End Containers
- 4.2.4 Rapid Expansion of Ready-To-Drink Alcoholic Beverages
- 4.2.5 Breweries' Shift to In-House Digital Can Printing Platforms
- 4.2.6 Adoption of Refillable Spirits Totes in High-Duty Markets
- 4.3 Market Restraints
- 4.3.1 Fluctuating Raw Material and Energy Costs
- 4.3.2 Stringent Environmental Packaging Compliance Costs
- 4.3.3 Aluminum Can Body Shortage From EV Battery Competition
- 4.3.4 EU Digital Product Passport Mandates Increasing Label Complexity
- 4.4 Industry Value Chain Analysis
- 4.5 Impact of Macroeconomic Factors on the Market
- 4.6 Regulatory Landscape
- 4.7 Technological Outlook
- 4.8 Porter's Five Forces Analysis
- 4.8.1 Threat of New Entrants
- 4.8.2 Bargaining Power of Buyers
- 4.8.3 Bargaining Power of Suppliers
- 4.8.4 Threat of Substitute Products
- 4.8.5 Intensity of Competitive Rivalry
5 MARKET SIZE AND GROWTH FORECASTS (VALUE)
- 5.1 By Material
- 5.1.1 Metal
- 5.1.2 Glass
- 5.1.3 Plastic
- 5.1.4 Other Materials
- 5.2 By Package Type
- 5.2.1 Bottles
- 5.2.2 Metal Cans
- 5.2.3 Pouches
- 5.2.4 Other Package Types
- 5.3 By Product
- 5.3.1 Beer
- 5.3.2 Spirits
- 5.3.3 Wine
- 5.3.4 Ready-To-Drink Cocktails
- 5.3.5 Other Products
- 5.4 By Distribution Channel
- 5.4.1 Off-Trade Retail
- 5.4.2 On-Trade / HoReCa
- 5.4.3 E-Commerce
- 5.4.4 Duty Free
- 5.5 By Geography
- 5.5.1 North America
- 5.5.1.1 United States
- 5.5.1.2 Canada
- 5.5.1.3 Mexico
- 5.5.2 Europe
- 5.5.2.1 United Kingdom
- 5.5.2.2 France
- 5.5.2.3 Germany
- 5.5.2.4 Italy
- 5.5.2.5 Spain
- 5.5.2.6 Rest of Europe
- 5.5.3 Asia-Pacific
- 5.5.3.1 China
- 5.5.3.2 India
- 5.5.3.3 Japan
- 5.5.3.4 South Korea
- 5.5.3.5 Rest of Asia-Pacific
- 5.5.4 South America
- 5.5.4.1 Brazil
- 5.5.4.2 Argentina
- 5.5.4.3 Rest of South America
- 5.5.5 Middle East and Africa
- 5.5.5.1 Middle East
- 5.5.5.1.1 United Arab Emirates
- 5.5.5.1.2 Turkey
- 5.5.5.1.3 Rest of Middle East
- 5.5.5.2 Africa
- 5.5.5.2.1 South Africa
- 5.5.5.2.2 Nigeria
- 5.5.5.2.3 Rest of Africa
- 5.5.5.1 Middle East
- 5.5.1 North America
6 COMPETITIVE LANDSCAPE
- 6.1 Market Concentration
- 6.2 Strategic Moves
- 6.3 Market Share Analysis
- 6.4 Company Profiles (includes Global Level Overview, Market Level Overview, Core Segments, Financials as available, Strategic Information, Market Rank/Share for key companies, Products and Services, and Recent Developments)
- 6.4.1 Amcor plc
- 6.4.2 Mondi plc
- 6.4.3 Ball Corporation
- 6.4.4 Compagnie de Saint-Gobain SA
- 6.4.5 Tetra Laval International SA
- 6.4.6 Crown Holdings Inc.
- 6.4.7 Krones AG
- 6.4.8 Sidel SA
- 6.4.9 Owens-Illinois Inc.
- 6.4.10 Ardagh Group SA
- 6.4.11 Verallia SA
- 6.4.12 Vidrala SA
- 6.4.13 Gerresheimer AG
- 6.4.14 Smurfit WestRock
- 6.4.15 International Paper Company
- 6.4.16 CANPACK SA
- 6.4.17 Toyo Seikan Group Holdings Ltd.
- 6.4.18 Vetropack Holding Ltd.
- 6.4.19 EcoSpirits Global Pte. Ltd.
7 MARKET OPPORTUNITIES AND FUTURE OUTLOOK
- 7.1 White-Space and Unmet-Need Assessment

 酒精飲料包裝市場:2026-2032年全球市場預測(依產品類型、包裝材料、瓶蓋類型、尺寸、包裝尺寸、最終用戶和銷售管道)
 全球葡萄酒和烈酒包裝市場:市場規模、佔有率、成長和行業分析:按材料類型、產品類型和區域預測(至 2034 年)酒精飲料包裝市場:依材料、形狀、容量、瓶蓋類型和標籤類型分類-2026年至2032年全球市場預測
 酒精包裝市場分析及預測(至2035年):類型、材料類型、技術、應用、產品類型、最終用戶、製程、組件、功能與服務
 酒精飲料包裝市場規模、佔有率、成長率及全球產業分析:按類型、應用和地區分類,至2026-2034年的預測全球酒精飲料包裝市場規模、佔有率、趨勢和成長分析報告(2026-2034)永續酒精飲料包裝市場-2026-2031年預測
 酒精包裝市場規模、佔有率和成長分析(按材料類型、包裝類型、應用和地區分類):產業預測(2026-2033 年)2026-2032 年酒精飲料包裝市場(按材料類型、應用、包裝類型和地區分類)
 酒精包裝市場機會、成長動力、產業趨勢分析與 2025 - 2034 年預測