


 |
市場調查報告書
商品編碼
2113539
北美電池市場:市場佔有率分析、產業趨勢與統計及成長預測(2026-2031 年)North America Battery - Market Share Analysis, Industry Trends & Statistics, Growth Forecasts (2026 - 2031) |
||||||

※ 本網頁內容可能與最新版本有所差異。詳細情況請與我們聯繫。
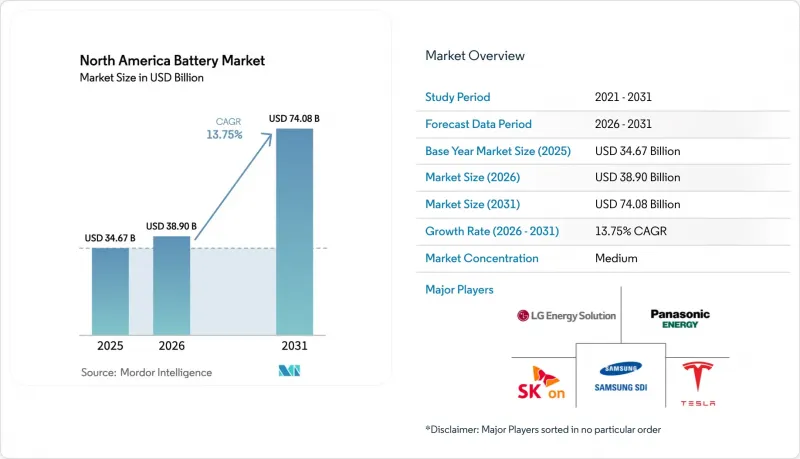
根據 Mordor Intelligence 預測,北美電池市場規模預計將在 2025 年達到 346.7 億美元,2026 年達到 389 億美元,到 2031 年達到 740.8 億美元,2026 年至 2031 年的複合年成長率為 13.75%。
本報告按電池類型(一次電池)、技術(鉛酸電池、鋰離子電池、鎳氫電池、鎳鎘電池、鈉硫電池、固態電池、液流固態電池和新興化學電池)、應用(汽車、工業、攜帶式設備、電動工具、SLI 等)和地區(美國、加拿大、墨西哥)進行細分。市場規模和預測均以美元計價。
北美電池市場趨勢與洞察
在IRA的推動下,擴大超級工廠建設將降低包裝成本。
《通貨膨脹控制法案》(IRA) 第 45X 條規定,國產電池每度電可獲得 35 美元的補貼,電池組件每千瓦時可獲得 10 美元的補貼。自 2022 年以來,已有 13 個州宣布了總計 1,100 億美元的電池投資計畫。 BlueOval SK 已從美國能源部獲得 96 億美元的貸款,用於在肯塔基州和田納西州建造兩座工廠,預計首條生產線將於 2025 年底運作。Panasonic於 2025 年將其位於堪薩斯州德索託的工廠產能擴大至 30 吉瓦時,而三星 SDI 和通用汽車已在印第安納州破土動工,目標是在 2026 年運作。這些項目預計將把盈虧平衡運轉率閾值80% 降低到 60%,加快運作速度,並在 2022 年至 2027 年間將電池組成本降低 40%。隨著電動車和內燃機汽車總擁有成本 (TCO) 的下降,預計電動車和內燃機汽車的總擁有成本最早將於 2027 年達到平衡,比許多汽車製造商最初預期的要早整整兩年。
鼓勵獎勵本土以降低原始設備製造商供應鏈風險
2021年至2022年半導體短缺期間,汽車製造商額外承擔了23億美元的物流成本。這促使他們轉向區域電池生產,以降低運輸中斷和關稅風險。根據將於2024年1月生效的《通貨膨脹控制法案》(IRA)中關於「受關注外國公司」的條款,如果電池或關鍵礦物由中國或俄羅斯公司供應,電動車將無法享受7500美元的消費者稅額扣抵。這導致供應商需要重新選擇。 Ultium Cells目前在美國營運三家工廠,總合為140吉瓦時,將電池前置作業時間從12週縮短至4週,並將營運資金需求減少了約20%。此後,Stellantis和三星SDI投資73億美元在科科莫建造了工廠,以確保全尺寸皮卡的電池供應。這種垂直整合模式保護了OEM專案免受外匯波動和物流瓶頸的影響,使其即使在電動車產量增加的時期也能保持獲利能力。
鋰價波動會擴大專案的內部報酬率 (IRR)。
碳酸鋰現貨價格從2022年底的每噸8萬美元暴跌至2024年6月的1.2萬美元,隨後在12月反彈至1.5萬美元。這種過山車般的價格波動導致電池組的獲利能力出現12%至15%的差異。通用汽車(GM)的Soccer Pass合資企業計劃在2027年實現每年4萬噸的碳酸鋰供應,將使每年80萬輛汽車免受現貨價格波動的影響。然而,該專案的內部收益率(IRR)仍然非常敏感,如果價格繼續跌破每噸1.8萬美元,投資回收期可能會超過10年,這可能會延遲中型電池製造商獲得銀行融資。沒有自己鋰資源的中小企業難以達到貸款機構要求的 80% 回收配額,這阻礙了新工廠的建設,並給短期產能擴張帶來了沉重負擔。
細分市場分析
預計到2025年,可充電電池將佔北美電池市場佔有率的75.5%,並將以15.5%的複合年成長率持續成長至2031年。這一成長趨勢反映了電動車和固定式儲能系統應用的激增,這兩者都需要長循環壽命和多年質保,因此鋰離子電池更受青睞。到2025年,電動卡車的平均電池組容量將達到78千瓦時,這將推高每輛車的電池需求,並加速超級工廠的運轉率。一次電池佔銷售額的24.5%,但其成長率仍處於個位數,且僅限於醫療、國防和物聯網等細分市場,在這些市場中,數十年的保存期限比可充電性更為重要。行業重組趨勢因細分市場而異。金霸王和勁量在消費鹼性電池領域保持著強大的品牌實力,而汽車原始設備製造商正在擴大其鋰離子電池的內部生產,這給獨立供應商的利潤率帶來了壓力。
單位經濟效益也在分化。特斯拉的自有生產線「4680」預計到2025年9月將達到10吉瓦時的產能,與外部採購的2170型電池相比,每千瓦時的成本將降低15%,同時還能獲得先前歸屬於供應商的上游價值。小規模的一次電池供應商受惠於美國國防部2024年12%的採購量成長。這表明,即使在性能至關重要的細分市場銷售量成長放緩的情況下,也能保持穩定的利潤率。整體而言,可充電電池產能的擴張以及由此帶來的學習曲線效應所導致的成本降低,正逐漸成為北美電池市場到2031年的主要成長引擎。
其他好處:
- Excel格式的市場預測(ME)表
- 3個月的分析師支持
目錄
第1章:引言
- 研究假設和市場定義
- 調查範圍
第2章:調查方法
第3章執行摘要
第4章 市場狀況
- 市場概覽
- 市場促進因素
- 由IRA提供資金支持的超級工廠的擴建正在降低電池組的成本。
- 鼓勵企業將生產轉移到國內以降低OEM公司的供應鏈風險
- 加州、紐約州、德克薩斯州和不列顛哥倫比亞省強制安裝大型儲能設施。
- 新興汽車製造商與電池製造商之間的合資企業正在提高資本效率。
- 電動車的日益普及導致平均電池容量增加(以及SUV比例增加),進而推動了銷售成長。
- 回收稅額扣抵可以降低處理舊產品的成本。
- 市場限制因素
- 由於中游製程(箔材、分離器)的瓶頸,生產擴張被推遲。
- 鋰價波動性加劇將擴大該專案的內部報酬率(IRR)。
- 中國對磷酸鐵鋰電池進口徵收關稅存在不確定性
- 新電池工廠技術純熟勞工短缺
- 供應鏈分析
- 監理情勢
- 技術展望
- 波特五力模型
- 價格分析
- 國際貿易分析
第5章 市場規模與成長預測
- 依電池類型
- 一次電池
- 輔助電池
- 透過技術
- 鉛酸
- Li-ion
- 鎳氫電池
- 鎳和鎘
- 鈉和硫
- 固態電池
- 液流電池
- 新興化學技術
- 透過使用
- 汽車(油電混合車、插電式混合動力車、電動車)
- 工業用途(移動式、固定式(通訊、UPS、ESS 等))
- 可攜式(家用電子電器等)
- 電動工具
- SLI
- 其他用途
- 按地區
- 美國
- 加拿大
- 墨西哥
第6章 競爭情勢
- 市場集中度
- 策略趨勢(併購、聯盟、購電協議)
- 市場佔有率分析(主要公司的市場排名和佔有率)
- 公司簡介
- LG Energy Solution
- Panasonic Energy Co.
- Tesla(Internal Cell Ops)
- Samsung SDI
- SK On
- BYD Co. Ltd.
- CATL
- Enersys
- Saft Groupe SA
- Duracell Inc.
- Johnson Controls Intl.
- Clarios
- Northvolt AB
- AESC(Envision)
- EVE Energy NA
- American Battery Factory
- Natron Energy
- 24M Technologies
- FREYR Battery
- Lyten Inc.
- BlueOval SK
第7章 市場機會與未來展望
According to Mordor Intelligence, the North America battery market size is projected to be USD 34.67 billion in 2025, USD 38.90 billion in 2026, and reach USD 74.08 billion by 2031, growing at a CAGR of 13.75% from 2026 to 2031.
This report is Segmented by Battery Type (Primary and Secondary), Technology (Lead-Acid, Li-Ion, Nickel-Metal Hydride, Nickel-Cadmium, Sodium-Sulfur, Solid-State, Flow Battery, and Emerging Chemistries), Application (Automotive, Industrial, Portable, Power Tools, SLI, and More), and Geography (United States, Canada, and Mexico). The Market Sizes and Forecasts are Provided in Terms of Value (USD).
North America Battery Market Trends and Insights
IRA-Fuelled Gigafactory Build-Out Compressing Pack Costs
Section 45X of the Inflation Reduction Act (IRA) provides USD 35 per kilowatt-hour for cells and USD 10 per kilowatt-hour for modules manufactured domestically, a structure that triggered USD 110 billion of announced battery investments across 13 states since 2022. BlueOval SK secured a USD 9.6 billion Department of Energy loan for twin plants in Kentucky and Tennessee, with the first line online in late 2025. Panasonic ramped its De Soto, Kansas, facility to 30 gigawatt-hours in 2025, while Samsung SDI and General Motors broke ground on an Indiana site targeting a 2026 start-up. These projects lower the breakeven utilization threshold from 80% to 60%, accelerating commissioning schedules and enabling a forecast 40% pack-cost decline from 2022 to 2027. As costs fall, total-cost-of-ownership parity between EVs and internal-combustion vehicles is expected as early as 2027, a full two years earlier than many OEMs originally modeled.
On-Shoring Incentives Reducing Supply-Chain Risk for OEMs
Automakers absorbed USD 2.3 billion of extra logistics costs during the 2021-2022 semiconductor crunch, prompting a pivot toward regional cell production that mitigates shipping disruptions and tariff exposure. The IRA's Foreign Entity of Concern provisions, effective January 2024, disqualify EVs from a USD 7,500 consumer credit if batteries or critical minerals come from Chinese or Russian entities, driving supplier re-mapping. Ultium Cells now runs three U.S. plants totaling 140 gigawatt-hours, trimming cell lead times from 12 to 4 weeks and lowering working-capital needs by about 20%. Stellantis and Samsung SDI followed with a USD 7.3 billion Kokomo facility that secures supply for full-size pickups. Together, these vertically integrated models insulate OEM programs from foreign-exchange swings and logistics bottlenecks, protecting margins during the EV ramp.
Lithium-Price Volatility Widening Project IRR Band
Spot lithium-carbonate prices plunged from USD 80,000 per metric ton in late 2022 to USD 12,000 by June 2024 before rebounding to USD 15,000 by December, a roller-coaster that injected a 12%-15% spread into battery-pack economics. General Motors' Thacker Pass joint venture aims to secure 40,000 metric tons annually by 2027, shielding 800,000 vehicles per year from spot swings. Yet project IRRs remain highly sensitive; sustained prices below USD 18,000 could extend paybacks beyond 10 years, delaying bank financing for mid-tier cell manufacturers. Smaller firms lacking captive lithium struggle to hit the 80% offtake threshold demanded by lenders, throttling greenfield builds and weighing on near-term capacity additions.
Other drivers and restraints analyzed in the detailed report include:
- Utility-Scale Storage Mandates in CA, NY, TX, BC
- EV-Driven Average Battery Size Increase (SUV Mix)
- Mid-Stream Bottlenecks (Foil, Separator) Delay Ramp-Ups
For complete list of drivers and restraints, kindly check the Table Of Contents.
Segment Analysis
Secondary rechargeable batteries accounted for 75.5% of the North America battery market share in 2025 and are projected to expand at a 15.5% CAGR to 2031. This growth trajectory reflects surging EV and stationary-storage deployments, both of which require high cycle life and multi-year warranties that favor lithium-ion chemistries. Average pack sizes in electric trucks rose to 78 kilowatt-hours in 2025, lifting cell demand per vehicle and hastening gigafactory utilization ramps. Primary cells, at 24.5% of revenue, grow at single-digit rates, limited to medical, defense, and IoT niches where multi-decade shelf life outweighs rechargeability. Consolidation trends differ by sub-segment; Duracell and Energizer maintain brand pull in consumer alkaline, whereas automotive OEMs increasingly insource lithium-ion, compressing margins for independent suppliers.
Unit economics are also diverging. Tesla's internal 4680 line hit a 10 gigawatt-hour run rate by September 2025, reducing per-kilowatt-hour costs 15% versus externally sourced 2170 cells and capturing upstream value that previously accrued to vendors. Small primary-battery suppliers benefited from a 12% rise in Department of Defense procurement in 2024, highlighting how performance-critical niches can still yield steady margins despite slower volume growth. Overall, rechargeable capacity additions and associated learning-curve cost declines are locked in as the principal engine of the North America battery market through 2031.
Complete Report Scope:
- By Battery Type
- Primary Batteries
- Secondary Batteries
- By Technology
- Lead-acid
- Li-ion
- Nickel-metal hydride
- Nickel-cadmium
- Sodium-sulfur
- Solid-state
- Flow Battery
- Emerging chemistries
- By Application
- Automotive (HEV, PHEV, and EV)
- Industrial (Motive, Stationary (Telecom, UPS, ESS), etc.)
- Portable (Consumer Electronics, etc.)
- Power Tools
- SLI
- Other Applications
- By Geography
- United States
- Canada
- Mexico
List of Companies Covered in this Report:
- LG Energy Solution
- Panasonic Energy Co.
- Tesla (Internal Cell Ops)
- Samsung SDI
- SK On
- BYD Co. Ltd.
- CATL
- Enersys
- Saft Groupe SA
- Duracell Inc.
- Johnson Controls Intl.
- Clarios
- Northvolt AB
- AESC (Envision)
- EVE Energy NA
- American Battery Factory
- Natron Energy
- 24M Technologies
- FREYR Battery
- Lyten Inc.
- BlueOval SK
Additional Benefits:
- The market estimate (ME) sheet in Excel format
- 3 months of analyst support
TABLE OF CONTENTS
1 Introduction
- 1.1 Study Assumptions & Market Definition
- 1.2 Scope of the Study
2 Research Methodology
3 Executive Summary
4 Market Landscape
- 4.1 Market Overview
- 4.2 Market Drivers
- 4.2.1 IRA-fuelled gigafactory build-out compressing pack costs
- 4.2.2 On-shoring incentives reducing supply-chain risk for OEMs
- 4.2.3 Utility-scale storage mandates in CA, NY, TX, BC
- 4.2.4 Emerging auto-maker-battery-maker JVs unlocking capital efficiency
- 4.2.5 EV-driven average battery size ↑ (SUV mix) creating volume pull
- 4.2.6 Recycling tax credits lowering end-of-life costs
- 4.3 Market Restraints
- 4.3.1 Mid-stream bottlenecks (foil, separator) delay ramp-ups
- 4.3.2 Lithium-price volatility widening project IRR band
- 4.3.3 Tariff uncertainty on Chinese LFP imports
- 4.3.4 Skilled-labour shortages at new cell plants
- 4.4 Supply-Chain Analysis
- 4.5 Regulatory Landscape
- 4.6 Technological Outlook
- 4.7 Porter's Five Forces
- 4.7.1 Bargaining Power of Suppliers
- 4.7.2 Bargaining Power of Buyers
- 4.7.3 Threat of New Entrants
- 4.7.4 Threat of Substitutes
- 4.7.5 Competitive Rivalry
- 4.8 Pricing Analysis
- 4.9 International Trade Analysis
5 Market Size & Growth Forecasts
- 5.1 By Battery Type
- 5.1.1 Primary Batteries
- 5.1.2 Secondary Batteries
- 5.2 By Technology
- 5.2.1 Lead-acid
- 5.2.2 Li-ion
- 5.2.3 Nickel-metal hydride
- 5.2.4 Nickel-cadmium
- 5.2.5 Sodium-sulfur
- 5.2.6 Solid-state
- 5.2.7 Flow Battery
- 5.2.8 Emerging chemistries
- 5.3 By Application
- 5.3.1 Automotive (HEV, PHEV, and EV)
- 5.3.2 Industrial (Motive, Stationary (Telecom, UPS, ESS), etc.)
- 5.3.3 Portable (Consumer Electronics, etc.)
- 5.3.4 Power Tools
- 5.3.5 SLI
- 5.3.6 Other Applications
- 5.4 By Geography
- 5.4.1 United States
- 5.4.2 Canada
- 5.4.3 Mexico
6 Competitive Landscape
- 6.1 Market Concentration
- 6.2 Strategic Moves (M&A, Partnerships, PPAs)
- 6.3 Market Share Analysis (Market Rank/Share for key companies)
- 6.4 Company Profiles (includes Global level Overview, Market level overview, Core Segments, Financials as available, Strategic Information, Products & Services, and Recent Developments)
- 6.4.1 LG Energy Solution
- 6.4.2 Panasonic Energy Co.
- 6.4.3 Tesla (Internal Cell Ops)
- 6.4.4 Samsung SDI
- 6.4.5 SK On
- 6.4.6 BYD Co. Ltd.
- 6.4.7 CATL
- 6.4.8 Enersys
- 6.4.9 Saft Groupe SA
- 6.4.10 Duracell Inc.
- 6.4.11 Johnson Controls Intl.
- 6.4.12 Clarios
- 6.4.13 Northvolt AB
- 6.4.14 AESC (Envision)
- 6.4.15 EVE Energy NA
- 6.4.16 American Battery Factory
- 6.4.17 Natron Energy
- 6.4.18 24M Technologies
- 6.4.19 FREYR Battery
- 6.4.20 Lyten Inc.
- 6.4.21 BlueOval SK
7 Market Opportunities & Future Outlook
- 7.1 White-space & Unmet-Need Assessment

 低功耗鋅碳電池市場:全球市場預測,2026-2032年
 免維護電池市場:按類型、應用、電池結構、國家和地區分類-全球產業分析、市場規模、市場佔有率及2026年至2033年預測主動式RFID電池市場:按電池類型、應用、最終用戶、技術、國家和地區分類-全球產業分析、市場規模、市場佔有率及2026年至2033年預測木質電池市場:依產品類型、應用、化學成分、材料、最終用戶、國家及地區分類-全球產業分析、市場規模、市場佔有率及2026年至2033年預測。
 印度逆變器電池:市場佔有率分析、產業趨勢與統計及成長預測(2026-2031)逆變器電池:市場佔有率分析、產業趨勢與統計、成長預測(2026-2031)逆變器電池補充液:市場佔有率分析、產業趨勢與統計、成長預測(2026-2031 年)
 2026-2030年全球電池市場中國電池市場:市場佔有率分析、產業趨勢與統計及成長預測(2026-2031年)印尼電池市場:市場佔有率分析、產業趨勢與統計及成長預測(2026-2031)