


 |
市場調查報告書
商品編碼
2100757
北美液氫市場:市場佔有率分析、產業趨勢與統計及成長預測(2026-2031)North America Liquid Hydrogen - Market Share Analysis, Industry Trends & Statistics, Growth Forecasts (2026 - 2031) |
||||||

※ 本網頁內容可能與最新版本有所差異。詳細情況請與我們聯繫。
根據 Mordor Intelligence 預測,北美液氫市場規模預計在 2026 年達到 136.79 千噸,到 2031 年達到 224.23 千噸,年複合成長率為 10.39%。
這項展望凸顯了市場的潛力,因為聯邦政府的獎勵和脫碳目標正在推動其應用從航太領域擴展到交通運輸和工業領域。
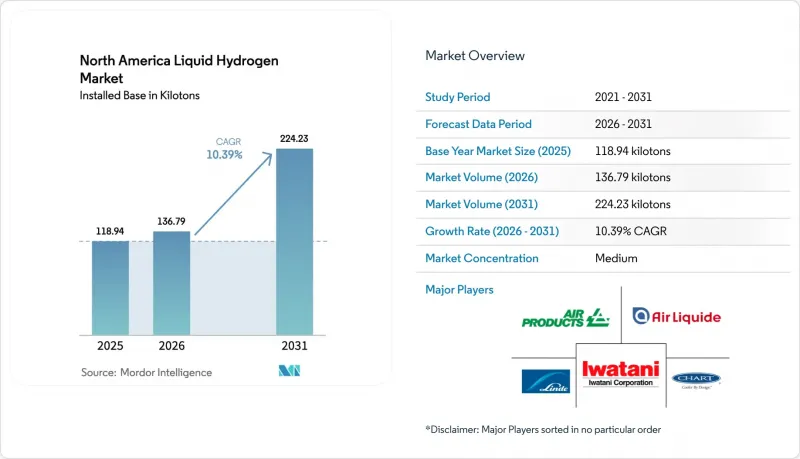
本報告按分銷方式(低溫儲罐和高壓管束拖車)、應用領域(汽車、航太(包括外太空)、工業、船舶、發電和儲能以及其他應用)和地區(美國、加拿大、墨西哥)進行細分。市場規模和預測以體積(千噸)為單位。
北美液氫市場趨勢及洞察
由美國能源局資助的氫能中心正在加速液化領域的投資。
2023年,七個區域清潔氫能中心獲得了70億美元的聯邦津貼,這些中心正在建造日產能50至100噸的液化工廠,將單位成本控制在每公斤2.50美元以下,並吸引了來自空氣產品公司、液化空氣集團和其他項目發起人的私人投資。交通運輸、工業和電力用戶之間的聯合承購協議降低了使用風險,使開發商能夠獲得長期貸款,並將專案投資回收期縮短至遠低於10年。在墨西哥灣墨西哥灣沿岸地區和加利福尼亞州的中心,與港口和管道基礎設施一體化的液化裝置建設已經啟動;而太平洋西北地區的中心則將基於可再生能源的電解與低溫儲存相結合,用於航太領域和跨境出口。區域專業化也最佳化了生產通路。 「藍色專案」部署在天然氣和碳封存資源豐富的地區,而「綠色專案」則部署在風能和太陽能成本最低的地區,從而最佳化了資本配置。由此形成的基礎設施網格結構將作為支撐持續生產、儲存和分銷網路的基礎,預計將降低供應成本,並加速向最初的利基市場以外的地區滲透。
擴大沿著 I-80 和 I-5 走廊的 8 級燃料電池卡車示範項目
加州「先進清潔車隊」法規強制要求自2024年起所有新型短程運輸卡車實現零排放,這促使車隊營運商大量訂購液氫卡車,這些卡車續航里程可達500-600英里,且不會降低負載容量。現代、尼古拉和沃爾沃已總合部署超過200輛重型燃料電池牽引車,這些卡車將從2024年起投入使用,並由不斷擴展的加氫站網路提供支持,這些加氫站供應低溫燃料,燃料在現場進行汽化和壓縮。加州能源委員會的一項1.5億美元津貼計畫將涵蓋高達50%的加氫站建設成本,從而降低零售商在應用範圍擴大時的風險。車隊營運商指出,與純電動卡車相比,液氫卡車在長途運輸路線上的主要優勢在於其快速的加氫時間和路線柔軟性。隨著加氫站密度的增加,汽車製造商預測,到2028年,液氫卡車的總擁有成本(TCO)將與柴油車持平,這將促進液氫卡車在西部和山區各州的更廣泛應用。
日蒸發損失3噸或以下的儲槽系統蒸發損失較高
小型儲存槽的表面積與體積比不利,導致每日排氣率高達1.5%至3.0%。對於每日處理量為一噸的用戶而言,這意味著150至300美元的產品損失,因此需要採取諸如回收壓縮機和主動式低溫冷卻器等成本高昂的措施。 NFPA 2 的安裝規範進一步加劇了在人口密集的工業園區內安裝的難度,要求排氣管與點火源至少保持25英尺的距離。雖然「零沸騰」先導計畫提供了潛在的解決方案,但其50萬至100萬美元的價格限制了其在關鍵任務型航太航太項目中的應用。在成本降低之前,高排氣率會削弱小規模用戶的商業價值,從而減緩其在細分工業市場的普及。
細分市場分析
儘管管式拖車的負載容量較低,但由於其初始投資較低且授權速度更快,其市場成長速度比低溫罐車更快。預計2026年至2031年間,該細分市場的複合年成長率將達到11.6%。隨著4型複合材料氣瓶的推出(可將拖車重量減輕40%),預計在200英里以下的運輸路線上,管式拖車與低溫運輸的交付差異將縮小至15%以下。低溫罐車在高運力運輸路線上仍然佔據主導地位。這是因為單輛罐車可運輸高達5噸的貨物(相當於約8輛管式拖車),從而提高了長途運輸的運轉率,並成為航太和煉油客戶的核心組成部分。物流業者正在10號州際公路進行自主車隊試驗,以解決司機短缺問題並最佳化甩掛運輸流程。預計這項策略將進一步擴大液氫市場中低溫罐車車隊的規模經濟效益。
對於日用氣量僅 100-300 公斤的車隊營運商,以及電子和食品加工行業(這些行業安裝現場汽化器的初始成本較高),管式拖車正日益受到青睞。經銷商將拖車和行動泵撬裝設備成套銷售,使客戶完全無需對儲存槽進行資本投資。這種「氣體即服務」模式降低了轉換門檻,並有助於將需求從易受經濟波動影響的航太領域分散開來。在整個預測期內,供應鏈對輕型氣瓶和大容量壓縮機的投資預計將進一步提高周轉率,並增加瞄準中等需求「黃金地帶」的經銷商的盈利。
其他福利
- Excel格式的市場預測(ME)表
- 3個月的分析師支持
目錄
第1章:引言
- 研究假設和市場定義
- 調查範圍
第2章:調查方法
第3章執行摘要
第4章 市場狀況
- 市場概覽
- 市場促進因素
- 由美國能源部資助的氫能中心正在加速液化領域的投資。
- 沿著 I-80 和 I-5 走廊擴大 8 級燃料電池卡車示範項目
- 聯邦 45V/45Q稅額扣抵能否縮短利用碳捕獲、利用與封存 (CCUS) 的 LH 投資的投資回收期?
- 西海岸港口強制「冷熨」的興起
- 超高隔熱微型散裝儲槽可為中小企業的設施提供液氫供應。
- 市場限制因素
- 此儲水系統每天可儲存 3 噸水,導致大量蒸發損失。
- 低溫儲罐的製造能力有限。
- 縣級危險物品運輸法規對LH卡車路線的影響
- 供應鏈分析
- 監理情勢
- 技術展望
- 波特五力模型
第5章 市場規模與成長預測
- 按發行格式
- 低溫儲罐
- 高壓管拖車
- 透過使用
- 車
- 航太(包括外太空)
- 產業
- 船
- 發電和儲能
- 其他
- 按地區
- 美國
- 加拿大
- 墨西哥
第6章 競爭情勢
- 市場集中度
- 策略趨勢
- 市佔率分析
- 公司簡介
- Air Liquide SA
- Air Products and Chemicals, Inc.
- Linde plc
- Air Water Inc.
- Iwatani Corporation
- Messer Group GmbH
- Engie SA
- Chart Industries Inc.
- Universal Industrial Gases, Inc.
- Plug Power Inc.
- Hexagon Composites ASA
- Kawasaki Heavy Industries, Ltd.
- Cryostar SAS
- INOX India Ltd(INOXCVA)
- Taylor-Wharton
- Gardner Cryogenics
- FIBA Technologies Inc.
- Wessington Cryogenics
- VRV SpA
- Hylium Industries Inc.
- CIMC ENRIC Holdings Ltd.
第7章 市場機會與未來展望
According to Mordor Intelligence, the liquid hydrogen market in North America measured 136.79 kilotons in 2026 and is projected to reach 224.23 kilotons by 2031, growing at a 10.39% CAGR; this outlook underscores the market size potential as federal incentives and decarbonization targets widen use beyond aerospace into transport and industrial segments.
This report is Segmented by Distribution (Cryogenic Tank and High-Pressure Tube Trailers), Application (Automotive, Aerospace-Including Outer Space, Industrial, Marine, Power Generation and Energy Storage, and Other Applications), and Geography (United States, Canada, and Mexico). The Market Sizes and Forecasts are Provided in Terms of Volume (Kilo Tons).
North America Liquid Hydrogen Market Trends and Insights
DOE-Funded Hydrogen Hubs Accelerate Liquefaction Investment
Seven regional clean hydrogen hubs awarded USD 7 billion in federal grants during 2023 are underwriting 50- to 100-ton-per-day liquefaction trains that reach sub-USD 2.50-per-kilogram unit costs and crowd-in private commitments from Air Products, Air Liquide, and other project sponsors. Off-take contracts pooled across transport, industrial, and power customers de-risk utilization and enable developers to secure long-term debt, shortening project payback windows to well under ten years. Gulf Coast and California hubs have already broken ground on liquefaction blocks tied to port and pipeline infrastructure, while the Pacific Northwest hub combines renewable electrolysis with cryogenic storage for aerospace and cross-border exports. Regional specialization also aligns production pathways, blue projects where natural gas and sequestration are abundant, green projects where wind or solar is cheapest, optimizing capital allocation. The resulting infrastructure lattice is expected to anchor contiguous networks of production, storage, and distribution that lower delivered costs and accelerate adoption beyond early niches.
Scale-Up of Class-8 Fuel-Cell Truck Pilots Along I-80 & I-5 Corridors
California's Advanced Clean Fleets regulation requires new drayage trucks to be zero-emission from 2024 onward, prompting fleet operators to place multi-year orders for liquid hydrogen trucks that deliver 500- to 600-mile range without payload penalties. Hyundai, Nikola, and Volvo have collectively deployed more than 200 heavy-duty fuel-cell tractors since 2024, supported by a growing network of refueling stations dispensing cryogenic fuel that is vaporized and compressed on site. The California Energy Commission's USD 150 million grant program covers up to 50% of station capex, lowering retailer risk during utilization ramp-up. Fleet operators cite rapid fueling times and route flexibility as principal advantages over battery-electric trucks on long-haul lanes. As station density improves, original equipment manufacturers anticipate cost parity with diesel on a total-cost-of-ownership basis by 2028, catalyzing broader adoption across Western and Mountain states.
High Boil-Off Losses for below 3 t/Day Storage Systems
Small storage tanks exhibit unfavorable surface-area-to-volume ratios that raise daily venting to 1.5%-3.0%, translating into USD 150-USD 300 lost product for a 1 t/day user and imposing costly mitigation requirements such as recovery compressors or active cryocoolers. NFPA 2 spacing rules further complicate installations in dense industrial parks, as vent stacks must lie at least 25 ft from ignition sources. However, zero-boil-off pilots promise relief, their USD 0.5-1.0 million price point reserves adoption for mission-critical aerospace programs. Until costs fall, high venting erodes the business case for small-scale users, slowing penetration in fragmented industrial niches.
Other drivers and restraints analyzed in the detailed report include:
- Federal 45V/45Q Tax Credits Compress Payback Periods for CCUS-Based LH2
- Emergence of "Cold Ironing" Mandates at West-Coast Ports
- Limited Availability of Cryogenic Tanker Manufacturing Capacity
For complete list of drivers and restraints, kindly check the Table Of Contents.
Segment Analysis
Tube trailers, although smaller in payload, are scaling faster than cryogenic tankers thanks to lower capital outlay and faster permitting. The segment is projected to post an 11.6% CAGR between 2026 and 2031, narrowing delivered-cost differentials with cryogenic supply to below 15% on hauls shorter than 200 miles, aided by Type 4 composite cylinders that shave trailer tare weight by 40%. Cryogenic tanks still dominate heavy-volume lanes because a single tanker carries up to 5 t, equivalent to roughly eight tube trailer loads, and achieves better utilization over long distances, making it the backbone for aerospace and refinery customers. Logistics operators are experimenting with autonomous convoys on Interstate 10 to offset driver shortages and optimize drop-and-hook cycles, a strategy expected to extend liquid hydrogen market size leadership for cryogenic fleets.
Tube trailer adoption is resonating among fleet operators that consume only 100-300 kg per day and among electronics and food processors, where on-site vaporizers inflate upfront costs. Distributors bundle trailers with mobile pumping skids, enabling customers to avoid storage tank capex entirely. This "gas-as-a-service" model reduces switching friction and diversifies demand away from cyclical aerospace volumes. Over the forecast horizon, supply chain investments in lightweight cylinders and high-capacity compressors will further improve asset turns, lifting profitability for distributors that target the mid-volume sweet spot.
Complete Report Scope:
- By Distribution
- Cryogenic Tank
- High-pressure Tube Trailers
- By Application
- Automotive
- Aerospace (Including Outer Space)
- Industrial
- Marine
- Power Generation and Energy Storage
- Other Applications
- By Geography
- United States
- Canada
- Mexico
List of Companies Covered in this Report:
- Air Liquide S.A.
- Air Products and Chemicals, Inc.
- Linde plc
- Air Water Inc.
- Iwatani Corporation
- Messer Group GmbH
- Engie SA
- Chart Industries Inc.
- Universal Industrial Gases, Inc.
- Plug Power Inc.
- Hexagon Composites ASA
- Kawasaki Heavy Industries, Ltd.
- Cryostar SAS
- INOX India Ltd (INOXCVA)
- Taylor-Wharton
- Gardner Cryogenics
- FIBA Technologies Inc.
- Wessington Cryogenics
- VRV S.p.A.
- Hylium Industries Inc.
- CIMC ENRIC Holdings Ltd.
Additional Benefits:
- The market estimate (ME) sheet in Excel format
- 3 months of analyst support
TABLE OF CONTENTS
1 Introduction
- 1.1 Study Assumptions & Market Definition
- 1.2 Scope of the Study
2 Research Methodology
3 Executive Summary
4 Market Landscape
- 4.1 Market Overview
- 4.2 Market Drivers
- 4.2.1 DOE-funded hydrogen hubs accelerate liquefaction investment
- 4.2.2 Scale-up of Class-8 fuel-cell truck pilots along I-80 & I-5 corridors
- 4.2.3 Federal 45V/45Q tax credits compress payback periods for CCUS-based LH?
- 4.2.4 Emergence of "cold ironing" mandates at West-Coast ports
- 4.2.5 Super-insulated micro-bulk tanks enabling LH2 deliveries to SME sites
- 4.3 Market Restraints
- 4.3.1 High boil-off losses for <3-t/day storage systems
- 4.3.2 Limited availability of cryogenic tanker manufacturing capacity
- 4.3.3 County-level hazmat restrictions on LH? trucking routes
- 4.4 Supply-Chain Analysis
- 4.5 Regulatory Landscape
- 4.6 Technological Outlook
- 4.7 Porter's Five Forces
- 4.7.1 Bargaining Power of Suppliers
- 4.7.2 Bargaining Power of Consumers
- 4.7.3 Threat of New Entrants
- 4.7.4 Threat of Substitute Products & Services
- 4.7.5 Intensity of Competitive Rivalry
5 Market Size & Growth Forecasts
- 5.1 By Distribution
- 5.1.1 Cryogenic Tank
- 5.1.2 High-pressure Tube Trailers
- 5.2 By Application
- 5.2.1 Automotive
- 5.2.2 Aerospace (Including Outer Space)
- 5.2.3 Industrial
- 5.2.4 Marine
- 5.2.5 Power Generation and Energy Storage
- 5.2.6 Other Applications
- 5.3 By Geography
- 5.3.1 United States
- 5.3.2 Canada
- 5.3.3 Mexico
6 Competitive Landscape
- 6.1 Market Concentration
- 6.2 Strategic Moves
- 6.3 Market Share Analysis
- 6.4 Company Profiles (includes Global level Overview, Market level overview, Core Segments, Financials as available, Strategic Information, Market Rank/Share for key companies, Products & Services, and Recent Developments)
- 6.4.1 Air Liquide S.A.
- 6.4.2 Air Products and Chemicals, Inc.
- 6.4.3 Linde plc
- 6.4.4 Air Water Inc.
- 6.4.5 Iwatani Corporation
- 6.4.6 Messer Group GmbH
- 6.4.7 Engie SA
- 6.4.8 Chart Industries Inc.
- 6.4.9 Universal Industrial Gases, Inc.
- 6.4.10 Plug Power Inc.
- 6.4.11 Hexagon Composites ASA
- 6.4.12 Kawasaki Heavy Industries, Ltd.
- 6.4.13 Cryostar SAS
- 6.4.14 INOX India Ltd (INOXCVA)
- 6.4.15 Taylor-Wharton
- 6.4.16 Gardner Cryogenics
- 6.4.17 FIBA Technologies Inc.
- 6.4.18 Wessington Cryogenics
- 6.4.19 VRV S.p.A.
- 6.4.20 Hylium Industries Inc.
- 6.4.21 CIMC ENRIC Holdings Ltd.
7 Market Opportunities & Future Outlook
- 7.1 White-space & Unmet-Need Assessment

 2026-2034年全球電解氫市場規模、佔有率、趨勢和成長分析報告全球液氫市場規模、佔有率、趨勢和成長分析報告(2026-2034年)
 液氫:市場佔有率分析、產業趨勢與統計、成長預測(2026-2031)
 2026 年至 2035 年電解氫的市場機會、成長要素、產業趨勢與預測。液氫市場:商業機會、成長要素、產業趨勢分析及2026-2035年預測
 液氫市場規模、佔有率和趨勢分析報告:按生產方法、分銷方法、地區和細分市場預測(2026-2033 年)
 化學液氫市場規模、佔有率和成長分析:按純度、製造方法、儲存類型、應用、最終用戶和地區分類-2026-2033年產業預測
 液氫市場規模、佔有率及成長分析(依生產方式、分銷方式、終端用戶產業及地區分類)-2026-2033年產業預測
 全球煤炭氣化液氫市場全球電解液氫市場