


 |
市場調查報告書
商品編碼
2100614
南美洲廢棄物管理:市場佔有率分析、產業趨勢與統計及成長預測(2026-2031 年)South America Waste Management - Market Share Analysis, Industry Trends & Statistics, Growth Forecasts (2026 - 2031) |
||||||

※ 本網頁內容可能與最新版本有所差異。詳細情況請與我們聯繫。
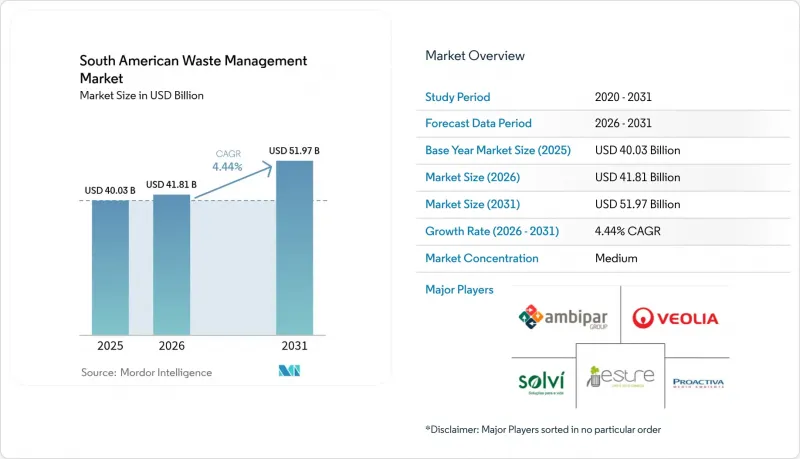
據 Mordor Intelligence 稱,2025 年南美洲廢棄物管理市場價值為 400.3 億美元,預計到 2031 年將達到 519.7 億美元,而 2026 年為 418.1 億美元,預測期(2026-2031 年)的複合年成長率為 4.4%。
本報告按來源(住宅、商業、工業等)、服務類型(收集、運輸、分類等)、廢棄物類型(城市固態廢棄物、工業危險廢棄物、電子廢棄物等)和地區(巴西、阿根廷、智利、哥倫比亞、秘魯及其他南美國家)進行細分。市場預測以美元計價。
南美洲廢棄物管理市場趨勢與洞察
在巴西、智利和哥倫比亞實施生產者延伸責任制(EPR)
巴西第12688號法令規定,到2026年,塑膠包裝的回收率必須達到32%,再生材料含量必須達到22%,並敦促品牌所有者為逆向物流系統提供資金。智利第20920號法律將於2023年全面實施,而哥倫比亞第1407號決議仍在建立生產者責任組織的過程中,導致整合工作延遲兩年。能夠熟練管理多個合規體系的本地企業在分類合約方面享有先發優勢。巴西的公共投資計畫已撥款1.26億美元用於正規的廢棄物收集合作社組織,以減少因收集路線使用權而引發的爭議。生產者責任制(EPR)的中期影響源自於收費和基礎設施部署之間的時間滯後。
COP30 之後循環經濟基礎設施領域的外國投資
貝倫作為COP30的東道城市,獲得了「全球甲烷中心」提供的1000萬美元津貼,用於建造一座市政堆肥廠。這充分體現了氣候外交如何引導資金流向與廢棄物相關的項目。巴西生態投資公司(EcoInvest Brazil)籌集了135億美元用於建造厭氧消化池和資源回收設施,此外,巴西國家經濟社會發展銀行(BNDES)也承諾為聖保羅的一個項目提供4.32億美元的資金。新投資者青睞生物甲烷,因為生物甲烷還附帶CBIO脫碳證書,但自2023年違約以來,證書價格的波動帶來了不確定性。由於建設週期通常為兩到四年,這些資金將推動巴西亞馬遜地區及鄰近安地斯山脈市場在2020年代中期之前提升處理能力。
一個持續存在的非官方收集網路
在利馬,非正規垃圾收集者處理了40%的廢棄物,擾亂了既定的垃圾收集路線,並減少了合約運輸商的負載容量。在波哥大,15,000名垃圾收集者擁有受法院保護的進入許可權,這使得費用談判和服務品質評估指標變得複雜。巴西已撥款1.26億美元用於整合合作社,但進展並不均衡。雖然聖保羅已簽署了多年期協議,但位於里約熱內盧貧民窟的合作社仍被排除在生產者延伸責任制(EPR)框架之外。在與合作社達成協議、開展培訓以及改進垃圾桶標準之前,這項限制對市場造成了沉重打擊,而這通常需要30到36個月的時間。
細分市場分析
到2025年,住宅廢棄物將佔南美洲廢棄物管理市場的55.39%。這主要是由於聖保羅、布宜諾斯艾利斯和波哥大等人口稠密的大都會圈,路邊垃圾收集點堆積如山。同時,商業廢棄物的流量預計到2031年將以6.19%的複合年成長率成長,成為所有廢棄物來源中成長最高的。這主要得益於麥德林、庫里蒂巴和瓜亞基爾等城市零售商店和辦公大樓密度的增加,以及商店租賃協議中納入了垃圾分類義務。位於超級市場和購物中心的生產者責任(EPR)物流中心將紙板和塑膠直接運送給生產者責任組織,縮短了運輸距離,並將打包價格提高了15%。隨著採礦業和農產品採用閉合迴路目標,工業部門的垃圾量也逐漸增加。例如,淡水河谷在2024年回收了1,270萬噸廢棄物,將其轉化為寶貴資源。
商業領域的快速成長正迫使運輸商重新評估南美洲的廢棄物管理市場規模。長期以來,運輸商一直優先考慮住宅的密集程度,以便進行挨家挨戶的垃圾收集。二線城市的特許經營協議正在重新競標,源頭分類車輛和銷售點收集亭的價值更高。過去,生鮮市場周圍的紙板主要由非正規收集者收集,但新的特許經營經營商正在向合作社支付費用,由合作社向生產者責任延伸(EPR)分揀設施供應紙板包,這是雙方共存的早期徵兆。在智利的銅礦帶和巴西米納斯吉拉斯州的礦區,專門回收廢棄輪胎和試劑桶的回收商的競標日益增多,這增強了工業層面的收入來源,提供了高於平均水平的利潤率,並能對沖掩埋的壓力。
其他好處:
- Excel格式的市場預測(ME)表
- 3個月的分析師支持
目錄
第1章:引言
- 研究的先決條件
- 調查範圍
第2章:調查方法
第3章執行摘要
第4章 市場狀況
- 市場概覽
- 市場促進因素
- 在巴西、智利和哥倫比亞實施生產者延伸責任制(EPR)
- COP30 之後循環經濟基礎設施領域的外國投資
- 禁止在都市區掩埋處置有機物,促進了堆肥和廢棄物發電(WtE)。
- 礦業和農產品企業公司零廢棄物目標
- 「鋰三角」地區的鋰離子電池回收走廊
- 利用人工智慧/物聯網最佳化路線,降低收集業務的營運成本(OPEX)。
- 市場限制因素
- 一個持續存在的非正式收集網路
- 由於財政緊縮措施,地方政府的資本投資受到抑制。
- 跨境非法傾倒電子廢棄物給執法部門帶來了巨大壓力。
- 碳權價格的波動正在削弱垃圾焚化發電(WtE) 專案的資金籌措。
- 價值供應鏈分析
- 監理情勢
- 技術展望
- 產業吸引力—五力分析
- 新進入者的威脅
- 供應商的議價能力
- 買方的議價能力
- 替代品的威脅
- 競爭公司之間的競爭
- 對物流基礎設施的洞察
- 創業策略與創業融資
第5章 市場規模與成長預測
- 來源
- 住宅
- 商業設施(零售、辦公室等)
- 產業
- 醫療保健(健康和藥品)
- 建設與拆除
- 其他(組織、農業等)
- 按服務類型
- 收集、運輸、分類和分離
- 處置/處理
- 掩埋處置
- 回收和資源回收
- 焚燒和垃圾焚化發電
- 其他(化學處理、堆肥等)
- 其他服務(諮詢、審計、訓練等)
- 廢棄物類型
- 一般廢棄物
- 工業用危險廢棄物
- 電子廢棄物
- 塑膠廢棄物
- 醫療廢棄物
- 建築和拆除廢棄物
- 農業廢棄物
- 其他特殊廢棄物(例如放射性廢棄物)
- 按地區
- 巴西
- 阿根廷
- 智利
- 哥倫比亞
- 秘魯
- 其他南美國家
第6章 競爭情勢
- 市場集中度
- 策略趨勢
- 市佔率分析
- 公司簡介
- Veolia Latin America
- Estre Ambiental
- Grupo Solvi
- Ambipar
- Proactiva Medio Ambiente
- Waste Management Inc.
- Republic Services Inc.
- Casella Waste Systems
- Covanta Holding Corporation
- Inciner8 Ltd
- SWM Colombia
- Capitao Ambiental
- Entorno Sustentable
- Syngas do Brasil
- Usina Verde
- Bioelektra
- Estaciones Ecologicas
- Solvi Essencis
- Reciclar SA
- TRASHCo Peru
第7章 市場機會與未來展望
According to Mordor Intelligence, the South America waste management market size was valued at USD 40.03 billion in 2025 and estimated to grow from USD 41.81 billion in 2026 to reach USD 51.97 billion by 2031, at a CAGR of 4.44% during the forecast period (2026-2031).
This report is Segmented by Source (Residential, Commercial, Industrial, and More), by Service Type (Collection, Transportation, Sorting & Segregation, and More), by Waste Type (Municipal Solid, Industrial Hazardous Waste, E-Waste, and More), and Geography (Brazil, Argentina, Chile, Colombia, Peru, and the Rest of South America). The Market Forecasts are Provided in Terms of Value (USD).
South America Waste Management Market Trends and Insights
Extended Producer Responsibility Rollout Across Brazil, Chile and Colombia
Brazil's Decree 12,688 obliges 32% recovery of plastic packaging by 2026 and requires 22% recycled content, compelling brand owners to fund reverse-logistics systems. Chile's Law 20.920 has been fully operational since 2023, while Colombia's Resolution 1407 is still building producer-responsibility organizations, leaving a two-year integration gap. Regional players that can navigate multiple compliance regimes enjoy early-mover advantages in sorting contracts. Brazil's public-investment program has allocated USD 126 million to formalize waste-picker cooperatives, reducing route-access conflicts. EPR's medium-term impact stems from the lag between fee collection and infrastructure rollout.
Post-COP30 Foreign Investment in Circular-Economy Infrastructure
Belem's role as COP30 host unlocked a USD 10 million Global Methane Hub grant for a municipal composting plant, illustrating how climate diplomacy reroutes finance toward waste assets. Eco Invest Brasil mobilized USD 13.5 billion for anaerobic digesters and material-recovery facilities, complemented by a USD 432 million commitment from BNDES for Sao Paulo projects. New investors favor biomethane, which also earns CBIO decarbonization certificates, although certificate price swings after 2023 defaults inject uncertainty. With a typical 2-4 year build cycle, these funds translate into mid-decade capacity growth across Brazil's Amazon states and adjoining Andean markets.
Entrenched Informal Collection Networks
Informal pickers manage 40% of Lima's waste, disrupting planned routes and reducing contracted haulers' payloads. Bogota's 15,000 pickers enjoy court-protected access rights, complicating tariff negotiations and quality-of-service metrics. Brazil earmarked USD 126 million to integrate cooperatives, yet uptake differs: Sao Paulo signed multi-year contracts, while Rio de Janeiro's favela-based groups remain outside EPR loops. The restraint weighs on the market until cooperative agreements, training and bin-standard upgrades mature, typically taking 30-36 months.
Other drivers and restraints analyzed in the detailed report include:
- Urban Organics-to-Landfill Bans Stimulating Composting and WtE
- Corporate Zero-Waste Targets in Mining & Agribusiness
- Fiscal Austerity Limiting Municipal CAPEX
For complete list of drivers and restraints, kindly check the Table Of Contents.
Segment Analysis
Residential generators delivered 55.39% of the South America Waste Management Market share in 2025 as densely populated metros such as Sao Paulo, Buenos Aires and Bogota filled curbside routes with municipal solid waste. Commercial streams, however, are on course for a 6.19% CAGR through 2031, the highest across sources, thanks to retail and office densification in Medellin, Curitiba and Guayaquil and to segregation mandates now embedded in storefront leases. EPR logistics hubs inside supermarkets and shopping malls are funneling cardboard and plastics directly to producer-responsibility organizations, trimming haul distances and boosting bale prices by up to 15%. Industrial players add volume more gradually as mining and agribusiness adopt closed-loop targets; Vale, for example, recaptured 12.7 million tonnes of waste-to-value material in 2024.
The commercial segment's swift climb recalibrates the South America Waste Management Market size calculus for haulers that long prioritized door-to-door residential density. Franchise contracts in second-tier cities are being rebid with higher scores for source-separated collection vehicles and point-of-sale take-back kiosks. Because informal pickers historically controlled cardboard around wet-markets, new concessionaires are paying cooperatives to supply bales to EPR sorters, an early sign of coexistence. Mining sites in the Chilean copper belt and Brazil's Minas Gerais increasingly tender specialty recyclers for scrap tires and reagent drums, reinforcing an industrial-grade revenue stream that carries above-average margins and hedges landfill-fee pressure.
Complete Report Scope:
- By Source
- Residential
- Commercial (retail, office, etc.)
- Industrial
- Medical (Health and Pharmaceutical)
- Construction & Demolition
- Others (institutional, agricultural, etc)
- By Service Type
- Collection, Transportation, Sorting & Segregation
- Disposal / Treatment
- Landfill
- Recycling & Resource Recovery
- Incineration & Waste-to-Energy
- Others (Chemical Treatment, Composting, etc.)
- Others (Consulting, Audit & Training, etc.)
- By Waste Type
- Municipal Solid Waste
- Industrial Hazardous Waste
- E-waste
- Plastic Waste
- Biomedical Waste
- Construction & Demolition Waste
- Agricultural Waste
- Other Specialized Waste (radio active, etc)
- By Geography
- Brazil
- Argentina
- Chile
- Colombia
- Peru
- Rest of South America
List of Companies Covered in this Report:
- Veolia Latin America
- Estre Ambiental
- Grupo Solvi
- Ambipar
- Proactiva Medio Ambiente
- Waste Management Inc.
- Republic Services Inc.
- Casella Waste Systems
- Covanta Holding Corporation
- Inciner8 Ltd
- SWM Colombia
- Capitao Ambiental
- Entorno Sustentable
- Syngas do Brasil
- Usina Verde
- Bioelektra
- Estaciones Ecologicas
- Solvi Essencis
- Reciclar S.A.
- TRASHCo Peru
Additional Benefits:
- The market estimate (ME) sheet in Excel format
- 3 months of analyst support
TABLE OF CONTENTS
1 Introduction
- 1.1 Study Assumptions
- 1.2 Scope of the Study
2 Research Methodology
3 Executive Summary
4 Market Landscape
- 4.1 Market Overview
- 4.2 Market Drivers
- 4.2.1 Extended Producer Responsibility rollout across Brazil, Chile, Colombia
- 4.2.2 Post-COP30 foreign investment in circular-economy infrastructure
- 4.2.3 Urban organics-to-landfill bans stimulating composting & WtE
- 4.2.4 Corporate zero-waste targets in mining & agribusiness
- 4.2.5 Lithium-ion battery recycling corridors in Lithium Triangle
- 4.2.6 AI/IoT route optimization reducing collection OPEX
- 4.3 Market Restraints
- 4.3.1 Entrenched informal collection networks
- 4.3.2 Fiscal austerity limiting municipal CAPEX
- 4.3.3 Cross-border e-waste dumping strains enforcement capacity
- 4.3.4 Volatile carbon-credit prices weaken WtE financing
- 4.4 Value / Supply-Chain Analysis
- 4.5 Regulatory Landscape
- 4.6 Technological Outlook
- 4.7 Industry Attractiveness - Porter's Five Force Analysis
- 4.7.1 Threat of New Entrants
- 4.7.2 Bargaining Power of Suppliers
- 4.7.3 Bargaining Power of Buyers
- 4.7.4 Threat of Substitutes
- 4.7.5 Intensity of Competitive Rivalry
- 4.8 Logistics Infrastructure Insights
- 4.9 Startup Strategies & Venture Funding
5 Market Size & Growth Forecasts (Values, In USD Billion)
- 5.1 By Source
- 5.1.1 Residential
- 5.1.2 Commercial (retail, office, etc.)
- 5.1.3 Industrial
- 5.1.4 Medical (Health and Pharmaceutical)
- 5.1.5 Construction & Demolition
- 5.1.6 Others (institutional, agricultural, etc)
- 5.2 By Service Type
- 5.2.1 Collection, Transportation, Sorting & Segregation
- 5.2.2 Disposal / Treatment
- 5.2.2.1 Landfill
- 5.2.2.2 Recycling & Resource Recovery
- 5.2.2.3 Incineration & Waste-to-Energy
- 5.2.2.4 Others (Chemical Treatment, Composting, etc.)
- 5.2.3 Others (Consulting, Audit & Training, etc.)
- 5.3 By Waste Type
- 5.3.1 Municipal Solid Waste
- 5.3.2 Industrial Hazardous Waste
- 5.3.3 E-waste
- 5.3.4 Plastic Waste
- 5.3.5 Biomedical Waste
- 5.3.6 Construction & Demolition Waste
- 5.3.7 Agricultural Waste
- 5.3.8 Other Specialized Waste (radio active, etc)
- 5.4 By Geography
- 5.4.1 Brazil
- 5.4.2 Argentina
- 5.4.3 Chile
- 5.4.4 Colombia
- 5.4.5 Peru
- 5.4.6 Rest of South America
6 Competitive Landscape
- 6.1 Market Concentration
- 6.2 Strategic Moves
- 6.3 Market Share Analysis
- 6.4 Company Profiles (includes Global level Overview, Market level overview, Core Segments, Financials as available, Strategic Information, Products & Services, Recent Developments)
- 6.4.1 Veolia Latin America
- 6.4.2 Estre Ambiental
- 6.4.3 Grupo Solvi
- 6.4.4 Ambipar
- 6.4.5 Proactiva Medio Ambiente
- 6.4.6 Waste Management Inc.
- 6.4.7 Republic Services Inc.
- 6.4.8 Casella Waste Systems
- 6.4.9 Covanta Holding Corporation
- 6.4.10 Inciner8 Ltd
- 6.4.11 SWM Colombia
- 6.4.12 Capitao Ambiental
- 6.4.13 Entorno Sustentable
- 6.4.14 Syngas do Brasil
- 6.4.15 Usina Verde
- 6.4.16 Bioelektra
- 6.4.17 Estaciones Ecologicas
- 6.4.18 Solvi Essencis
- 6.4.19 Reciclar S.A.
- 6.4.20 TRASHCo Peru
7 Market Opportunities & Future Outlook
- 7.1 White-space & Unmet-need Assessment

 2034年碳效率製造解決方案市場預測:按解決方案類型、技術、應用、部署模式、最終用戶和地區分類的全球分析
 2026-2030年全球廢棄物管理市場
 零廢棄採礦市場規模、佔有率和趨勢分析報告:按技術、礦山、地區和細分市場分類(2026-2033 年)
 PFAS廢棄物管理、修復和分解:市場佔有率分析、行業趨勢和統計數據以及成長預測(2026-2031年)紡織廢棄物管理:市場佔有率分析、產業趨勢與統計、成長預測(2026-2031)
 2026-2030年全球建築廢棄物管理市場
 廢棄物管理市場規模、佔有率、成長、全球產業分析、區域趨勢及2026-2034年預測中國廢棄物管理:市場佔有率分析、產業趨勢與統計、成長預測(2026-2031)印度廢棄物管理:市場佔有率分析、產業趨勢與統計及成長預測(2026-2031)新加坡廢棄物管理:市場佔有率分析、產業趨勢與統計及成長預測(2026-2031)