


 |
市場調查報告書
商品編碼
2100563
碳纖維:市場佔有率分析、產業趨勢與統計、成長預測(2026-2031)Carbon Fiber - Market Share Analysis, Industry Trends & Statistics, Growth Forecasts (2026 - 2031) |
||||||

※ 本網頁內容可能與最新版本有所差異。詳細情況請與我們聯繫。
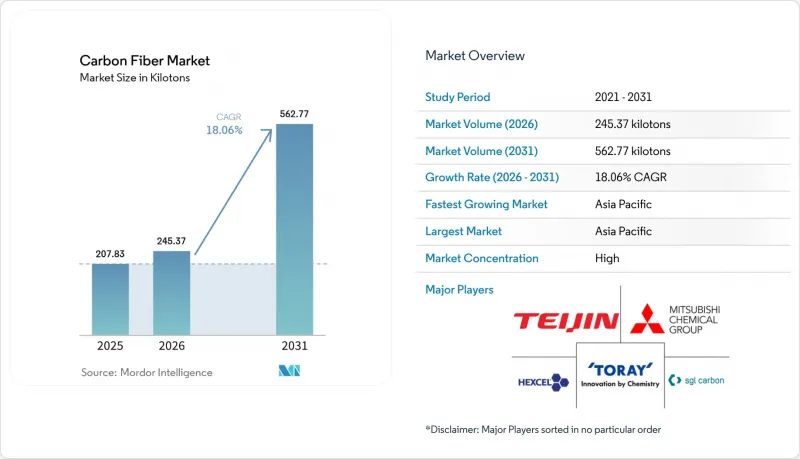
預計碳纖維市場將從 2025 年的 207.83 千噸成長到 2026 年的 245.37 千噸,然後從 2026 年到 2031 年以 18.06% 的複合年成長,到 2031 年達到 562.77 千噸成長率。
本報告按原料(聚丙烯腈、石油瀝青、人造絲)、纖維類型(原生碳纖維、再生碳纖維、其他)、應用(複合材料、紡織品等)、終端用戶產業(航太與國防、替代能源等)和地區(亞太地區、北美地區等)進行細分。市場預測以噸為單位。
全球碳纖維市場趨勢及洞察
增加用於商業交通運輸的氫氣和壓縮天然氣壓力容器的產量。
第四類儲槽(Type IV ceal)採用碳纖維包覆聚合物內襯,目前正逐漸成為燃料電池卡車、巴士和火車的標準700巴儲罐,推動了碳纖維市場佔有率的擴大。福伊特(Voith)的「Carbon4Tank」儲槽已通過聯合國歐洲經濟委員會(UNECE)134號法規的爆破壓力測試,爆破壓力超過1050巴,目前已開始在歐洲為重型車輛進行批量生產。根據美國能源局估計,由於纏繞成型製程的自動化和前驅物價格的穩定,預計到2024年,每度電的成本將從2020年的18美元降至12.70美元。盧克斯法(Luxfar)和海克斯康普拉斯(Hexagon Puras)已擴大了在製造地。每個儲槽包含25-30公斤的碳纖維,與鋼製儲槽相比,其負載容量提高了8-12%。 ISO 11119 和 DOT FMVSS 304 的疲勞測試要求超過 15,000 次循環,凸顯了鋁襯裡儲槽的可靠性優勢。對於車隊營運商而言,儲罐重量的減輕降低了全生命週期成本,從而加速了其在長途運輸路線上的商業性應用。
快速部署需要高強度葉片的離岸風力發電機
11-22兆瓦級的下一代風力發電機組採用100-143公尺長的葉片,其葉片帽的抗張強度需超過4800兆帕。西門子歌美颯的B108風力發電機組透過整合碳纖維翼梁,將葉片品質降低了20%,從而降低了塔頂負載和安裝成本。明陽智慧能源為其18兆瓦平台設計的143公尺長葉片使用了15-18噸碳纖維,僅離岸風力發電機組的葉片年需求量就約為5萬噸。在歐洲,預計2024年將新增4.2吉瓦的離岸發電裝置容量,葉片的碳纖維含量已從2020年的15%上升至25-30%。在台灣和日本,颱風多發海域正在部署浮體式平台,在這些海域,碳複合材料的循環疲勞強度比玻璃纖維高出30-40%。預計這些因素將確保未來幾年亞洲和歐洲沿海地區對結構複合材料的需求保持強勁。
能耗高的氧化和碳化過程
生產一公斤碳纖維需要消耗50-100千瓦時的電力,並排放20-30公斤二氧化碳。這相當於鋁擠型的五倍,對碳纖維產業構成了嚴峻挑戰。隨著歐洲電價在2024-2025年上漲至每千瓦時0.15-0.25歐元,碳纖維的生產成本每公斤增加了5-8美元,進一步拉大了與使用低成本煤炭作為能源的亞洲供應商之間的差距。東麗公司計劃在2030年,透過在其匈牙利工廠利用可再生能源和餘熱回收技術,將絕對排放量減少30%,但其碳化爐的能耗仍然很高。三菱化學公司正在進行低溫聚丙烯腈(PAN)的試生產,該製程可將能耗降低15-20%,但商業化仍需兩到三年時間。客戶現在要求紡織品製造商根據 ISO 14025 提交環境產品聲明 (EPD),目標是讓紡織品製造商投資約 5 億美元,到 2030 年實現每公斤紡織品二氧化碳排放量低於 15 公斤的目標。
細分市場分析
預計到2025年,聚丙烯腈(PAN)將佔碳纖維總產量的95.18%,並在預測期內以18.91%的複合年成長率成長。其高碳化率使其平均成本保持在每公斤12-14美元左右,即使計入能源附加費,這也有助於碳纖維市場抵禦熱塑性塑膠的替代衝擊。 2024年至2025年期間的供應緊張導致PAN現貨價格上漲至每公斤8-10美元,迫使一些加工商在其汽車合約中援引不可抗力條款。中國的吉林化工和藍星控制著全球高達70%的前驅產能,使亞太地區在全球定價上具有競爭優勢。
微波輔助氧化試驗計畫顯示,循環時間縮短了25-30%,能耗降低了15-20%,預計從2028年起結構成本將降低。瀝青和人造絲雖然仍屬於小眾產品,但它們對於超高模量太空船結構和模量超過800 GPa的隔熱材料至關重要。曉星集團4000噸產能的擴建及其生物基丙烯腈專案預計將減少30-40%的生命週期排放量,符合原始設備製造商(OEM)的淨零排放目標。聚丙烯腈(PAN)基碳纖維的市場規模預計將與丙烯腈的供應密切相關。山東和江蘇兩省的長期停產可能會在九個月內對整個價值鏈產生影響。
即使到了2025年,原生碳纖維仍將維持62.95%的市場佔有率,佔據碳纖維市場最大佔有率,主要用於航太和國防項目,這些項目對批次可追溯性和機械精度要求極高。受汽車和風電行業需求的推動,預計到2031年,再生碳纖維的供應量將以19.87%的複合年成長率成長,但預計在2026年計劃期內,再生碳纖維無法獲得作為主要結構部件的認證。
ELG碳纖維可從航太廢料中回收90-95%的原生材料強度,使座椅框架和頂置儲物架的製造成本降低30-50%。 Karborek的溶劑分解法可保留長度超過80毫米的纖維,但需要處理溶劑廢棄物,這會增加營運成本。 Gen 2 Carbon實現了熱塑性零件的循環回收,隨著電動車電池托盤產量的增加,這成為關鍵的差異化優勢。從2027年起,隨著風力渦輪機葉片的拆卸速度加快以及穩定的原料供應得到保障,再生碳纖維的市場佔有率預計將進一步擴大。
區域分析
預計到2025年,亞太地區將以44.89%的市佔率引領碳纖維市場,並在2031年之前維持20.75%的複合年成長率。中國從前驅體到纖維的垂直整合供應鏈、日本的航太級特種產品以及印度的碳抵消政策,共同確保了該地區強勁的需求。台灣4.5吉瓦的離岸風力發電裝置容量和韓國的汽車零件供應商也為成長提供了進一步的輔助。低廉的電價和自給自足的丙烯腈供應鏈進一步鞏固了該地區的成本優勢。
北美碳纖維產量位居全球第二,美國碳纖維市場受益於波音和洛克希德馬丁等公司的推動,以及與《通貨膨脹控制法案》相關的電動車(BEV)計畫。東麗公司位於南卡羅來納州的5000噸生產線主要生產汽車級碳纖維,而海克塞爾公司在鹽湖城的擴建項目則為波音787和空中巴士A350飛機提供機翼翼梁。華盛頓州和緬因州的再生纖維網路為一級汽車內裝零件供應商提供原料,這不僅促進了國內循環經濟的發展,也增強了區域碳纖維產業的實力。
在歐洲,離岸風力發電、嚴格的車輛排放氣體法規以及空中巴士飛機結構部件共同作用,在能源價格波動的情況下維持高運轉率。西門子歌美颯的葉片採用了碳纖維齒輪帽,可減輕20%的重量。德國汽車製造商依賴SGL Carbon位於梅廷根的工廠生產的熱塑性複合材料,來實現其95克/公里的二氧化碳排放目標。歐盟的《基本原料法》鼓勵加強國內生產能力,而東麗位於匈牙利的工廠目前正透過從可再生能源獲取電力並減少30%的生命週期排放量,為區域碳纖維產業提供支持。
其他好處:
- Excel格式的市場預測(ME)表
- 3個月的分析師支持
目錄
第1章:引言
- 研究假設和市場定義
- 調查範圍
第2章:調查方法
第3章執行摘要
第4章 市場狀況
- 市場概覽
- 市場促進因素
- 增加用於商業交通運輸的氫氣和壓縮天然氣壓力容器的產量。
- 離岸風力發電的快速發展需要高強度葉片。
- 電動車平台中電池組機殼的採用和重量減輕
- 3D自動化纖維鋪放線顯著縮短了複合材料的生產週期。
- 印度和中東及北非(MENA)地區航太補償計畫中的在地採購義務
- 市場限制因素
- 高耗能的氧化和碳化
- 再生碳纖維原料的供應鏈風險
- 在運動用品領域與高性能熱塑性塑膠展開競爭。
- 價值鏈分析
- 技術展望
- 波特五力模型
第5章 市場規模與成長預測
- 按成分
- 聚丙烯腈(PAN)
- 石油瀝青和人造絲
- 依纖維類型
- 原生碳纖維(VCF)
- 再生碳纖維(RCF)
- 其他
- 透過使用
- 複合材料
- 紡織品
- 微電極
- 催化劑
- 按最終用戶行業分類
- 航太/國防
- 替代能源
- 車
- 建築和基礎設施
- 體育用品
- 其他終端用戶產業
- 按地區
- 亞太地區
- 中國
- 日本
- 印度
- 韓國
- 其他亞太國家
- 北美洲
- 美國
- 加拿大
- 墨西哥
- 歐洲
- 德國
- 英國
- 法國
- 義大利
- 其他歐洲國家
- 南美洲
- 巴西
- 阿根廷
- 其他南美國家
- 中東和非洲
- 沙烏地阿拉伯
- 阿拉伯聯合大公國
- 南非
- 埃及
- 其他中東和非洲國家
- 亞太地區
第6章 競爭情勢
- 市場集中度
- 策略趨勢
- 市佔率和排名分析
- 公司簡介
- AandP Technology, Inc.
- Anshan Senoda Carbon Fiber Co., Ltd.
- DowAksa
- Formosa Plastics Group
- Hexcel Corporation
- HS HYOSUNG ADVANCED MATERIALS
- Jiangsu Hengshen Co.,Ltd
- KUREHA CORPORATION
- Mitsubishi Chemical Group Corporation
- Nippon Graphite Fiber Co., Ltd.
- Rock West Composites, Inc.
- SGL Carbon
- Sigmatex(UK)Limited
- Solvay
- Taekwang Industrial Co., Ltd.
- Teijin Limited
- TORAY INDUSTRIES, INC.
- UMATEX
- Zhongfu Shenying Carbon Fiber Co., Ltd.
第7章 市場機會與未來展望
According to Mordor Intelligence, the carbon fiber market size is expected to grow from 207.83 kilotons in 2025 to 245.37 kilotons in 2026 and is forecast to reach 562.77 kilotons by 2031 at 18.06% CAGR over 2026-2031.
This report is Segmented by Raw Material (Polyacrylonitrile, and Petroleum Pitch and Rayon), Fiber Type (Virgin Carbon Fiber, Recycled Carbon Fiber, and Others), Application (Composite Materials, Textiles, and More), End-User Industry (Aerospace and Defense, Alternative Energy, and More), and Geography (Asia-Pacific, North America, and More). The Market Forecasts are Provided in Terms of Volume (tons).
Global Carbon Fiber Market Trends and Insights
Rising Production of Hydrogen and CNG Pressure Vessels for Commercial Mobility
Type IV cylinders that wrap polymer liners with carbon fiber now define the 700-bar storage standard for fuel-cell trucks, buses, and trains, contributing to carbon fiber market share growth. Voith's Carbon4Tank cleared UNECE Regulation 134 burst-pressure tests above 1,050 bar, opening series supply to European heavy-duty fleets. The U.S. Department of Energy calculated a cost of USD 12.7 per kilowatt-hour in 2024, down from USD 18 in 2020, as filament-winding automation and precursor price stability improved economics. Luxfer and Hexagon Purus enlarged North American and European manufacturing footprints, each tank incorporating 25-30 kg of fiber and delivering 8-12% higher payload versus steel cylinders. ISO 11119 and DOT FMVSS 304 fatigue requirements over 15,000 cycles reinforce the reliability edge against aluminum-lined alternatives. Fleet operators see lower lifetime cost from lighter tanks, which accelerates commercial adoption in long-haul corridors.
Rapid Deployment of Offshore Wind Turbines Requiring High-Strength Blades
Next-generation turbines in the 11-22 MW class employ 100-143 m blades that need spar-cap tensile strength exceeding 4,800 MPa. Siemens Gamesa's B108 integrates carbon-fiber spars to shave 20% blade mass, lowering tower-top loads and installation cost. Mingyang Smart Energy's 143 m blade for an 18 MW platform consumes 15-18 tons of fiber, translating to roughly 50,000 tons of annual demand for offshore blades alone. Europe added 4.2 GW of offshore capacity in 2024, and blade carbon-fiber content climbed to 25-30% of mass, up from 15% in 2020. Taiwan and Japan deploy floating platforms in typhoon-prone waters, where carbon composites withstand cyclic fatigue 30-40% better than glass fiber. These factors secure a multiyear pull for structural composites across Asian and European coastlines.
Energy-Intensive Oxidation and Carbonization
Producing one kilogram of fiber consumes 50-100 kWh and emits 20-30 kg of CO2, up to five times more than aluminum extrusion, posing a major challenge for the carbon fiber industry. European electricity costs of EUR 0.15-0.25 per kWh in 2024-2025 raised manufacturing costs by USD 5-8 per kg, widening the gap with Asian suppliers powered by low-cost coal. Toray targets a 30% absolute emissions cut by 2030 via renewable electricity and waste-heat recovery at its Hungary site, yet carbonization furnaces still lock in high intensity. Mitsubishi Chemical pilots lower-temperature PAN that trims energy 15-20%, but commercial rollout is two to three years away. Customers now request Environmental Product Declarations under ISO 14025, so fiber makers must invest an estimated USD 500 million to reach the 2030 target of below 15 kg CO2 per kg of fiber.
Other drivers and restraints analyzed in the detailed report include:
- Adoption of Battery-Pack Enclosures and Lightweighting in EV Platforms
- 3D Automated Fiber-Placement Lines Slashing Composite Cycle Times
- Supply-Chain Risks for Recycled Carbon Fiber Feedstock
For complete list of drivers and restraints, kindly check the Table Of Contents.
Segment Analysis
Polyacrylonitrile captured 95.18% of the 2025 volume and is anticipated to grow with a CAGR of 18.91% during the forecast period. Its strong carbon yield keeps average cost near USD 12-14 per kg even after energy surcharges, helping the carbon fiber market defend against thermoplastic substitution. Tight supply in 2024-2025 lifted spot PAN to USD 8-10 per kg, forcing some converters to invoke force-majeure clauses on automotive contracts. China's Jilin Chemical and Bluestar control up to 70% of global precursor capacity, giving Asia-Pacific leverage over global pricing.
Pilot programs for microwave-assisted oxidation show 25-30% faster cycle time and 15-20% lower energy use, pointing to a structural cost decline after 2028. Pitch and rayon remain niche but vital for ultra-high-modulus spacecraft structures and thermal barriers that demand modulus above 800 GPa. Hyosung's 4,000-ton expansion and bio-based acrylonitrile initiatives promise a 30-40% lifecycle-emission cut, aligning with OEM net-zero targets. The carbon fiber market size for PAN-based grades is projected to move in lockstep with acrylonitrile availability; any prolonged outage in Shandong or Jiangsu could ripple through the value chain within nine months.
Virgin grades kept 62.95% share in 2025, accounting for the largest carbon fiber market share mainly serving aerospace and defense programs that require lot-traceability and tight mechanical tolerances. Recycled volumes are anticipated to grow with a CAGR of 19.87% through 2031 on the back of automotive and wind energy pull, yet certification for primary structures remains outside the 2026 planning horizon.
ELG Carbon Fibre recovers 90-95% of virgin strength from aerospace scrap, enabling seat frames and overhead bins at 30-50% lower cost. Karborek's solvolysis route retains fibers above 80 mm but must manage solvent waste streams that raise operating costs. Gen 2 Carbon closes the loop on thermoplastic parts, a key differentiator as EV battery-tray volumes rise. The carbon fiber market share for recycled grades is poised to widen further once wind-blade decommissioning accelerates after 2027, providing a stable feedstock base.
Complete Report Scope:
- By Raw Material
- Polyacrylonitrile (PAN)
- Petroleum Pitch and Rayon
- By Fiber Type
- Virgin Carbon Fiber (VCF)
- Recycled Carbon Fiber (RCF)
- Others
- By Application
- Composite Materials
- Textiles
- Micro-Electrodes
- Catalysis
- By End-User Industry
- Aerospace and Defense
- Alternative Energy
- Automotive
- Construction and Infrastructure
- Sporting Goods
- Other End-user Industries
- By Geography
- Asia-Pacific
- China
- Japan
- India
- South Korea
- Rest of Asia-Pacific
- North America
- United States
- Canada
- Mexico
- Europe
- Germany
- United Kingdom
- France
- Italy
- Rest of Europe
- South America
- Brazil
- Argentina
- Rest of South America
- Middle-East and Africa
- Saudi Arabia
- United Arab Emirates
- South Africa
- Egypt
- Rest of Middle-East and Africa
- Asia-Pacific
Geography Analysis
Asia-Pacific led the carbon fiber market with 44.89% share in 2025 and is set to grow at a 20.75% CAGR through 2031. China's vertically integrated precursor-to-fiber chains, Japan's aerospace-grade specialties, and India's offset policies guarantee strong local pull. Taiwan's 4.5 GW offshore wind fleet and South Korea's automotive suppliers add further upside. Low electricity prices and captive acrylonitrile supply cement the region's cost advantage.
North America ranks second by volume, with the United States carbon fiber market boosted by Boeing, Lockheed Martin, and battery-electric vehicle initiatives tied to the Inflation Reduction Act incentives. Toray's 5,000 ton South Carolina line will cover automotive grades, while Hexcel's Salt Lake City expansion supports 787 and A350 wing spars. Recycled-fiber networks in Washington and Maine supply Tier 1 automotive interiors, expanding domestic circularity, strengthening the regional carbon fiber industry.
Europe combines offshore wind, strict vehicle emissions rules, and Airbus aerostructures to maintain high utilization despite energy-price volatility. Siemens Gamesa blades integrate carbon-fiber spar caps that reduce mass by 20%. Germany's automakers rely on thermoplastic composites from SGL Carbon's Meitingen plant to meet the 95 g/km CO2 target. The EU Critical Raw Materials Act encourages domestic capacity, and Toray's Hungary site now sources renewable electricity to cut lifecycle emissions 30%, supporting the regional carbon fiber industry.
- AandP Technology, Inc.
- Anshan Senoda Carbon Fiber Co., Ltd.
- DowAksa
- Formosa Plastics Group
- Hexcel Corporation
- HS HYOSUNG ADVANCED MATERIALS
- Jiangsu Hengshen Co.,Ltd
- KUREHA CORPORATION
- Mitsubishi Chemical Group Corporation
- Nippon Graphite Fiber Co., Ltd.
- Rock West Composites, Inc.
- SGL Carbon
- Sigmatex (UK) Limited
- Solvay
- Taekwang Industrial Co., Ltd.
- Teijin Limited
- TORAY INDUSTRIES, INC.
- UMATEX
- Zhongfu Shenying Carbon Fiber Co., Ltd.
Additional Benefits:
- The market estimate (ME) sheet in Excel format
- 3 months of analyst support
TABLE OF CONTENTS
1 Introduction
- 1.1 Study Assumptions and Market Definition
- 1.2 Scope of the Study
2 Research Methodology
3 Executive Summary
4 Market Landscape
- 4.1 Market Overview
- 4.2 Market Drivers
- 4.2.1 Rising production of hydrogen and CNG pressure vessels for commercial mobility
- 4.2.2 Rapid deployment offshore wind turbines requiring high-strength blades
- 4.2.3 Adoption of battery-pack enclosures and lightweighting in EV platforms
- 4.2.4 3-D automated fiber-placement lines slashing composite cycle times
- 4.2.5 Local-content mandates in India and MENA aerospace offset programs
- 4.3 Market Restraints
- 4.3.1 Energy-intensive oxidation and carbonization
- 4.3.2 Supply-chain risks for recycled carbon fiber feedstock
- 4.3.3 Competition from high-performance thermoplastics in sporting goods
- 4.4 Value Chain Analysis
- 4.5 Technological Outlook
- 4.6 Porter's Five Forces
- 4.6.1 Bargaining Power of Suppliers
- 4.6.2 Bargaining Power of Buyers
- 4.6.3 Threat of New Entrants
- 4.6.4 Threat of Substitutes
- 4.6.5 Degree of Competition
5 Market Size and Growth Forecasts (Value and Volume)
- 5.1 By Raw Material
- 5.1.1 Polyacrylonitrile (PAN)
- 5.1.2 Petroleum Pitch and Rayon
- 5.2 By Fiber Type
- 5.2.1 Virgin Carbon Fiber (VCF)
- 5.2.2 Recycled Carbon Fiber (RCF)
- 5.2.3 Others
- 5.3 By Application
- 5.3.1 Composite Materials
- 5.3.2 Textiles
- 5.3.3 Micro-Electrodes
- 5.3.4 Catalysis
- 5.4 By End-User Industry
- 5.4.1 Aerospace and Defense
- 5.4.2 Alternative Energy
- 5.4.3 Automotive
- 5.4.4 Construction and Infrastructure
- 5.4.5 Sporting Goods
- 5.4.6 Other End-user Industries
- 5.5 By Geography
- 5.5.1 Asia-Pacific
- 5.5.1.1 China
- 5.5.1.2 Japan
- 5.5.1.3 India
- 5.5.1.4 South Korea
- 5.5.1.5 Rest of Asia-Pacific
- 5.5.2 North America
- 5.5.2.1 United States
- 5.5.2.2 Canada
- 5.5.2.3 Mexico
- 5.5.3 Europe
- 5.5.3.1 Germany
- 5.5.3.2 United Kingdom
- 5.5.3.3 France
- 5.5.3.4 Italy
- 5.5.3.5 Rest of Europe
- 5.5.4 South America
- 5.5.4.1 Brazil
- 5.5.4.2 Argentina
- 5.5.4.3 Rest of South America
- 5.5.5 Middle-East and Africa
- 5.5.5.1 Saudi Arabia
- 5.5.5.2 United Arab Emirates
- 5.5.5.3 South Africa
- 5.5.5.4 Egypt
- 5.5.5.5 Rest of Middle-East and Africa
- 5.5.1 Asia-Pacific
6 Competitive Landscape
- 6.1 Market Concentration
- 6.2 Strategic Moves
- 6.3 Market Share(%)/Ranking Analysis
- 6.4 Company Profiles (includes Global level Overview, Market level overview, Core Segments, Financials as available, Strategic Information, Market Rank/Share for key companies, Products and Services, and Recent Developments)
- 6.4.1 AandP Technology, Inc.
- 6.4.2 Anshan Senoda Carbon Fiber Co., Ltd.
- 6.4.3 DowAksa
- 6.4.4 Formosa Plastics Group
- 6.4.5 Hexcel Corporation
- 6.4.6 HS HYOSUNG ADVANCED MATERIALS
- 6.4.7 Jiangsu Hengshen Co.,Ltd
- 6.4.8 KUREHA CORPORATION
- 6.4.9 Mitsubishi Chemical Group Corporation
- 6.4.10 Nippon Graphite Fiber Co., Ltd.
- 6.4.11 Rock West Composites, Inc.
- 6.4.12 SGL Carbon
- 6.4.13 Sigmatex (UK) Limited
- 6.4.14 Solvay
- 6.4.15 Taekwang Industrial Co., Ltd.
- 6.4.16 Teijin Limited
- 6.4.17 TORAY INDUSTRIES, INC.
- 6.4.18 UMATEX
- 6.4.19 Zhongfu Shenying Carbon Fiber Co., Ltd.
7 Market Opportunities and Future Outlook
- 7.1 White-Space and Unmet-Need Assessment
- 7.2 Emphasis on Lignin-based Raw Materials for Carbon Fiber

 北美碳纖維市場:市場佔有率分析、產業趨勢與統計及成長預測(2026-2031)
 碳纖維及碳纖維增強塑膠市場-2026-2032年全球市場預測
 特種纖維材料市場:預測至2034年-按纖維類型、形態、製造流程、應用、最終用戶和地區分類的全球分析碳纖維市場:依纖維種類、等級、原料、樹脂相容性及應用分類-2026-2032年全球市場預測
 2026-2030年全球碳纖維市場
 聚芳酸酯纖維市場規模、佔有率和成長分析:按纖維類型、應用、最終用途、通路和地區分類-2026-2033年產業預測
 標準模量碳纖維市場規模、佔有率和成長分析:按產品類型、絲束尺寸、形狀、應用、終端用戶產業、分銷管道和地區分類-2026-2033年產業預測
 碳纖維及碳纖維增強複合材料市場規模、佔有率及成長分析:依纖維類型、樹脂類型、製造流程、應用、最終用戶、形狀及地區分類-2026-2033年產業預測
 全球碳纖維市場:依原料、要素、產品類型、纖維類型、應用、終端用戶產業及地區分類-預測至2031年綠色碳纖維市場預測至2034年—按類型、原料、應用和地區分類的全球分析