


 |
市場調查報告書
商品編碼
2100042
預測性維護:市場佔有率分析、產業趨勢與統計、成長預測(2026-2031 年)Predictive Maintenance - Market Share Analysis, Industry Trends & Statistics, Growth Forecasts (2026 - 2031) |
||||||

※ 本網頁內容可能與最新版本有所差異。詳細情況請與我們聯繫。
據 Mordor Intelligence 稱,預測性維護市場在 2025 年的價值為 140.9 億美元,預計到 2031 年將達到 821.7 億美元,而 2026 年為 189 億美元,預測期(2026-2031 年)的複合年成長率為 34.14%。
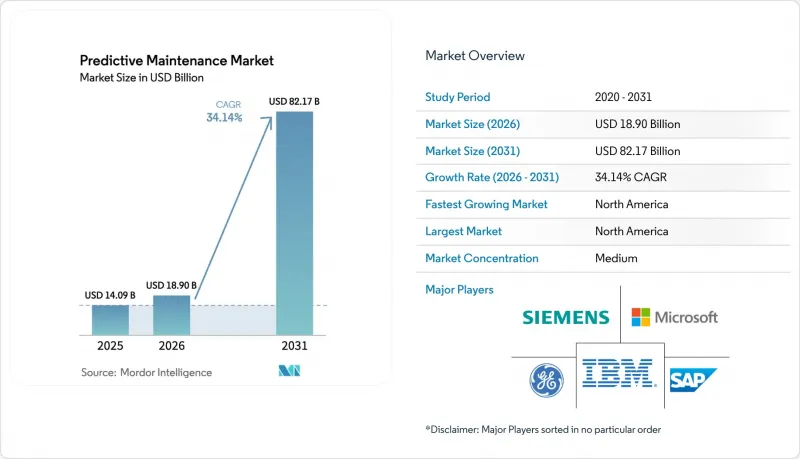
本報告按組件(硬體、軟體、服務)、公司規模(中小企業、大型企業)、部署類型(本地部署、雲端部署)、最終用戶產業(工業製造、汽車和交通運輸、能源和公共產業、其他)以及地區進行細分。市場預測以美元計價。
全球預測性維護市場趨勢及洞察
利用物聯網實現資產連結的快速擴展
工業IoT感測器的應用範圍已從振動和溫度探頭擴展到在單塊電路板上監測聲學、熱學和功率特性。邊緣閘道器每秒可在本地處理數千個資料點,確保即時警報,同時減少雲端流量。與有線佈局相比,無線網狀網路可將安裝成本降低高達 60%,使偏遠礦場、海上鑽井設施和行動裝置也能納入預測性維護的範疇。 MQTT 和 OPC-UA 等標準化協議提高了互通性,降低了多廠商工廠整合的複雜性。雖然 2024 年以後硬體價格的上漲會減緩採購週期,但這促使人們更加關注邊緣效率,許多工廠正在用緊湊型推理單元取代複雜的伺服器。
人工智慧/機器學習準確性的突破
整合機器學習流程和領域自適應深度學習模型目前能夠提前 30-60 天預測軸承、幫浦和馬達故障,準確率高達 85-95%。合成資料和遷移學習技術使團隊能夠在數週內(而非數年)訓練模型,即使歷史故障資料匱乏也能輕鬆應對。邊緣推理晶片無需持續連接即可提供即時洞察,即使在頻寬受限的區域也能確保運作。整合到維護套件中的生成式 AI 輔助系統可透過自然語言查詢為技術人員提供與實際情況相關的維修程序、零件清單和安全檢查。更高的準確率直接增強了使用者的信心,並有助於系統擴展到小規模的生產基地。
資料安全和隱私挑戰
隨著感測器網路的擴展,攻擊面也隨之擴大,操作技術(OT) 面臨網路威脅的風險。傳統協定缺乏原生加密功能,因此必須對現有系統進行改造,並添加安全隧道和身份驗證層,以滿足 GDPR 和 NERC CIP 等法規的要求。如何在確保即時數據流的同時兼顧嚴格的安全措施仍然是一項挑戰,尤其是在醫療保健和關鍵能源設施等對患者安全和電網穩定性要求極高的領域。因此,企業正在優先考慮採用具備設備級加密、零信任架構和符合稽核要求的資料處理實務的平台。
細分市場分析
到2025年,硬體將佔據預測性維護市場45.18%的佔有率。高效能感測器和邊緣閘道器構成了軟體分析賴以生存的數據骨幹。由於新應用的不斷湧現,目標市場每年都在擴張,因此這個細分市場仍然至關重要。軟體銷售成長最快,到2031年將以35.82%的複合年成長率成長,這主要得益於人工智慧庫的成熟和雲端訂閱的普及。服務細分市場雖然規模較小,但卻為複雜的工業設施提供了部署、校準和模型調優的關鍵專業知識。
無線感測器的持續小型化和成本降低使得單一裝置即可監測多個參數,從而降低了整體部署成本。邊緣單元現在可以在本地執行機器學習推理,在確保安全關鍵資產確定性延遲的同時,降低了頻寬佔用。軟體供應商正專注於模組化設計,使工廠能夠獲得針對泵浦、驅動裝置或暖通空調系統量身定做的分析軟體包許可。生成式人工智慧前端允許技術人員使用簡單易懂的語言與維護系統交互,進一步降低了培訓成本。服務公司透過提供包含遠端監控、定期模型更新和網路安全措施的承包解決方案來應對勞動力短缺問題。
2025年,擁有龐大資產組合和充足IT預算的大型企業將佔據預測性維護市場63.65%的收入佔有率。然而,隨著採用門檻的降低,中小企業將成為最具活力的成長群體,到2031年將以36.2%的複合年成長率成長。付費使用制使得即使是小規模工廠也能以每項資產每月僅50-100美元的價格啟動試點運營,並在12-18個月內實現正投資回報率。
大型企業利用私有雲端和內部資料科學團隊客製化演算法,以適應其獨特的設備。他們還將預測儀表板整合到現有的MES和ERP環境中,從而簡化工作流程調整。而中小企業則依賴供應商管理的雲端工具,這些工具可以自動完成更新、安全性修補程式和模型重新訓練。託管服務合作夥伴將感測器、閘道器和分析功能捆綁到單一訂閱中,進一步簡化了部署。邊緣AI緩解了偏遠工廠的頻寬限制,並減少了對高容量連線的依賴。
區域分析
預計到2025年,北美將佔全球銷售額的28.85%,這得益於對數位化工廠的早期投資、充裕的創業投資資金以及有利的法規環境。工業IoT平台的廣泛應用,加上高昂的人事費用,正推動企業持續增加對預測性解決方案的投入。與自動化巨頭和超大規模雲端服務供應商的策略合作,正在加速產品創新和市場滲透。然而,跨學科人才的嚴重短缺以及人們對網路風險日益增強的認知,給中小企業帶來了挑戰。
亞太地區是成長最快的地區,預計到2031年將以35.25%的複合年成長率持續成長。各國推行的工業4.0計畫、大規模製造業生產以及不斷提升的技術水準都在支撐著市場需求。為應對勞動力老化並保持出口競爭力,地方政府正在津貼感測器部署和數位技能培訓。儘管區域企業受益於低廉的硬體成本和區域電子元件供應鏈,但它們仍需要有針對性的解決方案來解決與舊有系統整合和資料管治的問題。
在歐洲,成熟的工業自動化和嚴格的資料保護法律共同推動了數位孿生技術的應用穩步擴展。在德國的汽車和機械行業,融合了預測程序的先進數位孿生項目正以檢測為基礎進行實施;而在英國,狀態監測框架正被用於老舊電網的現代化改造。以西門子、ABB和施耐德電機為核心的供應商生態系統提供經CE認證的整合解決方案,適用於各種環境。中東和非洲市場仍在發展中,但在石油、天然氣和可再生能源領域潛力巨大,這些領域對資產可靠性要求極高,且偏遠地區的物流成本居高不下。
其他好處
- Excel格式的市場預測(ME)表
- 3個月的分析師支持
目錄
第1章:引言
- 研究假設和市場定義
- 調查範圍
第2章:調查方法
第3章執行摘要
第4章 市場狀況
- 市場概覽
- 市場促進因素
- 利用物聯網實現資產互聯的蓬勃發展
- 人工智慧/機器學習準確性的突破
- 停機時間減少所帶來的成本壓力
- 雲端原生部署的可擴充性
- 基於數位孿生的混合工作流程
- 與環境、社會及公司治理 (ESG) 相關的維護關鍵績效指標
- 市場限制因素
- 資料安全和隱私挑戰
- 熟練人員短缺
- 傳統協定互通性問題
- 人工智慧模型漂移與法律責任風險
- 供應鏈分析
- 監理情勢
- 技術展望
- 波特五力模型
- 對影響市場的宏觀經濟因素進行評估
第5章 市場規模及成長預測(價值,2024-2030 年)
- 按組件
- 硬體
- 軟體
- 服務
- 按公司規模
- 小型企業
- 大公司
- 按實現類型
- 現場
- 雲
- 按最終用戶行業分類
- 工業製造
- 汽車和運輸業
- 能源與交通
- 衛生保健
- 電訊
- 航太/國防
- 其他(石油和天然氣、採礦等)
- 按地區
- 北美洲
- 美國
- 加拿大
- 墨西哥
- 南美洲
- 巴西
- 阿根廷
- 其他南美國家
- 歐洲
- 德國
- 英國
- 法國
- 荷蘭
- 其他歐洲國家
- 亞太地區
- 中國
- 日本
- 印度
- 韓國
- 澳洲和紐西蘭
- 其他亞太國家
- 中東和非洲
- 中東
- 阿拉伯聯合大公國
- 沙烏地阿拉伯
- 土耳其
- 其他中東國家
- 非洲
- 南非
- 奈及利亞
- 其他非洲地區
- 中東
- 北美洲
第6章 競爭情勢
- 市場集中度
- 策略趨勢
- 市佔率分析
- 公司簡介
- IBM Corporation
- Microsoft Corporation
- SAP SE
- Siemens AG
- General Electric Company
- Robert Bosch GmbH
- ABB Ltd.
- Schneider Electric SE
- Honeywell International Inc.
- Rockwell Automation, Inc.
- Emerson Electric Co.
- PTC Inc.
- Hitachi Ltd.
- Oracle Corporation
- C3.ai, Inc.
- Uptake Technologies, Inc.
- SAS Institute Inc.
- SKF AB
- Dell Technologies
- Senseye(Siemens)
- Aspen Technology, Inc.
- Fiix Software(Rockwell)
- OSIsoft(AVEVA)
第7章 市場機會與未來展望
According to Mordor Intelligence, the predictive maintenance market size was valued at USD 14.09 billion in 2025 and estimated to grow from USD 18.9 billion in 2026 to reach USD 82.17 billion by 2031, at a CAGR of 34.14% during the forecast period (2026-2031).
This report is Segmented by Component (Hardware, Software, Services), Enterprise Size (Small and Medium Enterprises, Large Enterprises), Deployment Mode (On-Premise, Cloud), End-User Industry (Industrial Manufacturing, Automotive & Transportation, Energy and Utilities, and More), and Geography. The Market Forecasts are Provided in Terms of Value (USD)
Global Predictive Maintenance Market Trends and Insights
IoT-Enabled Asset Connectivity Boom
Mass adoption of industrial IoT sensors now extends beyond vibration and temperature probes to include acoustic, thermal, and power-signature monitoring on a single board. Edge gateways process thousands of data points per second locally, ensuring immediacy of alerts while limiting traffic back to the cloud.Wireless mesh networks cut installation costs up to 60% relative to wired layouts, bringing remote mines, offshore rigs, and mobile equipment into predictive regimes. Standardized protocols such as MQTT and OPC-UA raise interoperability, reducing integration complexity for multi-vendor plants. Hardware inflation since 2024 has slowed procurement cycles, yet the resulting focus on edge efficiency means many plants are replacing complex servers with compact inference units.
AI/ML Accuracy Breakthroughs
Ensemble machine-learning pipelines and domain-adapted deep-learning models now achieve 85-95% precision in predicting bearing, pump, and motor failures 30-60 days in advance. Synthetic data and transfer-learning techniques let teams train models in weeks rather than years, even when historical failure events are scarce. Edge inference chips deliver real-time insights without persistent connectivity, maintaining operations in bandwidth-limited areas. Generative AI copilots embedded in maintenance suites provide technicians with contextual repair steps, parts lists, and safety checks using natural-language queries. Higher accuracy directly improves user trust, driving wider rollout across smaller production sites.
Data-Security and Privacy Gaps
Expanded sensor networks enlarge attack surfaces, exposing operational technology to cyberthreats. Legacy protocols lack native encryption, forcing retrofit of secure tunneling and authentication layers to meet regulations such as GDPR and NERC CIP. Balancing real-time data flows with strict security policies remains a challenge, especially in healthcare and critical-energy sites where both patient safety and grid stability are paramount. Enterprises therefore prioritize platforms featuring device-level encryption, zero-trust architectures, and audit-ready data-handling practices.
Other drivers and restraints analyzed in the detailed report include:
- Downtime-Reduction Cost Pressures
- Cloud-Native Deployment Scalability
- Skilled-Talent Shortage
For complete list of drivers and restraints, kindly check the Table Of Contents.
Segment Analysis
Hardware captured a 45.18% share of the predictive maintenance market in 2025. High-performance sensors and edge gateways create the data backbone that software analytics depend on. The segment remains pivotal because new installations expand the addressable base each year. Software revenues are climbing quickest, advancing at a 35.82% CAGR to 2031 as AI libraries mature and cloud subscriptions proliferate. Services, though smaller, deliver critical deployment, calibration, and model-tuning expertise across complex industrial estates.
Continued miniaturization and cost reductions in wireless sensors allow multi-parameter monitoring from a single device, reducing total installed cost. Edge units now execute machine-learning inference locally, trimming bandwidth usage and ensuring deterministic latency for safety-critical assets. Software providers focus on modular designs, allowing plants to license analytics packs specific to pumps, drives, or HVAC systems. Generative-AI front ends further lower training overhead by letting technicians converse with maintenance systems in plain language. Services firms combat talent shortages by offering turnkey packages that include remote monitoring, periodic model refreshes, and cybersecurity safeguards.
Large corporations controlled 63.65% of predictive maintenance market revenue in 2025 owing to expansive asset portfolios and deep IT budgets. However, SMEs represent the most dynamic constituency, advancing at a 36.2% CAGR to 2031 as barriers to adoption fall. Pay-as-you-go pricing lets smaller plants launch pilots for USD 50-100 per asset per month, achieving positive ROI within 12-18 months.
Enterprise incumbents leverage private clouds and internal data-science teams to tailor algorithms for proprietary equipment. They also integrate predictive dashboards into existing MES and ERP environments, streamlining workflow orchestration. SMEs, conversely, rely on vendor-managed cloud tools where updates, security patches, and model retraining occur automatically. Managed-service partners further ease uptake by bundling sensors, gateways, and analytics in a single subscription. Edge AI mitigates bandwidth constraints in rural factories, reducing dependence on high-capacity connections.
Complete Report Scope:
- By Component
- Hardware
- Software
- Services
- By Enterprise Size
- Small and Medium Enterprises
- Large Enterprises
- By Deploymet Mode
- On-Premise
- Cloud
- By End-user Industry
- Industrial Manufacturing
- Automotive and Transportation
- Energy and Utilities
- Healthcare
- Telecommunications
- Aerospace and Defense
- Others (Oil and Gas, Mining, etc.)
- By Geography
- North America
- United States
- Canada
- Mexico
- South America
- Brazil
- Argentina
- Rest of South America
- Europe
- Germany
- United Kingdom
- France
- Netherlands
- Rest of Europe
- Asia-Pacific
- China
- Japan
- India
- South Korea
- Australia and New Zealand
- Rest of Asia-Pacific
- Middle East and Africa
- Middle East
- United Arab Emirates
- Saudi Arabia
- Turkey
- Rest of Middle East
- Africa
- South Africa
- Nigeria
- Rest of Africa
- Middle East
- North America
Geography Analysis
North America held 28.85% revenue share in 2025 thanks to early digital-factory investment, abundant venture funding, and a supportive regulatory climate. Widespread adoption of industrial IoT platforms, coupled with high labor costs, drives continued spending on predictive solutions. Strategic collaborations between automation giants and hyperscale-cloud providers accelerate product innovation and market penetration. Nonetheless, acute shortages of cross-disciplinary talent and heightened cyber-risk awareness challenge smaller enterprises.
Asia-Pacific is the fastest-expanding region, advancing at a 35.25% CAGR through 2031. National Industry 4.0 programs, sizeable manufacturing output, and growing technical expertise underpin demand. Local governments subsidize sensor retrofits and digital-skills training to offset aging workforces and sustain export competitiveness. Regional firms benefit from lower hardware costs and in-region electronics supply chains, although legacy-system connectivity and data-governance concerns require targeted solutions.
Europe combines mature industrial automation with stringent data-protection laws, yielding steady adoption growth. German automotive and machinery sectors pilot advanced digital-twin projects that embed predictive routines, while the United Kingdom modernizes aging energy grids with condition-monitoring frameworks. Vendor ecosystems anchored by Siemens, ABB, and Schneider Electric provide integrated offerings certified for CE-marked environments. Middle East and Africa markets remain nascent but show promise in oil, gas, and renewables where asset reliability is paramount and remote-site logistics are costly.
- IBM Corporation
- Microsoft Corporation
- SAP SE
- Siemens AG
- General Electric Company
- Robert Bosch GmbH
- ABB Ltd.
- Schneider Electric SE
- Honeywell International Inc.
- Rockwell Automation, Inc.
- Emerson Electric Co.
- PTC Inc.
- Hitachi Ltd.
- Oracle Corporation
- C3.ai, Inc.
- Uptake Technologies, Inc.
- SAS Institute Inc.
- SKF AB
- Dell Technologies
- Senseye (Siemens)
- Aspen Technology, Inc.
- Fiix Software (Rockwell)
- OSIsoft (AVEVA)
Additional Benefits:
- The market estimate (ME) sheet in Excel format
- 3 months of analyst support
TABLE OF CONTENTS
1 INTRODUCTION
- 1.1 Study Assumptions and Market Definition
- 1.2 Scope of the Study
2 RESEARCH METHODOLOGY
3 EXECUTIVE SUMMARY
4 MARKET LANDSCAPE
- 4.1 Market Overview
- 4.2 Market Drivers
- 4.2.1 IoT-enabled asset connectivity boom
- 4.2.2 AI/ML accuracy breakthroughs
- 4.2.3 Downtime-reduction cost pressures
- 4.2.4 Cloud-native deployment scalability
- 4.2.5 Digital-twin-driven prescriptive workflows
- 4.2.6 ESG-linked maintenance KPIs
- 4.3 Market Restraints
- 4.3.1 Data-security and privacy gaps
- 4.3.2 Skilled-talent shortage
- 4.3.3 Legacy-protocol interoperability issues
- 4.3.4 AI model drift and liability risk
- 4.4 Supply-Chain Analysis
- 4.5 Regulatory Landscape
- 4.6 Technological Outlook
- 4.7 Porter's Five Forces
- 4.7.1 Threat of New Entrants
- 4.7.2 Bargaining Power of Buyers
- 4.7.3 Bargaining Power of Suppliers
- 4.7.4 Threat of Substitutes
- 4.7.5 Intensity of Rivalry
- 4.8 Assesment of Macroeconomic Factors on the Market
5 MARKET SIZE AND GROWTH FORECASTS (VALUE, 2024-2030)
- 5.1 By Component
- 5.1.1 Hardware
- 5.1.2 Software
- 5.1.3 Services
- 5.2 By Enterprise Size
- 5.2.1 Small and Medium Enterprises
- 5.2.2 Large Enterprises
- 5.3 By Deploymet Mode
- 5.3.1 On-Premise
- 5.3.2 Cloud
- 5.4 By End-user Industry
- 5.4.1 Industrial Manufacturing
- 5.4.2 Automotive and Transportation
- 5.4.3 Energy and Utilities
- 5.4.4 Healthcare
- 5.4.5 Telecommunications
- 5.4.6 Aerospace and Defense
- 5.4.7 Others (Oil and Gas, Mining, etc.)
- 5.5 By Geography
- 5.5.1 North America
- 5.5.1.1 United States
- 5.5.1.2 Canada
- 5.5.1.3 Mexico
- 5.5.2 South America
- 5.5.2.1 Brazil
- 5.5.2.2 Argentina
- 5.5.2.3 Rest of South America
- 5.5.3 Europe
- 5.5.3.1 Germany
- 5.5.3.2 United Kingdom
- 5.5.3.3 France
- 5.5.3.4 Netherlands
- 5.5.3.5 Rest of Europe
- 5.5.4 Asia-Pacific
- 5.5.4.1 China
- 5.5.4.2 Japan
- 5.5.4.3 India
- 5.5.4.4 South Korea
- 5.5.4.5 Australia and New Zealand
- 5.5.4.6 Rest of Asia-Pacific
- 5.5.5 Middle East and Africa
- 5.5.5.1 Middle East
- 5.5.5.1.1 United Arab Emirates
- 5.5.5.1.2 Saudi Arabia
- 5.5.5.1.3 Turkey
- 5.5.5.1.4 Rest of Middle East
- 5.5.5.2 Africa
- 5.5.5.2.1 South Africa
- 5.5.5.2.2 Nigeria
- 5.5.5.2.3 Rest of Africa
- 5.5.5.1 Middle East
- 5.5.1 North America
6 COMPETITIVE LANDSCAPE
- 6.1 Market Concentration
- 6.2 Strategic Moves
- 6.3 Market Share Analysis
- 6.4 Company Profiles (includes Global level Overview, Market level overview, Core Segments, Financials as available, Strategic Information, Market Rank/Share, Products and Services, Recent Developments)
- 6.4.1 IBM Corporation
- 6.4.2 Microsoft Corporation
- 6.4.3 SAP SE
- 6.4.4 Siemens AG
- 6.4.5 General Electric Company
- 6.4.6 Robert Bosch GmbH
- 6.4.7 ABB Ltd.
- 6.4.8 Schneider Electric SE
- 6.4.9 Honeywell International Inc.
- 6.4.10 Rockwell Automation, Inc.
- 6.4.11 Emerson Electric Co.
- 6.4.12 PTC Inc.
- 6.4.13 Hitachi Ltd.
- 6.4.14 Oracle Corporation
- 6.4.15 C3.ai, Inc.
- 6.4.16 Uptake Technologies, Inc.
- 6.4.17 SAS Institute Inc.
- 6.4.18 SKF AB
- 6.4.19 Dell Technologies
- 6.4.20 Senseye (Siemens)
- 6.4.21 Aspen Technology, Inc.
- 6.4.22 Fiix Software (Rockwell)
- 6.4.23 OSIsoft (AVEVA)
7 MARKET OPPORTUNITIES AND FUTURE OUTLOOK
- 7.1 White-space and Unmet-Need Assessment

 人工智慧驅動的預測性維護自動化市場預測至2034年:按產品類型、組件、資產類型、應用、最終用戶和地區分類的全球分析
 2026年全球工業預測性維護市場報告
 2026-2030年全球預測性維護(PDM)市場
 生產監測:市場佔有率分析、產業趨勢與統計、成長預測(2026-2031)鐵路預測性維護市場預測至2034年—全球解決方案、資產類型、技術、部署模式、最終用戶和區域分析能源產業的預測性維護:市場佔有率分析、產業趨勢和統計數據以及成長預測(2026-2031 年)
 製造業預測性維護市場-2026-2032年全球市場預測汽車預測性維護市場預測至2034年—按組件、部署模式、技術、動力系統、應用、最終用戶和地區分類的全球分析預測性維護平台市場:2034 年預測-按組件、部署模式、技術、應用、最終用戶和地區分類的全球分析預測維修系統市場預測至2034年-按組件、部署模式、組織規模、技術、應用、最終用戶和地區分類的全球分析