


 |
市場調查報告書
商品編碼
2114992
生產監測:市場佔有率分析、產業趨勢與統計、成長預測(2026-2031)Production Monitoring - Market Share Analysis, Industry Trends & Statistics, Growth Forecasts (2026 - 2031) |
||||||

※ 本網頁內容可能與最新版本有所差異。詳細情況請與我們聯繫。
據 Mordor Intelligence 稱,2025 年生產監控市場價值為 64.7 億美元,預計到 2031 年將達到 106.3 億美元,而 2026 年為 70.3 億美元,預測期(2026-2031 年)的複合年成長率為 8.62%。
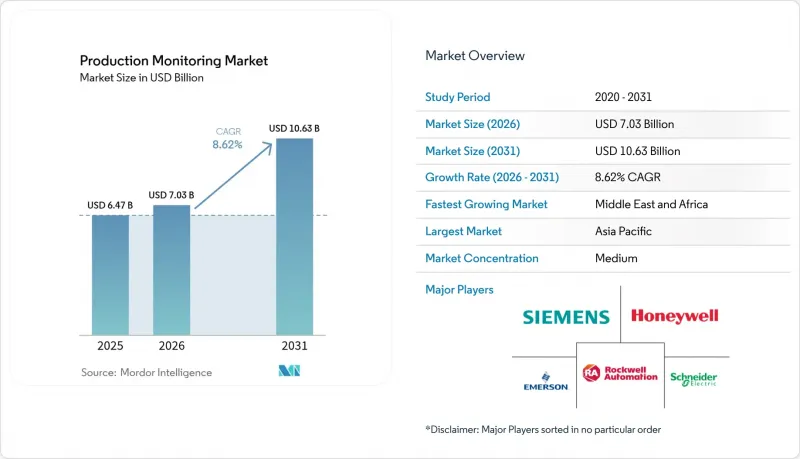
本報告按組件(解決方案、服務)、部署模式(雲端、本地部署)、應用(業務流程最佳化、物流和供應鏈管理等)、最終用戶(石油天然氣、化學、汽車、能源電力、食品飲料等)和地區進行細分。市場預測以美元計價。
全球生產監測市場趨勢與洞察
對集中式監控和預測性維護的需求
製造商正在整合整個工廠的資產數據,以建立一個“單一、可信賴的資訊資訊來源”,用於其人工智慧維護模型。斑馬技術公司的報告指出,到2024年,只有16%的生產企業能夠即時了解其工廠車間的狀況,凸顯了巨大的性能差距。實施預測分析的汽車集團透過邊緣基礎設施最佳化,將意外故障減少了高達70%,並創造了1億美元的設備生命週期價值。因此,生產經理不再僅僅將預測性維護視為降低成本的工具,而是將其視為提高盈利能力的手段,從而推動了對能夠將振動、溫度和壓力數據整合為可操作的健康評分的平台的需求。
實施用於即時可視化的工業物聯網平台
工業物聯網 (IIoT) 套件現已將機械、工人及物流流程整合到單一的數位化平台上。美的泰國公司部署 5G 網路後,透過整合機器人和人工智慧驅動的偵測流程,生產效率提升了 15% 至 20%。 TDK 的「i3 Micro」等感測器外形規格以郵票大小的體積整合多模態數據,無需大規模維修即可將現有設施(棕地)連接到數據湖。二級供應商也從中受益,因為雲端邊緣閘道器降低了部署成本,並減少了進入生產監控市場的門檻。
資料安全和隱私問題
互聯工廠擴大了攻擊面。根據 2024 年 VOID 報告,如果自動化系統配置錯誤,可能會加劇安全事件,迫使操作員進行手動干預。歐盟製造商目前面臨嚴格的資料管治法規,因此對基於區塊鏈的可追溯性技術越來越感興趣,這種技術既能增強隱私,又能保持透明度。
細分市場分析
到2025年,解決方案將佔生產監控市場的61.20%,這反映了硬體和平台銷售的現有地位。然而,由於各組織面臨協議異質性和員工技能差距,預計到2031年,服務業將以9.62%的複合年成長率快速成長。艾默生的DeltaV更新清晰地說明了這一點。此功能包允許公共產業在保留原有I/O的情況下從第三方控制系統遷移,但成功部署需要專業的整合商來重新映射標籤並檢驗安全邏輯。因此,託管分析和持續最佳化合約為供應商提供了持續的收入來源,同時使工廠團隊能夠在無需大規模招聘的情況下擴展其專業知識。
同時,諮詢夥伴正將變革管理方案與技術實施方案打包在一起。客戶逐漸意識到,他們需要改進組織工作流程,以充分利用人工智慧洞察,而不僅僅是展示儀錶板。這種「服務優先」的方法正在強化一個良性循環:解決方案供應商能夠更深入地融入客戶的運營,從而提升生產監控市場的終身價值。
到2025年,雲端解決方案將佔據生產監控市場57.40%的佔有率,年複合成長率達9.31%,這主要得益於製造商對彈性運算和快速模型更新的偏好。微軟展示了雲端分析如何分析能源模式、減少碳足跡並提高監管報告的準確性(microsoft.com)。然而,對於資料主權和延遲至關重要的任務而言,本地環境仍然不可或缺。這一趨勢在國防和公共產業領域尤其明顯,因為這些領域的指揮控制功能必須在空氣間隙的環境中運作。混合框架正逐漸成為一種管治折衷方案,其中敏感的控制迴路保留在本地,而人工智慧密集型工作負載則卸載到超大規模資源上。艾默生的「Ovation 4.0」將生成式人工智慧整合到此類架構中,在不犧牲網路安全標準的前提下,為營運商提供類似雲端的洞察力。
此外,企業正利用計量收費的營運支出模式來測試特定應用場景,並將成熟的方案推廣到整個工廠。這種敏捷性正在加速數位轉型進程,並鞏固雲端作為生產監控市場創新預設「沙盒」的地位。
區域分析
到2025年,亞太地區將佔據生產監控市場33.70%的佔有率。中國正在全國推廣工業4.0,而在印度,儘管基礎設施不足,但獎勵計畫正在推動智慧工廠的普及。 LG電子提出的到2030年實現數兆韓元企業價值的願景,象徵該公司將人工智慧融入整個組裝單元的雄心壯志。東協地區的工廠正在利用5G專用網路實現物料流自動化,並取得兩位數的良率提升。
中東和非洲地區以10.34%的複合年成長率領先成長預期。沙烏地阿拉伯斥資900億沙幣(約240億美元)推出的製造業刺激計劃,其中包括智慧食品加工叢集,透過持續監控確保產品品質。南非的數位化措施旨在促進透明靈活的生產,但由於電力供應限制和資金籌措,實施進度緩慢。
北美和歐洲繼續保持在技術領域的領先地位。歐盟的《企業永續性報告指令》強制要求對能源消耗進行自動化測量,這推動了對碳排放追蹤儀錶板的投資。北美企業主管正優先考慮員工技能再培訓,其中73%的企業規劃開展項目,以提高員工運用數據進行決策的能力。這些趨勢確保了即使新興經濟體經歷快速成長,市場需求仍然穩定。
其他好處:
- Excel格式的市場預測(ME)表
- 3個月的分析師支持
目錄
第1章:引言
- 研究假設和市場定義
- 調查範圍
第2章:調查方法
第3章執行摘要
第4章 市場狀況
- 市場概覽
- 市場促進因素
- 對集中式監控和預測性維護的需求
- 引入用於即時可視化的工業物聯網平台
- 透過工業4.0擴展智慧工廠概念
- 引進邊緣人工智慧進行異常檢測
- 促進能源效率資訊揭露方面的法規
- 擴大綠色生產認證的追蹤範圍
- 市場限制因素
- 資料安全和隱私問題
- 初始整合成本相對較高。
- 遺留資產中OT協議的不統一性
- OT網路安全人員短缺
- 價值供應鏈分析
- 監理情勢
- 技術展望
- 波特五力模型
第5章 市場規模與成長預測
- 按組件
- 解決方案
- 服務
- 不同的發展
- 雲
- 現場
- 透過使用
- 業務流程最佳化
- 物流和供應鏈管理
- 緊急和事件管理
- 自動化與控制管理
- 最終用戶
- 石油和天然氣
- 化學品
- 車
- 能源與電力
- 食品/飲料
- 航太/國防
- 醫療保健和生命科學
- 其他
- 按地區
- 北美洲
- 美國
- 加拿大
- 墨西哥
- 南美洲
- 巴西
- 阿根廷
- 其他南美國家
- 歐洲
- 德國
- 英國
- 法國
- 義大利
- 西班牙
- 俄羅斯
- 其他歐洲國家
- 亞太地區
- 中國
- 印度
- 日本
- 韓國
- 澳洲和紐西蘭
- ASEAN-5
- 其他亞太國家
- 中東和非洲
- 中東
- 海灣合作理事會國家
- 土耳其
- 其他中東國家
- 非洲
- 南非
- 奈及利亞
- 埃及
- 其他非洲國家
- 中東
- 北美洲
第6章 競爭情勢
- 市場集中度
- 策略趨勢
- 市佔率分析
- 公司簡介
- Siemens AG
- Schneider Electric SE
- Emerson Electric Co.
- Rockwell Automation Inc.
- Honeywell International Inc.
- ABB Ltd.
- GE Digital
- Capgemini SE
- Oracle Corporation
- SAP SE
- IBM Corporation
- PTC Inc.
- Dassault Systemes SE(DELMIA)
- AVEVA Group plc
- National Instruments Corp.
- Aspen Technology Inc.
- ATS Automation Tooling Systems
- Konecranes Oyj
- Cognex Corporation
- Ignition(Inductive Automation)
- OSIsoft LLC(AVEVA)
- Hexagon AB
- Hitachi Vantara LLC
- Yokogawa Electric Corp.
第7章 市場機會與未來展望
According to Mordor Intelligence, the production monitoring market size was valued at USD 6.47 billion in 2025 and estimated to grow from USD 7.03 billion in 2026 to reach USD 10.63 billion by 2031, at a CAGR of 8.62% during the forecast period (2026-2031).
This report is Segmented by Component (Solutions, Services), Deployment (Cloud, On-Premise), Application (Business Process Optimization, Logistics and Supply-Chain Management, and More), End User (Oil and Gas, Chemical, Automotive, Energy and Power, Food and Beverage, and More), and by Geography. The Market Forecasts are Provided in Terms of Value (USD).
Global Production Monitoring Market Trends and Insights
Demand for Centralized Monitoring and Predictive Maintenance
Manufacturers are consolidating asset data across plants to create single sources of truth that feed AI maintenance models. Zebra Technologies reported that only 16% of producers had real-time shop-floor visibility in 2024, exposing a sizeable performance gap. Automotive groups adopting predictive analytics reduced unplanned breakdowns by up to 70% and unlocked USD 100 million in lifetime equipment value by optimizing edge infrastructure. Production managers therefore view predictive maintenance as a profit lever, not merely a cost-avoidance tool, elevating demand for platforms that integrate vibration, temperature, and pressure data into actionable health scores.
Adoption of IIoT Platforms for Real-Time Visibility
IIoT suites now orchestrate machines, workers, and logistics streams in a single digital fabric. A 5G rollout at Midea Thailand delivered 15-20% productivity gains by unifying robotics and AI inspection flows. Sensor modules such as TDK's i3 Micro integrate multi-modal data in a postage-stamp form factor, enabling brownfield sites to join data lakes without heavy retrofits. Tier-two suppliers benefit because cloud edge gateways compress deployment costs, lowering barriers to entry in the Production monitoring market.
Data-Security and Privacy Concerns
Connected factories widen the attack surface. The 2024 VOID Report showed that automated systems can amplify incidents when mis-configured, forcing operators to intervene manually.EU manufacturers must now comply with stringent data-governance rules, driving interest in blockchain-based traceability that preserves transparency while hardening privacy.
Other drivers and restraints analyzed in the detailed report include:
- Expansion of Industry 4.0 Smart-Factory Initiatives
- Edge-AI Deployment for Anomaly Detection
- High Upfront Integration Costs
For complete list of drivers and restraints, kindly check the Table Of Contents.
Segment Analysis
Solutions captured 61.20% of the Production monitoring market in 2025, reflecting entrenched hardware and platform sales. Services, however, will expand faster at 9.62% CAGR to 2031 as organisations confront protocol heterogeneity and workforce skill gaps. Emerson's DeltaV update illustrates why: the feature pack lets utilities migrate from third-party controls while retaining legacy I/O, yet successful adoption hinges on specialist integrators who re-map tags and validate safety logic. Managed analytics and continuous optimisation contracts therefore secure recurring revenue streams for vendors and enable plant teams to scale expertise without large hiring drives.
At the same time, advisory partners now bundle change-management playbooks with technical deployments. Clients realise that organisational workflows must evolve to exploit AI insights, not simply display dashboards. This services-first mind-set reinforces a virtuous circle where solution providers embed deeper in customer operations, enlarging lifetime value in the Production monitoring market.
Cloud options held 57.40% of the Production monitoring market in 2025, advancing at a 9.31% CAGR as manufacturers favour elastic compute and rapid model updates. Microsoft showcases how cloud analytics decodes energy patterns to lower carbon footprints and sharpen regulatory reporting microsoft.com. Yet data-sovereignty and latency-critical tasks keep on-premise estates relevant, especially in defense and utilities where command-and-control must function under air-gapped conditions. Hybrid frameworks emerge as the governance compromise: sensitive control loops stay local, while AI-heavy workloads offload to hyperscale resources. Emerson's Ovation 4.0 wraps generative AI inside such an architecture, giving operators cloud-grade insights without sacrificing cybersecurity standards.
Enterprises also exploit pay-as-you-go OPEX models to prototype niche use cases, then scale proven blueprints across plants. That agility accelerates digital-transformation timelines and cements cloud's role as the default innovation sandbox for the Production monitoring market.
Complete Report Scope:
- By Component
- Solutions
- Services
- By Deployment
- Cloud
- On-Premise
- By Application
- Business Process Optimization
- Logistics and Supply-Chain Management
- Emergency and Incident Management
- Automation and Control Management
- By End User
- Oil and Gas
- Chemical
- Automotive
- Energy and Power
- Food and Beverage
- Aerospace and Defense
- Healthcare and Life Sciences
- Others
- By Geography
- North America
- United States
- Canada
- Mexico
- South America
- Brazil
- Argentina
- Rest of South America
- Europe
- Germany
- United Kingdom
- France
- Italy
- Spain
- Russia
- Rest of Europe
- Asia Pacific
- China
- India
- Japan
- South Korea
- Australia and New Zealand
- ASEAN-5
- Rest of Asia Pacific
- Middle East and Africa
- Middle East
- GCC Countries
- Turkey
- Rest of Middle East
- Africa
- South Africa
- Nigeria
- Egypt
- Rest of Africa
- Middle East
- North America
Geography Analysis
Asia-Pacific held 33.70% of the Production monitoring market in 2025. China scales Industry 4.0 statewide, and India's incentive programmes underwrite smart-factory deployments despite infrastructure gaps. LG Electronics' vision for multi-trillion KRW enterprise value by 2030 exemplifies corporate ambition to embed AI across assembly cells. ASEAN plants leverage 5G private networks to automate material flow, gaining double-digit yield lifts.
The Middle East and Africa lead growth prospects at 10.34% CAGR. Saudi Arabia's SAR 90 billion (USD 24 billion) manufacturing push includes smart food-processing clusters that rely on continuous monitoring to certify output quality. South Africa's digitalisation events promote transparent and flexible production, but power constraints and financing hurdles moderate rollout speed.
North America and Europe remain technology bellwethers. The EU Corporate Sustainability Reporting Directive obliges automated energy metering, prompting investments in carbon-tracking dashboards. North American executives prioritise workforce reskilling; 73% plan upskilling programmes to turn data into decisions. These dynamics ensure a steady baseline of demand even as emerging economies surge.
- Siemens AG
- Schneider Electric SE
- Emerson Electric Co.
- Rockwell Automation Inc.
- Honeywell International Inc.
- ABB Ltd.
- GE Digital
- Capgemini SE
- Oracle Corporation
- SAP SE
- IBM Corporation
- PTC Inc.
- Dassault Systemes SE (DELMIA)
- AVEVA Group plc
- National Instruments Corp.
- Aspen Technology Inc.
- ATS Automation Tooling Systems
- Konecranes Oyj
- Cognex Corporation
- Ignition (Inductive Automation)
- OSIsoft LLC (AVEVA)
- Hexagon AB
- Hitachi Vantara LLC
- Yokogawa Electric Corp.
Additional Benefits:
- The market estimate (ME) sheet in Excel format
- 3 months of analyst support
TABLE OF CONTENTS
1 INTRODUCTION
- 1.1 Study Assumptions and Market Definition
- 1.2 Scope of the Study
2 RESEARCH METHODOLOGY
3 EXECUTIVE SUMMARY
4 MARKET LANDSCAPE
- 4.1 Market Overview
- 4.2 Market Drivers
- 4.2.1 Demand for centralized monitoring and predictive maintenance
- 4.2.2 Adoption of IIoT platforms for real-time visibility
- 4.2.3 Expansion of Industry 4.0 smart-factory initiatives
- 4.2.4 Edge-AI deployment for anomaly detection
- 4.2.5 Regulatory push for energy-efficiency disclosures
- 4.2.6 Growth of green-production certification tracking
- 4.3 Market Restraints
- 4.3.1 Data-security and privacy concerns
- 4.3.2 High upfront integration costs
- 4.3.3 OT-protocol heterogeneity in legacy assets
- 4.3.4 Shortage of OT-cybersecurity talent
- 4.4 Value / Supply-Chain Analysis
- 4.5 Regulatory Landscape
- 4.6 Technological Outlook
- 4.7 Porter's Five Forces
- 4.7.1 Threat of New Entrants
- 4.7.2 Bargaining Power of Buyers
- 4.7.3 Bargaining Power of Suppliers
- 4.7.4 Threat of Substitutes
- 4.7.5 Intensity of Competitive Rivalry
5 MARKET SIZE AND GROWTH FORECASTS (VALUE)
- 5.1 By Component
- 5.1.1 Solutions
- 5.1.2 Services
- 5.2 By Deployment
- 5.2.1 Cloud
- 5.2.2 On-Premise
- 5.3 By Application
- 5.3.1 Business Process Optimization
- 5.3.2 Logistics and Supply-Chain Management
- 5.3.3 Emergency and Incident Management
- 5.3.4 Automation and Control Management
- 5.4 By End User
- 5.4.1 Oil and Gas
- 5.4.2 Chemical
- 5.4.3 Automotive
- 5.4.4 Energy and Power
- 5.4.5 Food and Beverage
- 5.4.6 Aerospace and Defense
- 5.4.7 Healthcare and Life Sciences
- 5.4.8 Others
- 5.5 By Geography
- 5.5.1 North America
- 5.5.1.1 United States
- 5.5.1.2 Canada
- 5.5.1.3 Mexico
- 5.5.2 South America
- 5.5.2.1 Brazil
- 5.5.2.2 Argentina
- 5.5.2.3 Rest of South America
- 5.5.3 Europe
- 5.5.3.1 Germany
- 5.5.3.2 United Kingdom
- 5.5.3.3 France
- 5.5.3.4 Italy
- 5.5.3.5 Spain
- 5.5.3.6 Russia
- 5.5.3.7 Rest of Europe
- 5.5.4 Asia Pacific
- 5.5.4.1 China
- 5.5.4.2 India
- 5.5.4.3 Japan
- 5.5.4.4 South Korea
- 5.5.4.5 Australia and New Zealand
- 5.5.4.6 ASEAN-5
- 5.5.4.7 Rest of Asia Pacific
- 5.5.5 Middle East and Africa
- 5.5.5.1 Middle East
- 5.5.5.1.1 GCC Countries
- 5.5.5.1.2 Turkey
- 5.5.5.1.3 Rest of Middle East
- 5.5.5.2 Africa
- 5.5.5.2.1 South Africa
- 5.5.5.2.2 Nigeria
- 5.5.5.2.3 Egypt
- 5.5.5.2.4 Rest of Africa
- 5.5.5.1 Middle East
- 5.5.1 North America
6 COMPETITIVE LANDSCAPE
- 6.1 Market Concentration
- 6.2 Strategic Moves
- 6.3 Market Share Analysis
- 6.4 Company Profiles (includes Global level Overview, Recent Developments)
- 6.4.1 Siemens AG
- 6.4.2 Schneider Electric SE
- 6.4.3 Emerson Electric Co.
- 6.4.4 Rockwell Automation Inc.
- 6.4.5 Honeywell International Inc.
- 6.4.6 ABB Ltd.
- 6.4.7 GE Digital
- 6.4.8 Capgemini SE
- 6.4.9 Oracle Corporation
- 6.4.10 SAP SE
- 6.4.11 IBM Corporation
- 6.4.12 PTC Inc.
- 6.4.13 Dassault Systemes SE (DELMIA)
- 6.4.14 AVEVA Group plc
- 6.4.15 National Instruments Corp.
- 6.4.16 Aspen Technology Inc.
- 6.4.17 ATS Automation Tooling Systems
- 6.4.18 Konecranes Oyj
- 6.4.19 Cognex Corporation
- 6.4.20 Ignition (Inductive Automation)
- 6.4.21 OSIsoft LLC (AVEVA)
- 6.4.22 Hexagon AB
- 6.4.23 Hitachi Vantara LLC
- 6.4.24 Yokogawa Electric Corp.
7 MARKET OPPORTUNITIES AND FUTURE OUTLOOK
- 7.1 White-space and Unmet-need Assessment

 2026年全球工業預測性維護市場報告
 2026-2030年全球預測性維護(PDM)市場
 鐵路預測性維護市場預測至2034年—全球解決方案、資產類型、技術、部署模式、最終用戶和區域分析
 能源產業的預測性維護:市場佔有率分析、產業趨勢和統計數據以及成長預測(2026-2031 年)
 製造業預測性維護市場-2026-2032年全球市場預測汽車預測性維護市場預測至2034年—按組件、部署模式、技術、動力系統、應用、最終用戶和地區分類的全球分析預測性維護平台市場:2034 年預測-按組件、部署模式、技術、應用、最終用戶和地區分類的全球分析預測維修系統市場預測至2034年-按組件、部署模式、組織規模、技術、應用、最終用戶和地區分類的全球分析預測性維護:市場佔有率分析、產業趨勢與統計、成長預測(2026-2031 年)
 電力產業預測性維護:市場機會、成長要素、產業趨勢分析及2026-2035年預測