

 |
市場調查報告書
商品編碼
2099113
零售和電子商務網路安全:市場佔有率分析、行業趨勢和統計數據以及成長預測(2026-2031 年)Cybersecurity For Retail and E-commerce - Market Share Analysis, Industry Trends & Statistics, Growth Forecasts (2026 - 2031) |
||||||

※ 本網頁內容可能與最新版本有所差異。詳細情況請與我們聯繫。
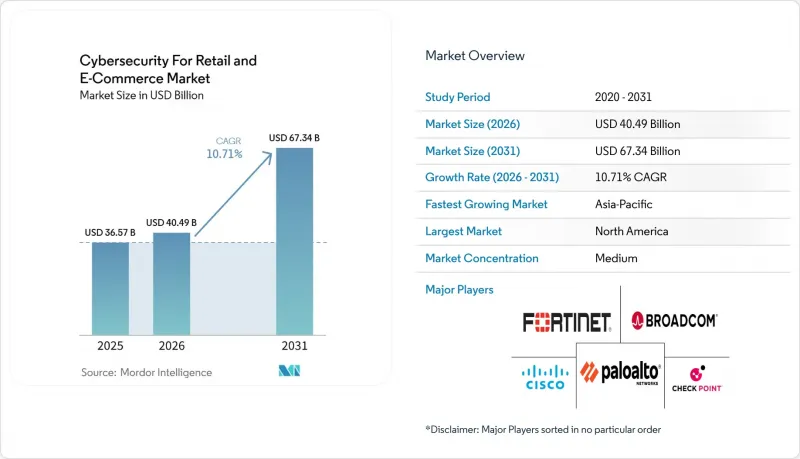
根據 Mordor Intelligence 預測,零售和電子商務網路安全市場規模預計將在 2025 年達到 365.7 億美元,2026 年達到 404.9 億美元,到 2031 年達到 673.4 億美元,2026 年至 2031 年的複合年成長率為 10.71%。
本報告按元件(解決方案和服務)、安全類型(網路安全、終端安全、應用安全等)、部署模式(雲端、本地部署、混合部署)、組織規模(大型企業和中小企業)、應用領域(支付安全等)和地區進行細分。市場預測以美元計價。
全球零售及電子商務網路安全市場趨勢及洞察
零售業帳戶詐騙和資料外洩事件的發生頻率正在增加。
零售業仍然是網路攻擊的首選目標,因為零售企業交易量龐大,持有大量憑證,並且在購物旺季期間面臨可預見的流量高峰。零售業的年度安全事件數量從2023年的725起增加到2024年的837起,同期已確認的資料外洩事件也從369起增加到419起。經濟負擔也不斷加重;根據LexisNexis Risk Solutions的一份報告,到2026年,美國零售和電子商務企業因詐欺造成的總成本將達到每1美元直接損失5.13美元。憑證網路釣魚仍然是主要威脅之一,2024年美國聯邦調查局(FBI)收到了193,407起網路釣魚申訴。這種情況正在改變零售和電子商務網路安全市場的採購行為,企業越來越傾向於尋求能夠整合身分、詐欺和安全遙測功能的工具,而不是依賴單一的控制點。因此,對以身分為中心的平台以及可降低整個數位零售營運中資料外洩風險和詐欺相關損失的託管偵測和回應服務的需求日益成長。
人工智慧驅動的詐欺和機器人攻擊
生成式人工智慧的出現降低了發動針對零售商和線上市場的大規模自動化攻擊所需的時間、技能和成本。根據 HUMAN Security 的研究,2025 年 1 月至 12 月,零售和電子商務平台上的人工智慧驅動流量成長了 187%,而基於代理商的瀏覽器流量則年增了 7851%。由於無害自動化和惡意自動化之間的行為特徵差異僅為 0.5 個百分點,因此偵測難度日益增加。到 2025 年,零售和電子商務行業將佔帳戶盜用嘗試的 54.92% 和卡片詐騙攻擊的 71.75%,這表明其在自動化詐欺宣傳活動中扮演核心角色。 Visa 也報告稱,近幾個月來惡意機器人交易增加了 25%,而受基於代理的商務擴張推動,美國電子商務的交易量成長了 40%。因此,零售和電子商務網路安全的角色正在從傳統的邊界防禦擴展到行為人工智慧、交易意圖分析和代理身分管理。
安全工具的激增及其整合的複雜性。
零售業的安全團隊常常過度管理冗餘工具,導致可見度下降而非控制力提升。平均每家公司使用 85 個 SaaS 應用,55% 的安全團隊表示雲端環境比本地環境更難管理,加重了整合負擔。在零售業,這種負擔分散在 POS 系統、網路商店、行動應用程式、忠誠度計畫和第三方 API 等各個方面,而這些系統均由不同的供應商提供,且安全要求各不相同。當每項控制措施都基於獨立的資料模型時,關聯威脅訊號就變得困難,這種延遲可能導致小事件升級為大範圍的安全漏洞。根據 RH-ISAC 的一項調查,零售和酒店業的 70% 的首席資訊安全長 (CISO) 發現人工智慧管治被納入了他們現有的職責範圍,但他們對 2026 年團隊規模的預期基本上保持不變。因此,整合是整個零售和電子商務網路安全領域的一個明確主題,但這種轉型耗時費力,阻礙了部署效率的短期提升。
細分市場分析
至2025年,解決方案將佔零售和電商網路安全市場63.51%的佔有率。這表明零售商仍然將相當一部分支出用於軟體和平台部署。這種主導地位反映了企業對整合身分管理、機器人防護、應用安全、詐欺預防和偵測工作流程於單一營運模式的架構的需求。擁有大規模IT團隊的大型零售商繼續青睞這些整合解決方案,因為他們需要在實體店和數位通路之間進行廣泛的管理。隨著零售商對供應商數量的減少以及面向客戶和內部系統資料模型的簡化需求日益成長,解決方案領域也受益於平台整合。因此,即使在日益複雜的營運環境中,零售和電商網路安全市場的核心仍與產品主導的支出緊密相連。
預計2026年至2031年,服務業的複合年成長率將達到15.97%,在所有組成部分中增速最為強勁。零售業首席資訊安全長(CISO)最常將滲透測試和安全營運中心(SOC)職能外包,這顯示人員壓力直接推動了服務需求。隨著人工智慧管治加重現有經營團隊的工作量,而團隊規模的成長速度卻未能與之同步,對外部支援的需求進一步增加。中型零售商是這一趨勢的主要體現,因為許多中型零售商缺乏專門的內部安全團隊,需要託管式檢測與回應(D&R)支援。隨著時間的推移,預計這一趨勢將在不影響軟體平台核心作用的前提下,縮小零售和電子商務網路安全市場中解決方案與服務之間的差距。
到2025年,應用安全將佔零售和電商網路安全市場佔有率的26.73%,成為最大的安全領域。這是因為零售業的攻擊面始於應用層。根據Akamai發布的2025年報告,2024年電商產業遭受了超過2,300億次Web應用程式和API攻擊,這意味著保護Web、API和結帳流程仍然是企業支出的重中之重。這種情況也反映出一個簡單的事實:客戶登入、購物車、會員入口網站和付款頁面仍然是現代商業系統中最脆弱的部分。端點和網路安全仍然很重要,但如今它們扮演著更基礎的角色,而非零售業的主要防線。機器人管理、身分和存取管理、資料安全以及安全資訊和事件管理(SIEM)都受益於這種向以使用者為中心和交易關聯的風險管理模式的轉變。
預計從2026年到2031年,雲端安全將以17.61%的複合年成長率成長,成為該市場中成長最快的安全領域。這一成長速度反映了零售工作負載向超大規模資料中心業者和SaaS環境的轉移,傳統工具已無法充分滿足彈性API主導營運的需求。零售商需要能夠保護即時庫存API、客戶ID儲存和結帳系統且不會引入過多延遲的雲端控制措施。 PCI DSS 4.0也推動了這一趨勢,因為具有內建自動化功能的雲端原生環境更容易維護更強大的身份驗證和應用程式保護規則。隨著零售和電子商務網路安全市場的擴張,雲端安全預計將繼續蠶食為舊基礎設施模式所建構的緩慢的、事後補救的模式的市場佔有率。
區域分析
2025年,北美仍將保持其最大區域市場的地位,佔據零售和電子商務網路安全市場佔有率的38.19%。該地區受益於大規模的企業零售商群體、成熟的供應商生態系統以及數位詐騙造成的高額損失。 Visa的報告顯示,近幾個月來,美國透過惡意機器人的電子商務交易增加了40%,顯示網路威脅情況十分活躍。 LexisNexis的一項研究發現,信用卡交易占美國電子商務企業詐欺損失的31%,而加拿大的詐欺成本損失率為每1美元直接損失5.23美元。董事會層級的監督也正在推動需求成長,2026年版的《董事會網路風險監督手冊》重申了對網路韌性和風險可見度管治的期望。
在歐洲,受監管、供應鏈義務以及商業系統對API過度依賴的影響,市場呈現兩極化的需求模式。德國修訂後的BSI法案顯著擴大了合規市場規模,該法案將NIS2義務的適用期限延長至2025年12月6日,並將受監管營業單位數量從4500家增加到29500家。根據Akamai的報告,2023年至2024年間,歐洲、中東和非洲地區(EMEA)共記錄了1160億次網路攻擊,其中540億次與電子商務相關,而EMEA地區針對電子商務的攻擊中,63%的目標是API。因此,德國、英國和法國仍然是歐洲應用安全、託管偵測和合規相關零售保全服務的主要需求中心。
預計亞太地區在2026年至2031年間將以17.64%的複合年成長率成長,成為零售和電子商務網路安全市場成長最快的區域板塊。根據LexisNexis的報告,該地區的詐欺攻擊率年增12%,到2025年達到1.7%,超過全球平均。中國、印度和東南亞的超級應用生態系統正在將支付、社交互動和商業整合到一個統一的環境中,從而提高了每個被盜帳戶的價值。中國的《個人資訊保護法》和印度的《數位個人資料保護法》也對零售商設計資料安全和客戶身分架構產生了重大影響。日本將於2026年4月啟動分銷資訊共享與分析中心(Distribution ISAC),這標誌著零售業正在朝著協調一致的網路防禦方向發展,而韓國和澳洲也積極採用雲端原生安全措施。
其他好處:
- Excel格式的市場預測(ME)表
- 3個月的分析師支持
目錄
第1章:引言
- 研究假設和市場定義
- 調查範圍
第2章:調查方法
第3章執行摘要
第4章 市場狀況
- 市場概覽
- 市場促進因素
- 個人帳號劫持和撞庫人員編制的發生頻率正在增加。
- 全通路零售的擴張與統一商務的攻擊面
- 將雲端原生零售應用程式和 API 納入主流
- 利用人工智慧進行詐欺和機器人操縱,目標是支付、會員計劃和促銷活動。
- 零售商正擴大採用代幣化、零信任和以身分為中心的安全技術。
- 董事會層面不僅越來越重視合規性,也越來越重視收入保障。
- 市場限制因素
- 零售、網路和行動環境中安全工具整合的激增和複雜性。
- 零售業安保人員和防詐欺專業知識短缺。
- 中型零售和電子商務企業的預算敏感性
- 增加支付流程複雜性的安全措施可能會導致轉換率降低和實施延遲。
- 宏觀經濟因素對市場的影響
- 產業價值鏈分析
- 監理情勢
- 技術展望
- 波特五力分析
第5章 市場規模與成長預測
- 按組件
- 解決方案
- 服務
- 按安全類型
- 網路安全
- 端點安全
- 應用程式安全
- 雲端安全
- 身分和存取管理 (IAM)
- 資料安全和加密
- 機器人管理
- 安全資訊和事件管理 (SIEM)
- 部署模式
- 雲
- 現場
- 混合
- 按組織規模
- 大公司
- 小型企業
- 透過使用
- 支付安全
- 詐欺檢測與預防
- 帳戶劫持預防
- 反機器人措施
- API 安全性
- 資料保護和隱私
- 合規管理
- 品牌保護和反釣魚措施
- 按地區
- 北美洲
- 美國
- 加拿大
- 墨西哥
- 南美洲
- 巴西
- 阿根廷
- 其他南美國家
- 歐洲
- 德國
- 英國
- 法國
- 義大利
- 西班牙
- 俄羅斯
- 其他歐洲國家
- 亞太地區
- 中國
- 日本
- 印度
- 韓國
- 澳洲
- 其他亞太國家
- 中東和非洲
- 中東
- 沙烏地阿拉伯
- 阿拉伯聯合大公國
- 土耳其
- 其他中東國家
- 非洲
- 南非
- 奈及利亞
- 其他非洲國家
- 中東
- 北美洲
第6章 競爭情勢
- 市場集中度
- 策略趨勢
- 市佔率分析
- 公司簡介
- Fortinet, Inc.
- Palo Alto Networks, Inc.
- Check Point Software Technologies Ltd.
- Cisco Systems, Inc.
- Broadcom Inc.
- Microsoft Corporation
- CrowdStrike Holdings, Inc.
- Trend Micro Incorporated
- Akamai Technologies, Inc.
- IBM Corporation
- Proofpoint, Inc.
- Zscaler, Inc.
- Cloudflare, Inc.
- Gen Digital Inc.
- Forter, Inc.
- Signifyd, Inc.
- Riskified Ltd.
- HUMAN Security, Inc.
- Fraud.net, Inc.
- DataDome
第7章 市場機會與未來展望
According to Mordor Intelligence, the cybersecurity for retail and E-commerce Market size is projected to be USD 36.57 billion in 2025, USD 40.49 billion in 2026, and reach USD 67.34 billion by 2031, growing at a CAGR of 10.71% from 2026 to 2031.
This report is Segmented by Component (Solutions, and Services), Security Type (Network Security, Endpoint Security, Application Security, and More), Deployment Mode (Cloud, On-Premises, and Hybrid), Organization Size (Large Enterprises, and Small and Medium Enterprises), Application (Payment Security, and More), and Geography. The Market Forecasts are Provided in Terms of Value (USD).
Global Cybersecurity For Retail and E-commerce Market Trends and Insights
Rising Frequency of Retail Account Fraud and Data Breaches
Retail remains a favored target because merchants process large transaction volumes, hold dense pools of credentials, and face predictable traffic spikes during major shopping periods. Annual retail security incidents rose to 837 in 2024 from 725 in 2023, and confirmed breaches increased to 419 from 369 over the same period. The financial burden is also getting heavier, with LexisNexis Risk Solutions reporting that total fraud costs reached USD 5.13 for every USD 1 of direct loss for United States retail and e-commerce businesses in 2026. Credential phishing still remains a large part of the threat mix, and the FBI received 193,407 phishing complaints in 2024. This is changing buying behavior inside the Cybersecurity For Retail and E-commerce Market, because merchants increasingly want tools that connect identity, fraud, and security telemetry instead of separate point controls. The result is a stronger demand for identity-centric platforms, managed detection, and response services that can lower both breach exposure and downstream fraud losses across digital retail operations.
AI-Assisted Fraud and Bot Operations
Generative AI has reduced the time, skill, and cost needed to launch large automated attacks against merchants and online marketplaces. HUMAN Security found that AI-driven traffic on retail and e-commerce platforms grew 187% from January to December 2025, while agentic browser traffic surged 7,851% year over year. The detection problem is becoming harder because only 0.5 percentage points separate the behavioral fingerprint of benign automation from malicious automation. Retail and e-commerce absorbed 54.92% of attempted account takeover attacks and 71.75% of carding attacks in 2025, which shows how central this sector has become in automated fraud campaigns. Visa also reported a 25% increase in malicious bot-initiated transactions over recent months, with United States e-commerce seeing a 40% increase as agentic commerce expands. This is widening the role of cybersecurity for the retail and e-commerce market beyond standard perimeter defense and toward behavioral AI, transaction intent analysis, and agent identity control.
Security Tool Sprawl and Integration Complexity
Retail security teams often manage too many overlapping tools, and that creates visibility gaps instead of stronger control. The average enterprise uses 85 SaaS applications, and 55% of security teams say cloud environments are harder to manage than on-premises environments, which adds to the integration burden. In retail, that burden is spread across point-of-sale systems, online storefronts, mobile apps, loyalty programs, and third-party APIs, all with separate vendors and different security needs. Threat signals become harder to correlate when each control works from a separate data model, and that delay can let a small incident expand into a broad breach. RH-ISAC found that 70% of retail and hospitality CISOs had AI governance added to their existing responsibilities, while team size expectations for 2026 stayed largely unchanged. This makes consolidation a clear theme across the Cybersecurity For Retail and E-commerce Market, but the shift takes time and holds back near-term deployment efficiency.
Other drivers and restraints analyzed in the detailed report include:
- Expansion of Omnichannel Retail and Attack Surface Complexity
- Mainstreaming of Cloud-Native Retail Platforms
- Shortage of Retail-Specific Security Talent
For complete list of drivers and restraints, kindly check the Table Of Contents.
Segment Analysis
Solutions held 63.51% of the Cybersecurity For Retail and E-commerce Market in 2025, which shows that retailers still place most spending behind software and platform deployments. That lead reflects enterprise demand for integrated architectures that combine identity management, bot mitigation, application security, fraud prevention, and detection workflows inside one operating model. Large merchants with bigger IT teams continue to favor these integrated solution stacks because they need broad control across physical and digital channels. The solutions side also benefits from platform consolidation, since retailers increasingly want fewer vendors and a cleaner data model across customer-facing and internal systems. That keeps the core of the Cybersecurity For Retail and E-commerce Market tied to product-led spending, even as the operating environment grows more complex.
Services are projected to grow at a 15.97% CAGR from 2026 to 2031, which makes this the stronger expansion story within the component split. Retail CISOs most often outsource penetration testing and security operations center functions, indicating that staffing pressure is directly driving service demand. The need for outside help is rising further because AI governance has been added to existing leadership workloads, while team sizes are not expanding at the same pace. Mid-market merchants are a major part of this trend because many do not have a dedicated in-house security team and need managed detection and response support. Over time, that pattern should narrow the solutions-to-services gap across the Cybersecurity For Retail and E-commerce Market without displacing the central role of software platforms.
Application security held 26.73% of the Cybersecurity For Retail and E-commerce Market share in 2025, making it the largest security type because the retail attack surface starts at the application layer. Akamai's 2025 report showed that commerce drew more than 230 billion web application and API attacks in 2024, which kept web, API, and checkout protection at the center of merchant spending. That position also reflects the simple fact that customer logins, shopping carts, loyalty portals, and payment pages remain the most exposed parts of modern commerce systems. Endpoint and network security still matter, but they now serve more as foundational layers than as the main line of retail defense. Bot management, identity and access management, data security, and SIEM are all benefiting from the same shift toward user-facing, transaction-linked risk control.
Cloud security is forecast to grow at a 17.61% CAGR from 2026 to 2031, making it the fastest-growing security type in this market. This pace reflects the migration of retail workloads to hyperscaler and SaaS environments, where older tools do not fit well with elastic and API-driven operations. Retailers need cloud controls that can protect real-time inventory APIs, customer identity stores, and checkout systems without adding too much latency. PCI DSS 4.0 is also reinforcing this move, because stronger authentication and application protection rules are easier to maintain in cloud-native environments with built-in automation. As the cybersecurity market for retail and e-commerce expands, cloud security should continue to gain share from slower, retrofitted models built for earlier infrastructure patterns.
Complete Report Scope:
- By Component
- Solutions
- Services
- By Security Type
- Network Security
- Endpoint Security
- Application Security
- Cloud Security
- Identity and Access Management (IAM)
- Data Security and Encryption
- Bot Management
- Security Information and Event Management (SIEM)
- By Deployment Mode
- Cloud
- On-Premises
- Hybrid
- By Organization Size
- Large Enterprises
- Small and Medium Enterprises
- By Application
- Payment Security
- Fraud Detection and Prevention
- Account Takeover Prevention
- Bot Mitigation
- API Security
- Data Protection and Privacy
- Compliance Management
- Brand Protection and Anti-Phishing
- By Geography
- North America
- United States
- Canada
- Mexico
- South America
- Brazil
- Argentina
- Rest of South America
- Europe
- Germany
- United Kingdom
- France
- Italy
- Spain
- Russia
- Rest of Europe
- Asia-Pacific
- China
- Japan
- India
- South Korea
- Australia
- Rest of Asia-Pacific
- Middle East and Africa
- Middle East
- Saudi Arabia
- United Arab Emirates
- Turkey
- Rest of the Middle East
- Africa
- South Africa
- Nigeria
- Rest of Africa
- Middle East
- North America
Geography Analysis
North America held 38.19% of the Cybersecurity For Retail and E-commerce Market share in 2025, which kept it as the largest regional market. The region benefits from a dense base of enterprise retailers, a mature vendor ecosystem, and a high burden of digital fraud. Visa reported a 40% increase in malicious bot-initiated e-commerce transactions in the United States over recent months, which shows how active the threat environment remains. LexisNexis found that card transactions accounted for 31% of fraud costs for United States e-commerce merchants, while Canada's fraud cost multiplier reached USD 5.23 for every USD 1 of direct loss. Board-level oversight is also supporting demand, with the 2026 Director's Handbook on Cyber-Risk Oversight reinforcing governance expectations around cyber resilience and risk visibility.
Europe shows a split demand pattern that is being shaped by regulation, supply chain obligations, and heavy API exposure in commerce systems. Germany's revised BSI Act extended NIS2 obligations from December 6, 2025, and expanded the affected entity base from 4,500 to 29,500 enterprises, which materially widened the compliance market. Akamai reported that EMEA recorded 116 billion web attacks across 2023 and 2024, with commerce accounting for 54 billion and 63% of attacks against EMEA commerce targeting APIs. Germany, the United Kingdom, and France, therefore, remain the core European demand centers for application security, managed detection, and compliance-linked retail security services.
Asia-Pacific is projected to grow at a 17.64% CAGR from 2026 to 2031, which makes it the fastest-growing regional segment in the Cybersecurity For Retail and E-commerce Market. LexisNexis reported that the region's fraud attack rate rose 12% year over year in 2025 to 1.7%, which was above the global average. Super-app ecosystems in China, India, and Southeast Asia combine payments, social interaction, and commerce in one environment, which raises the value of each compromised account. China's PIPL and India's Digital Personal Data Protection Act are also shaping how retailers design data security and customer identity architecture. Japan's Ryutsu ISAC launch in April 2026 shows a regional move toward coordinated retail cyber defense, while South Korea and Australia remain strong adopters of cloud-native controls.
- Fortinet, Inc.
- Palo Alto Networks, Inc.
- Check Point Software Technologies Ltd.
- Cisco Systems, Inc.
- Broadcom Inc.
- Microsoft Corporation
- CrowdStrike Holdings, Inc.
- Trend Micro Incorporated
- Akamai Technologies, Inc.
- IBM Corporation
- Proofpoint, Inc.
- Zscaler, Inc.
- Cloudflare, Inc.
- Gen Digital Inc.
- Forter, Inc.
- Signifyd, Inc.
- Riskified Ltd.
- HUMAN Security, Inc.
- Fraud.net, Inc.
- DataDome
Additional Benefits:
- The market estimate (ME) sheet in Excel format
- 3 months of analyst support
TABLE OF CONTENTS
1 INTRODUCTION
- 1.1 Study Assumptions and Market Definition
- 1.2 Scope of the Study
2 RESEARCH METHODOLOGY
3 EXECUTIVE SUMMARY
4 MARKET LANDSCAPE
- 4.1 Market Overview
- 4.2 Market Drivers
- 4.2.1 Rising Frequency of Retail Account Takeover and Credential Stuffing
- 4.2.2 Expansion of Omnichannel Retail and Unified Commerce Attack Surface
- 4.2.3 Mainstreaming of Cloud-Native Retail Applications and APIs
- 4.2.4 AI-Assisted Fraud and Bot Operations Targeting Checkout, Loyalty, and Promotions
- 4.2.5 Rising Adoption of Tokenization, Zero Trust, and Identity-Centric Security By Retailers
- 4.2.6 Increasing Board-Level Focus on Revenue Protection, Not Just Compliance
- 4.3 Market Restraints
- 4.3.1 Security Tool Sprawl and Integration Complexity Across Store, Web, and Mobile Environments
- 4.3.2 Shortage of Retail-Specific Security Talent and Fraud Operations Expertise
- 4.3.3 Budget Sensitivity in Mid-Market Retail and E-Commerce Organizations
- 4.3.4 Security Controls That Add Checkout Friction Can Reduce Conversion and Slow Adoption
- 4.4 Impact of Macroeconomic Factors on the Market
- 4.5 Industry Value-Chain Analysis
- 4.6 Regulatory Landscape
- 4.7 Technological Outlook
- 4.8 Porter's Five Forces Analysis
- 4.8.1 Bargaining Power of Buyers
- 4.8.2 Bargaining Power of Suppliers
- 4.8.3 Threat of New Entrants
- 4.8.4 Threat of Substitutes
- 4.8.5 Intensity of Competitive Rivalry
5 MARKET SIZE AND GROWTH FORECASTS (VALUE)
- 5.1 By Component
- 5.1.1 Solutions
- 5.1.2 Services
- 5.2 By Security Type
- 5.2.1 Network Security
- 5.2.2 Endpoint Security
- 5.2.3 Application Security
- 5.2.4 Cloud Security
- 5.2.5 Identity and Access Management (IAM)
- 5.2.6 Data Security and Encryption
- 5.2.7 Bot Management
- 5.2.8 Security Information and Event Management (SIEM)
- 5.3 By Deployment Mode
- 5.3.1 Cloud
- 5.3.2 On-Premises
- 5.3.3 Hybrid
- 5.4 By Organization Size
- 5.4.1 Large Enterprises
- 5.4.2 Small and Medium Enterprises
- 5.5 By Application
- 5.5.1 Payment Security
- 5.5.2 Fraud Detection and Prevention
- 5.5.3 Account Takeover Prevention
- 5.5.4 Bot Mitigation
- 5.5.5 API Security
- 5.5.6 Data Protection and Privacy
- 5.5.7 Compliance Management
- 5.5.8 Brand Protection and Anti-Phishing
- 5.6 By Geography
- 5.6.1 North America
- 5.6.1.1 United States
- 5.6.1.2 Canada
- 5.6.1.3 Mexico
- 5.6.2 South America
- 5.6.2.1 Brazil
- 5.6.2.2 Argentina
- 5.6.2.3 Rest of South America
- 5.6.3 Europe
- 5.6.3.1 Germany
- 5.6.3.2 United Kingdom
- 5.6.3.3 France
- 5.6.3.4 Italy
- 5.6.3.5 Spain
- 5.6.3.6 Russia
- 5.6.3.7 Rest of Europe
- 5.6.4 Asia-Pacific
- 5.6.4.1 China
- 5.6.4.2 Japan
- 5.6.4.3 India
- 5.6.4.4 South Korea
- 5.6.4.5 Australia
- 5.6.4.6 Rest of Asia-Pacific
- 5.6.5 Middle East and Africa
- 5.6.5.1 Middle East
- 5.6.5.1.1 Saudi Arabia
- 5.6.5.1.2 United Arab Emirates
- 5.6.5.1.3 Turkey
- 5.6.5.1.4 Rest of the Middle East
- 5.6.5.2 Africa
- 5.6.5.2.1 South Africa
- 5.6.5.2.2 Nigeria
- 5.6.5.2.3 Rest of Africa
- 5.6.5.1 Middle East
- 5.6.1 North America
6 COMPETITIVE LANDSCAPE
- 6.1 Market Concentration
- 6.2 Strategic Moves
- 6.3 Market Share Analysis
- 6.4 Company Profiles (includes Global Level Overview, Market Level Overview, Core Segments, Financials as available, Strategic Information, Market Rank/Share, Products and Services, Recent Developments)
- 6.4.1 Fortinet, Inc.
- 6.4.2 Palo Alto Networks, Inc.
- 6.4.3 Check Point Software Technologies Ltd.
- 6.4.4 Cisco Systems, Inc.
- 6.4.5 Broadcom Inc.
- 6.4.6 Microsoft Corporation
- 6.4.7 CrowdStrike Holdings, Inc.
- 6.4.8 Trend Micro Incorporated
- 6.4.9 Akamai Technologies, Inc.
- 6.4.10 IBM Corporation
- 6.4.11 Proofpoint, Inc.
- 6.4.12 Zscaler, Inc.
- 6.4.13 Cloudflare, Inc.
- 6.4.14 Gen Digital Inc.
- 6.4.15 Forter, Inc.
- 6.4.16 Signifyd, Inc.
- 6.4.17 Riskified Ltd.
- 6.4.18 HUMAN Security, Inc.
- 6.4.19 Fraud.net, Inc.
- 6.4.20 DataDome
7 MARKET OPPORTUNITIES AND FUTURE OUTLOOK
- 7.1 White-space and Unmet-Need Assessment

 2026年全球網路安全管理市場報告
 全球油氣網路安全市場規模、佔有率、趨勢和成長分析報告(2026-2034)
 全球數位資金籌措平台市場預測至2034年:依產品類型、平台類型、部署方式、應用領域、最終用戶及地區分類網路安全市場預測至2034年—按組件、部署模式、安全類型、組織規模、最終用戶和地區分類的全球分析
 網路安全市場:按組件、安全類型、組織規模、部署模式和產業分類-2026-2032年全球市場預測
 網路安全軟體市場規模、佔有率和成長分析:按軟體類型、部署模式、企業規模、最終用戶產業、安全功能、授權模式和地區分類-2026-2033年產業預測
 鐵路與捷運網路安全市場分析及預測(至2035年):類型、產品、服務、技術、組件、應用、部署、最終用戶、解決方案
 網路風險量化與管治平台:市場佔有率分析、產業趨勢與統計、成長預測(2026-2031)
 2026-2030年全球電網網路安全市場東協網路安全:市場佔有率分析、產業趨勢與統計及成長預測(2026-2031 年)