

 |
市場調查報告書
商品編碼
2099086
網路風險量化與管治平台:市場佔有率分析、產業趨勢與統計、成長預測(2026-2031)Cyber Risk Quantification and Governance Platforms - Market Share Analysis, Industry Trends & Statistics, Growth Forecasts (2026 - 2031) |
||||||

※ 本網頁內容可能與最新版本有所差異。詳細情況請與我們聯繫。
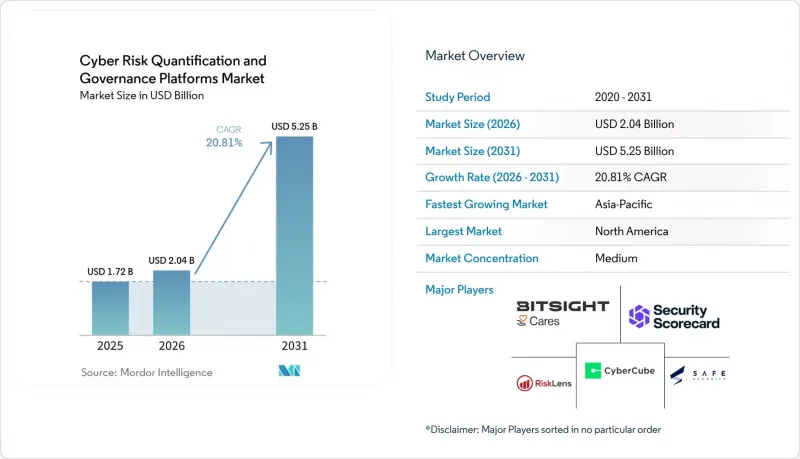
根據 Mordor Intelligence 預測,網路風險量化和管治平台的市場規模預計將在 2025 年達到 17.2 億美元,2026 年達到 20.4 億美元,到 2031 年達到 52.5 億美元,2026 年至 2031 年的複合年成長率為 20.81%。
本報告按組件(平台和服務)、部署方式(雲端、本地部署、混合部署)、企業規模(大型企業和中小企業)、最終用戶行業(銀行、金融服務和保險、醫療保健和生命科學、資訊技術和電信、零售和電子商務等)以及地區進行細分。市場預測以美元計價。
全球網路風險量化與管治平台市場趨勢及洞察
關於量化網路風險的監理揭露義務
網路風險量化和管治平台市場正獲得監管機構的直接支持。這是因為,如今人們不再僅僅從熱圖評估的角度來討論事件嚴重性和復原能力的監控,而是從財務角度出發。在美國,證券交易委員會(SEC)強制要求上市公司揭露重大網路安全事件,而XBRL標籤要求則進一步提升了這些揭露的結構化程度和審計可見度。在歐洲,DORA將於2025年1月全面實施,將提高金融機構資訊通訊技術(ICT)風險管理和文件記錄的標準。網路風險量化和管治平台市場正受益於企業需要一種方法來證明事件在財務上具有重大意義,以及如何將這些結論記錄下來並提交給董事會和監管機構。因此,採用此類平台不僅是安全現代化的一部分,也是滿足法律和管治的一部分。此外,量化的成果更容易納入審計、合規和董事會報告,這有助於彌合監管要求和預算批准之間的差距。
董事會層面需要了解財務風險。
網路風險量化和管治平台市場擴張的另一個原因是,董事會希望以美元而非技術術語來了解網路風險的規模。美國公司董事協會 (NACD) 發布的《2026 年網路監控手冊》呼籲董事會要求經營團隊對網路事件的財務影響進行建模,包括直接損失和更廣泛的業務影響。 FAIR 研究所的 2025 年報告指出,近 70% 的組織仍然沒有對網路風險進行財務量化,這凸顯了網路風險量化和管治平台的龐大未開發市場。當董事會收到量化的情境分析時,就更容易將這些數字與保險成本、網路安全措施和業務中斷風險進行比較。這使得關於網路風險的討論從抽象的估值轉向資本配置選擇。此外,市場對能夠持續更新情境分析而非依賴一次性估值週期的平台的需求也在不斷成長。
缺乏公認的量化標準
網路風險量化和管治平台市場仍然面臨許多障礙,因為買家尚未採用統一的、強制性的量化框架。儘管 FAIR v3.0 是該領域最成熟的開放標準,但 FAIR 研究所 2025 年的一項調查發現,目前只有 24% 的組織正在使用該標準,另有 22% 的組織計劃實施。許多公司需要將 FAIR 的交付成果與 NIST、ISO 和監管要求保持一致,這減緩了其普及速度,也使得供應商之間的比較變得困難。網路風險量化和管治平台市場受到影響,因為採購團隊常常難以確定兩個平台產生的損失估算是否真正具有可比性。這增加了供應商的培訓成本,並延長了尋求強大管治合法性的買家的銷售週期。在標準得到更清晰的整合之前,實施工作仍將嚴重依賴內部支持者,他們需要向董事會和審計人員解釋調查方法的選擇。
細分市場分析
至2025年,平台將佔據網路風險量化和管治平台市場72.14%的佔有率。這表明,買家仍然傾向於持續的軟體基礎設施,而不是偶爾使用的外部評估服務。此基礎設施包括網路風險量化、網路管治、第三方風險管理和網路風險敞口管理平台。雖然每個類別對應著營運模式的不同層面,但買家越來越希望將它們整合到單一的工作流程中。這一趨勢促使供應商致力於整合風險量化、董事會報告、供應商監督和風險敞口視覺化功能,而無需客戶管理各自獨立的工具。
預計到2031年,服務業將以22.94%的複合年成長率成長,這反映出將網路安全、金融、法律和保險團隊整合到統一的風險術語框架下需要付出大量努力。 FAIR研究所的一項研究發現,網路風險管理成熟度較高的組織(通常包括系統性的專案支援和實施服務)的風險降低率比所有受訪組織高出54%。實際上,這些服務不僅限於儀錶板和情境設定;它們還能幫助企業建立營運流程,就模型假設達成一致,並將結果與管治計畫聯繫起來。此外,供應商特定的情境庫和校準選項將成為客戶內部風險管理流程的一部分,從而增強客戶參與度。
在2025年網路風險量化與管治平台市場中,雲端平台佔了53.09%的佔有率。這主要得益於雲端平台更簡化的訂閱模式、快速部署以及從外部威脅和攻擊面資料來源持續資料擷取。雲端原生供應商在即時更新、網際網路資料擷取以及輕鬆擴展至分散式業務單位方面擁有顯著優勢。這種模式適用於希望縮短價值實現時間並減輕初始設定負擔的組織。對於希望在內部檢驗其方案有效性之前避免投資大規模基礎設施的中小型企業而言,雲端平台也是一個合適的選擇。
預計2026年至2031年間,混合部署將以23.05%的複合年成長率成長。這是因為即使受監管的買家需要基於雲端的智慧資料來源,他們仍然需要對敏感資料進行本地控制。歐洲銀行管理局(EBA)的DORA技術標準重申了穩健的ICT風險管理的重要性,這推動了混合部署的發展,因為混合部署必須與高度敏感的內部數據和廣泛的外部訊號協同運作。此外,Tenable在2025年發布開放連接器表明,供應商正在設計能夠靈活地將內部風險資料與廣泛的外部環境結合的架構。因此,混合部署並非權宜之計,而是網路風險量化和管治平台市場中既需要合規管理又需要持續外部可視性的買家的切實可行的長期解決方案。
區域分析
預計到2025年,北美將佔據網路風險量化和管治平台市場32.15%的佔有率,並繼續保持其在收入和企業成熟度方面的領先地位。美國證券交易委員會(SEC)的資訊揭露要求鼓勵上市公司就網路風險的重大影響提供更正式的聲明,這直接推動了對可量化成果的需求,這些成果需提交給董事會。該地區還受益於健全的網路保險生態系統,這為買家從財務角度表達風險敞口提供了另一個理由。加拿大在管治成熟度方面也走在類似的道路上,但美國憑藉其規模、董事會的嚴格審查以及從業人員的深厚專業知識,仍然是該領域的應用中心。雖然南美洲的應用仍處於起步階段,但數據管治監管的加強和數位金融服務的成長,為進入網路風險量化和管治平台市場創造了明確的機會。
歐洲仍然是第二大區域叢集,該地區的需求與合規實施密切相關。 DORA自2025年1月起全面生效,促使金融機構更加重視資訊通訊科技風險管理、彈性規劃及相關文件。德國、英國和法國是目前DORA應用的核心,這得益於其龐大的受監管企業基礎以及對管治的大力投入。義大利和西班牙也正在加速採用DORA,因為各國機構都在為更嚴格的課責和更有系統的網路監控做準備。由於制裁和限制跨境平台參與的國內技術要求,俄羅斯仍然主要不在西方供應商的目標市場之列。
預計到2031年,亞太地區將以23.38%的複合年成長率成長,並有望成為網路風險量化和管治平台市場成長最快的地區。日本正透過修訂其關鍵基礎設施風險管理指南來強化這一趨勢,新指南納入了更多結構化、基於情境的思維模式。在東南亞,許多中小企業正直接轉向雲端原生工具,而非依賴傳統的質性評估方法。儘管中東和非洲的市場規模仍然較小,但隨著數位經濟計畫和金融監管的擴展,海灣地區的機構需求正在湧現。南非和奈及利亞是非洲相對發達的市場,但隨著平台成本、工作流程複雜性和本地人才短缺等挑戰得到有效控制,預計全部區域的商業機會將會增加。
其他好處:
- Excel格式的市場預測(ME)表
- 3個月的分析師支持
目錄
第1章:引言
- 研究假設和市場定義
- 調查範圍
第2章:調查方法
第3章執行摘要
第4章 市場狀況
- 市場概覽
- 市場促進因素
- 關於量化網路風險的監理揭露義務
- 經營團隊對財務風險透明度的需求。
- 網路保險承保要求更加嚴格
- 供應鏈易受攻擊,需要進行外部風險評估
- 人工智慧驅動的即時損失預測
- 網路風險代幣化在資本配置用例中的應用
- 市場限制因素
- 缺乏公認的量化標準
- 缺乏高品質的事故損害數據
- 公司間資料共用中的隱私限制
- 缺乏獲得 FAIR 認證的定量分析師
- 產業價值鏈分析
- 監理情勢
- 技術展望
- 波特五力分析
第5章 市場規模與成長預測
- 按組件
- 平台
- 網路風險量化平台
- 網路管治平台
- 第三方風險管理平台
- 網路風險暴露管理平台
- 服務
- 平台
- 不同的發展
- 雲
- 現場
- 混合
- 按公司規模
- 大公司
- 小型企業
- 按最終用戶行業分類
- BFSI
- 醫療保健和生命科學
- 資訊科技/通訊
- 零售與電子商務
- 工業製造
- 政府/公共部門
- 其他終端用戶產業
- 按地區
- 北美洲
- 美國
- 加拿大
- 墨西哥
- 南美洲
- 巴西
- 阿根廷
- 其他南美國家
- 歐洲
- 德國
- 英國
- 法國
- 義大利
- 西班牙
- 俄羅斯
- 其他歐洲國家
- 亞太地區
- 中國
- 印度
- 日本
- 韓國
- 澳洲
- 其他亞太國家
- 中東和非洲
- 中東
- 沙烏地阿拉伯
- 阿拉伯聯合大公國
- 其他中東國家
- 非洲
- 南非
- 奈及利亞
- 其他非洲國家
- 中東
- 北美洲
第6章 競爭情勢
- 市場集中度
- 策略趨勢
- 市佔率分析
- 公司簡介
- Bitsight Technologies Inc.
- SecurityScorecard, Inc.
- Safe Security, Inc.
- RiskLens, Inc.
- CyberCube Analytics, Inc.
- Kovrr Ltd.
- Axio Global, LLC
- Balbix, Inc.
- UpGuard Pty Ltd
- Panorays Ltd.
- Black Kite, Inc.
- C-Risk SAS
- Derive Security, Inc.
- OneTrust, LLC
- MetricStream, Inc.
- Venminder, Inc.
- Prevalent, Inc.
- RapidRatings International, Inc.
- Armis, Inc.
- Tenable Holdings, Inc.
第7章 市場機會與未來展望
According to Mordor Intelligence, the cyber risk quantification and governance platforms market size is projected to be USD 1.72 billion in 2025, USD 2.04 billion in 2026, and reach USD 5.25 billion by 2031, growing at a CAGR of 20.81% from 2026 to 2031.
This report is Segmented by Component (Platforms, and Services), Deployment (Cloud, On-Premise, and Hybrid), Enterprise Size (Large Enterprises, and Small and Medium Enterprises), End-User Industry (BFSI, Healthcare and Life Sciences, Information Technology and Telecom, Retail and E-Commerce, and More), and Geography. The Market Forecasts are Provided in Terms of Value (USD).
Global Cyber Risk Quantification and Governance Platforms Market Trends and Insights
Regulatory Disclosure Mandates for Quantified Cyber Risk
The Cyber risk quantification and governance platforms market is receiving direct support from regulation, as incident materiality and resilience oversight are now discussed in financial terms rather than through simple heat maps. In the United States, the SEC requires public companies to disclose material cybersecurity incidents, and the XBRL tagging requirement has added more structure and audit visibility to those disclosures. In Europe, DORA has been fully applicable since January 2025, raising the standard for ICT risk management and documentation across financial entities. The Cyber risk quantification and governance platforms market is benefiting from the need for organizations to have a defensible way to determine when an event becomes financially material and how to document that conclusion for boards and supervisors. This makes platform adoption part of legal and governance preparation, not only part of security modernization. It also shortens the gap between regulatory demand and budget approval because quantified outputs are easier to carry into audit, compliance, and board reporting.
Board-Level Demand for Monetary Risk Visibility
The Cyber risk quantification and governance platforms market is also expanding because directors are asking for cyber exposure in dollar terms rather than in technical language. The NACD 2026 cyber oversight handbook calls on boards to ask management to model the financial implications of cyber incidents, including direct losses and broader business effects. The FAIR Institute reported in 2025 that nearly 70% of organizations still do not quantify cyber risk in monetary terms, underscoring the significant white space in the Cyber risk quantification and governance platforms market. Once boards receive quantified scenarios, those numbers become easier to compare with insurance costs, cyber controls, and business interruption exposure. That shifts cyber discussions from abstract ratings to capital-allocation choices. It also increases demand for platforms that can continuously update scenarios rather than rely on one-time assessment cycles.
Lack of Agreed Quantification Standards
The Cyber risk quantification and governance platforms market still faces friction because buyers do not work with 1 universally mandated quantification framework. FAIR v3.0 remains the most mature open standard in this area, but the FAIR Institute found in 2025 that only 24% of organizations currently use it, and another 22% plan to adopt it. Many enterprises still need to align FAIR outputs with NIST, ISO, and regulatory expectations, which slows implementation and makes vendor comparisons more difficult. The Cyber risk quantification and governance platforms market is affected because procurement teams often struggle to judge whether 2 platforms produce genuinely comparable loss estimates. This raises vendor education costs and lengthens sales cycles for buyers seeking strong governance defensibility. Until standards converge more clearly, adoption will continue to depend heavily on internal champions who can explain methodology choices to boards and auditors.
Other drivers and restraints analyzed in the detailed report include:
- Rising Cyber Insurance Underwriting Requirements
- Supply Chain Attack Exposure Requiring External Risk Scoring
- Limited High-Quality Incident Loss Data
For complete list of drivers and restraints, kindly check the Table Of Contents.
Segment Analysis
Platforms accounted for 72.14% of the Cyber risk quantification and governance market in 2025, indicating that buyers still prefer recurring software infrastructure over occasional outside assessment work. This base includes platforms for cyber risk quantification, cyber governance, third-party risk management, and cyber exposure management. Each category serves a different layer of the operating model, but buyers increasingly want them connected into a single workflow. That preference supports vendors that can combine risk quantification, board reporting, vendor monitoring, and exposure visibility without forcing clients to manage disconnected tools.
The services segment is projected to grow at a 22.94% CAGR through 2031, reflecting the work required to align cyber, finance, legal, and insurance teams around a single risk language. The FAIR Institute found that organizations with higher cyber risk management maturity, which often includes structured program support and implementation services, achieved 54% greater risk reduction than the overall respondent base. In practice, services do more than configure dashboards or scenarios. They help enterprises build operating routines, agree on model assumptions, and connect outputs to governance calendars. That also creates stickier customer relationships because vendor-specific scenario libraries and calibration choices become part of the client's internal risk process.
Cloud accounted for 53.09% of the Cyber risk quantification and governance platforms market in 2025, supported by easier subscription models, faster deployment, and continuous data ingestion from external threat and attack surface feeds. Cloud-native providers built an advantage around real-time updates, internet-facing data collection, and simpler expansion across distributed business units. That model fits organizations that want faster time-to-value and lower initial setup friction. It also aligns well with SMEs and mid-market buyers that do not want heavy infrastructure commitments before they validate the program internally.
Hybrid is projected to grow at a 23.05% CAGR from 2026 to 2031, as regulated buyers still need local control over sensitive data even when they want cloud-based intelligence feeds. The European Banking Authority's DORA technical standards reinforced the need for strong ICT risk management, which supports hybrid deployment where sensitive internal data and broader external signals must operate together. Tenable's open connector release in 2025 also showed how vendors are designing architectures that combine internal risk data with broader external context in a flexible way. Hybrid is therefore not a temporary compromise. It is becoming a practical, long-term solution for buyers who need both compliance controls and continuous external visibility in the Cyber risk quantification and governance platforms market.
Complete Report Scope:
- By Component
- Platforms
- Cyber Risk Quantification Platforms
- Cyber Governance Platforms
- Third-Party Risk Management Platforms
- Cyber Exposure Management Platforms
- Services
- Platforms
- By Deployment
- Cloud
- On-Premises
- Hybrid
- By Enterprise Size
- Large Enterprises
- Small and Medium Enterprises
- By End-user Industry
- BFSI
- Healthcare and Life Sciences
- Information Technology and Telecom
- Retail and E-commerce
- Industrial Manufacturing
- Government and Public Sector
- Other End-user Industries
- By Geography
- North America
- United States
- Canada
- Mexico
- South America
- Brazil
- Argentina
- Rest of South America
- Europe
- Germany
- United Kingdom
- France
- Italy
- Spain
- Russia
- Rest of Europe
- Asia-Pacific
- China
- India
- Japan
- South Korea
- Australia
- Rest of Asia-Pacific
- Middle East and Africa
- Middle East
- Saudi Arabia
- United Arab Emirates
- Rest of Middle East
- Africa
- South Africa
- Nigeria
- Rest of Africa
- Middle East
- North America
Geography Analysis
North America held 32.15% of the Cyber risk quantification and governance platforms market share in 2025, keeping the region in the lead in revenue and enterprise maturity. The SEC disclosure regime has pushed public companies toward a more formal view of material cyber impact, which directly supports demand for board-ready quantification outputs. The region also benefits from a strong cyber insurance ecosystem, which gives buyers another reason to express exposure in financial terms. Canada follows a similar path in terms of governance maturity, while the United States remains the center of adoption due to scale, board scrutiny, and practitioner depth. South America is still earlier in adoption, but enforcement around data governance and the growth of digital financial services are creating clearer entry points for the Cyber risk quantification and governance platforms market.
Europe remains the second-largest regional cluster, and demand there is strongly tied to compliance execution. DORA has been fully applicable since January 2025, which has increased attention on ICT risk management, resilience planning, and supporting documentation across financial entities. Germany, the United Kingdom, and France form the core of current adoption because they combine large regulated enterprise bases with deeper governance spending. Italy and Spain are also moving faster as organizations prepare for tighter accountability and more structured cyber oversight. Russia remains outside much of the addressable space for Western vendors because sanctions and domestic technology requirements limit cross-border platform participation.
Asia-Pacific is expected to grow at a 23.38% CAGR through 2031, giving it the fastest regional pace in the Cyber risk quantification and governance platforms market. Japan has strengthened this direction through updated critical infrastructure risk management guidance that includes more structured scenario-based thinking. Across Southeast Asia, many SMEs are moving directly to cloud-native tools rather than relying on older qualitative assessment methods. The Middle East and Africa remain smaller in overall size, but Gulf markets are generating institutional demand as digital economy programs and financial regulation expand. South Africa and Nigeria stand out as the more established African adoption markets, while the broader regional opportunity should improve as platform cost, workflow complexity, and local talent constraints become easier to manage.
- Bitsight Technologies Inc.
- SecurityScorecard, Inc.
- Safe Security, Inc.
- RiskLens, Inc.
- CyberCube Analytics, Inc.
- Kovrr Ltd.
- Axio Global, LLC
- Balbix, Inc.
- UpGuard Pty Ltd
- Panorays Ltd.
- Black Kite, Inc.
- C-Risk SAS
- Derive Security, Inc.
- OneTrust, LLC
- MetricStream, Inc.
- Venminder, Inc.
- Prevalent, Inc.
- RapidRatings International, Inc.
- Armis, Inc.
- Tenable Holdings, Inc.
Additional Benefits:
- The market estimate (ME) sheet in Excel format
- 3 months of analyst support
TABLE OF CONTENTS
1 INTRODUCTION
- 1.1 Study Assumptions and Market Definition
- 1.2 Scope of the Study
2 RESEARCH METHODOLOGY
3 EXECUTIVE SUMMARY
4 MARKET LANDSCAPE
- 4.1 Market Overview
- 4.2 Market Drivers
- 4.2.1 Regulatory Disclosure Mandates for Quantified Cyber Risk
- 4.2.2 Board-Level Demand For Monetary Risk Visibility
- 4.2.3 Rising Cyber-Insurance Underwriting Requirements
- 4.2.4 Supply Chain Attack Exposure Requiring External Risk Scoring
- 4.2.5 AI-Enabled Real-Time Loss Forecasting
- 4.2.6 Tokenization of Cyber Risk For Capital Allocation Use Cases
- 4.3 Market Restraints
- 4.3.1 Lack of Agreed Quantification Standards
- 4.3.2 Limited High-Quality Incident Loss Data
- 4.3.3 Privacy Constraints on Cross-Enterprise Data Sharing
- 4.3.4 Scarcity of FAIR-Certified Quant Talent
- 4.4 Industry Value-Chain Analysis
- 4.5 Regulatory Landscape
- 4.6 Technological Outlook
- 4.7 Porter's Five Forces Analysis
- 4.7.1 Bargaining Power of Buyers
- 4.7.2 Bargaining Power of Suppliers
- 4.7.3 Threat of New Entrants
- 4.7.4 Threat of Substitutes
- 4.7.5 Intensity of Competitive Rivalry
5 MARKET SIZE AND GROWTH FORECASTS (VALUE)
- 5.1 By Component
- 5.1.1 Platforms
- 5.1.1.1 Cyber Risk Quantification Platforms
- 5.1.1.2 Cyber Governance Platforms
- 5.1.1.3 Third-Party Risk Management Platforms
- 5.1.1.4 Cyber Exposure Management Platforms
- 5.1.2 Services
- 5.1.1 Platforms
- 5.2 By Deployment
- 5.2.1 Cloud
- 5.2.2 On-Premises
- 5.2.3 Hybrid
- 5.3 By Enterprise Size
- 5.3.1 Large Enterprises
- 5.3.2 Small and Medium Enterprises
- 5.4 By End-user Industry
- 5.4.1 BFSI
- 5.4.2 Healthcare and Life Sciences
- 5.4.3 Information Technology and Telecom
- 5.4.4 Retail and E-commerce
- 5.4.5 Industrial Manufacturing
- 5.4.6 Government and Public Sector
- 5.4.7 Other End-user Industries
- 5.5 By Geography
- 5.5.1 North America
- 5.5.1.1 United States
- 5.5.1.2 Canada
- 5.5.1.3 Mexico
- 5.5.2 South America
- 5.5.2.1 Brazil
- 5.5.2.2 Argentina
- 5.5.2.3 Rest of South America
- 5.5.3 Europe
- 5.5.3.1 Germany
- 5.5.3.2 United Kingdom
- 5.5.3.3 France
- 5.5.3.4 Italy
- 5.5.3.5 Spain
- 5.5.3.6 Russia
- 5.5.3.7 Rest of Europe
- 5.5.4 Asia-Pacific
- 5.5.4.1 China
- 5.5.4.2 India
- 5.5.4.3 Japan
- 5.5.4.4 South Korea
- 5.5.4.5 Australia
- 5.5.4.6 Rest of Asia-Pacific
- 5.5.5 Middle East and Africa
- 5.5.5.1 Middle East
- 5.5.5.1.1 Saudi Arabia
- 5.5.5.1.2 United Arab Emirates
- 5.5.5.1.3 Rest of Middle East
- 5.5.5.2 Africa
- 5.5.5.2.1 South Africa
- 5.5.5.2.2 Nigeria
- 5.5.5.2.3 Rest of Africa
- 5.5.5.1 Middle East
- 5.5.1 North America
6 COMPETITIVE LANDSCAPE
- 6.1 Market Concentration
- 6.2 Strategic Moves
- 6.3 Market Share Analysis
- 6.4 Company Profiles (includes Global Level Overview, Market Level Overview, Core Segments, Financials as available, Strategic Information, Market Rank/Share, Products and Services, Recent Developments)
- 6.4.1 Bitsight Technologies Inc.
- 6.4.2 SecurityScorecard, Inc.
- 6.4.3 Safe Security, Inc.
- 6.4.4 RiskLens, Inc.
- 6.4.5 CyberCube Analytics, Inc.
- 6.4.6 Kovrr Ltd.
- 6.4.7 Axio Global, LLC
- 6.4.8 Balbix, Inc.
- 6.4.9 UpGuard Pty Ltd
- 6.4.10 Panorays Ltd.
- 6.4.11 Black Kite, Inc.
- 6.4.12 C-Risk SAS
- 6.4.13 Derive Security, Inc.
- 6.4.14 OneTrust, LLC
- 6.4.15 MetricStream, Inc.
- 6.4.16 Venminder, Inc.
- 6.4.17 Prevalent, Inc.
- 6.4.18 RapidRatings International, Inc.
- 6.4.19 Armis, Inc.
- 6.4.20 Tenable Holdings, Inc.
7 MARKET OPPORTUNITIES AND FUTURE OUTLOOK
- 7.1 White-Space and Unmet-Need Assessment

 2026年全球網路安全管理市場報告
 全球油氣網路安全市場規模、佔有率、趨勢和成長分析報告(2026-2034)
 全球數位資金籌措平台市場預測至2034年:依產品類型、平台類型、部署方式、應用領域、最終用戶及地區分類網路安全市場預測至2034年—按組件、部署模式、安全類型、組織規模、最終用戶和地區分類的全球分析
 網路安全市場:按組件、安全類型、組織規模、部署模式和產業分類-2026-2032年全球市場預測
 零售和電子商務網路安全:市場佔有率分析、行業趨勢和統計數據以及成長預測(2026-2031 年)
 網路安全軟體市場規模、佔有率和成長分析:按軟體類型、部署模式、企業規模、最終用戶產業、安全功能、授權模式和地區分類-2026-2033年產業預測
 鐵路與捷運網路安全市場分析及預測(至2035年):類型、產品、服務、技術、組件、應用、部署、最終用戶、解決方案
 2026-2030年全球電網網路安全市場東協網路安全:市場佔有率分析、產業趨勢與統計及成長預測(2026-2031 年)