


 |
市場調查報告書
商品編碼
2098544
GPU中間件:市佔率分析、產業趨勢與統計、成長預測(2026-2031年)GPU Middleware - Market Share Analysis, Industry Trends & Statistics, Growth Forecasts (2026 - 2031) |
||||||

※ 本網頁內容可能與最新版本有所差異。詳細情況請與我們聯繫。
根據 Mordor Intelligence 預測,GPU 中介軟體市場預計將從 2025 年的 26.9 億美元成長到 2026 年的 36.4 億美元,到 2031 年達到 141.1 億美元,2026 年至 2031 年的複合年預計成長率為 31.12%。
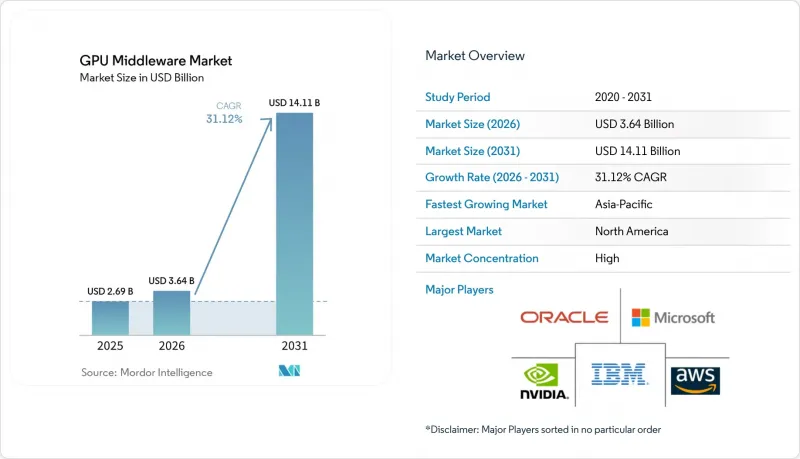
本報告按元件(軟體和服務)、部署模式(雲端、本機、混合、邊緣/嵌入式)、企業規模(大型企業和中小企業)、應用程式(虛擬桌面基礎架構和遠端工作站等)、最終用戶產業(醫療保健和生命科學等)以及地區進行細分。市場預測以價值(美元)表示。
全球GPU中介軟體市場趨勢及洞察
AI模型訓練與推理中GPU密度的增加
隨著人工智慧模型開發越來越依賴規模更大、密度更高的運算環境,GPU 中介軟體市場正在不斷擴張。 2026 年 6 月,NVIDIA 發布了 Vera Rubin 平台,這是一個機架級系統,整合了 CPU、GPU、網路和軟體,用於科學和人工智慧工作負載,展現了下一代部署的整合度日益提高。同樣在 2026 年 6 月,微軟宣佈在德克薩斯州佩科斯新建一座資料中心園區,為其人工智慧和雲端容量增加約 2 吉瓦,這反映了關鍵採購層級基礎設施的快速擴張。此外,2026 年 1 月,NVIDIA 和禮來公司聯合成立了人工智慧創新實驗室,計劃在五年內投資高達 10 億美元,這表明大規模模型工作負載正在向高度監管的商業環境擴展。隨著這些叢集的擴展,調度器、記憶體控制層和資源分配工具的運維負擔也隨之增加。這一趨勢使得 GPU 中介軟體市場與人工智慧訓練和推理規模化的新浪潮緊密相連。
企業對多租戶GPU資源共用的需求日益成長
GPU 中介軟體市場也受益於在不犧牲控制權的前提下,跨團隊、模型和工作負載共用有限 GPU 資源的需求。 2026 年 6 月,IBM 研究院、紅帽和 NxtGen Cloud 聯合發布報告稱,開放原始碼llm-d 框架將混合 GPU 硬體上的推理速度提升了 3 到 5 倍,吞吐量加倍,同時還表明,每個大規模部署每年可節省高達 525 萬美元的成本。 2026 年 3 月,NVIDIA 向 Kubernetes 社群發布了其 GPU 動態資源分配驅動程序,並將 KAI Scheduler 作為 CNCF 沙箱專案納入其中,從而使策略驅動的共用GPU 調度得到更廣泛的應用。紅帽正透過其與 NVIDIA 合作的 AI Factory 專案朝著類似的方向發展,該專案為長時間運行的作業提供資源池化、智慧編配和自動查核點。這些舉措減少了單一應用程式或團隊長時間佔用整個叢集的需求。這將促進 GPU 中介軟體市場的發展,因為多租戶控制將成為主要的購買標準,而不是可選功能。
GPU基礎架構整合成本高成本且複雜。
GPU 中介軟體市場仍面臨許多挑戰,因為擴展 GPU 基礎設施需要大量的預付資金和精心的整合。 CoreWeave 於 2026 年 3 月獲得 85 億美元的信貸額度,隨後在 2026 年 5 月又獲得 31 億美元的額外信貸。這凸顯了即使對於專業供應商而言,擴展 GPU 平台也已成為資本密集型業務。微軟在 2026 年 6 月發布的 Pecos 也強調了當前 AI 容量擴張的規模之大規模,使得小規模買家難以跟上。在部署方面,Red Hat 和 NVIDIA 聯合推出的「AI Factory」已在 Cisco、Dell Technologies、Lenovo 和 Supermicro 的硬體上進行了檢驗。這表明,實際部署通常需要跨多個層面的檢驗組合。 HPE 的「AI Factory」產品組合也遵循類似的邏輯,編配、租戶管理和企業軟體打包到經過認證的系統中。在實現方式變得更加便利和成本更低之前,GPU 中介軟體的普及速度可能仍然緩慢。
細分市場分析
2025年,軟體銷售額佔比達到74.28%,而服務預計到2031年將以32.56%的複合年成長率成長。這項銷售構成比表明,在建構GPU環境初期,買家仍主要在調度器、虛擬化工具和運行時軟體上投入資金。目前的構成比也反映了GPU中間件市場的過程,該市場圍繞著平台控制、叢集管理和容器化軟體層不斷演進。 NVIDIA決定在2026年開放原始碼KAI調度器,並免費提供GPU動態資源分配(DRA)驅動程序,進一步鞏固了軟體在技術堆疊中的核心地位。 Red Hat在OpenShift 4.21中正式發布「動態資源分配」功能,也凸顯了軟體層的成熟度,該功能正在企業環境中逐步標準化。
然而,隨著部署的複雜性日益增加,僅靠軟體難以應對,服務擴展的步伐正在進一步加快。 「Red Hat AI Factory with NVIDIA」包含GPU即服務編配、池化存取和自動查核點功能,而此類部署通常需要系統化的實施支援和維運指導。 HPE也透過其AI Factory產品組合朝著類似的方向發展,將任務控制軟體和混合部署支援與企業基礎設施服務打包在一起。 Anyscale將於2026年6月發布支援NVIDIA cuDF的“Ray Data”,這表明,即使是工作負載層面的成本和效能提升,也依賴與更廣泛的生產環境的深度整合。事實上,服務的加速成長表明,GPU中介軟體市場正在從單純的軟體購買決策轉向「軟體+部署成果」。這種轉變將確保服務導向的方法在企業從試點叢集過渡到生產規模環境的過程中始終保持其重要性。
儘管預計到 2025 年雲端服務收入佔比將達到 52.41%,但混合雲端服務預計將以 31.96% 的複合年成長率 (CAGR) 實現最快成長,直至 2031 年。這一細分錶明,目前大部分支出仍用於託管式 GPU 訪問,使企業無需預先建立專用基礎設施即可快速啟動部署。同時,混合雲領域更高的成長率表明,GPU 中介軟體市場正從「僅限雲端」的預設值轉向混合營運模式。這一趨勢透過結合突發訓練、內部資料管理以及針對不同工作負載的多樣化延遲需求,滿足了企業的需求。這也反映出,雲端環境和本地環境正日益被視為相互關聯的元素,共同構成一個統一的運作堆棧,而不僅僅是兩種選擇。
供應商的發展趨勢也在推動這一方向。紅帽的「AI Factory with NVIDIA」圍繞著跨整個企業環境的資源池化和編配構建,使其非常適合那些既希望進行內部管理又不希望犧牲靈活資源共用的組織。 HPE於2026年3月發布的「AI Factory」更新也強調了多規模租戶功能、與Mission Control的整合以及對Red Hat OpenShift的支持,以用於混合AI部署。微軟於2026年4月發布的關於日本的公告表明,在資料居住至關重要的場景中,國內AI基礎設施和本地運算服務仍然至關重要。因此,混合解決方案在GPU中介軟體市場正獲得越來越多的關注,因為它們為買家提供了策略控制、工作負載柔軟性以及將基礎設施與內部管治相協調的空間。雖然在邊緣和嵌入式環境中的部署規模仍然較小,但類似的混合方法正開始影響汽車和工業領域的即時用例。
區域分析
到2025年,北美將佔全球整體銷售額的43.72%,成為GPU中介軟體市場最大的區域貢獻者。這一領先地位反映了該地區高密度的超大規模資料中心業者中心園區、人工智慧軟體供應商以及企業級GPU應用。 2026年6月,微軟宣佈在德克薩斯州佩科斯新建一座資料中心園區,新增約2吉瓦的人工智慧和雲端容量。這進一步鞏固了北美在本週期內作為最大基礎設施建設區域的地位。同樣在2026年1月,英偉達向CoreWeave投資20億美元,作為雙方擴大合作的一部分,旨在到2030年加速人工智慧工廠產能擴張至5吉瓦以上。隨著基礎設施、軟體和服務層面的同步擴展,這些措施鞏固了該地區的規模經濟優勢。南美洲的規模仍然較小,但透過對託管雲端和區域企業現代化專案的訪問,需求持續成長。實際上,就產品成熟度、部署規模和供應商合作而言,北美在GPU中介軟體市場仍佔據主導地位。
在歐洲,GPU中介軟體市場正以不同的方式發展,更加重視管治、主權和企業控制。該地區的需求模式傾向於雲端無關的本地部署模式,尤其針對涉及合規敏感資料的工作負載。法國的國家人工智慧戰略已將GPU中介軟體創新列為優先支援領域,這顯示軟體編排層具有重要的戰略意義,而非次要地位。這種政策背景支撐著對能夠適應區域部署選項和更嚴格營運要求的編配工具的穩定需求。因此,歐洲對GPU中介軟體市場的貢獻不僅體現在其龐大的規模上,更體現在對可控和主權營運模式的推廣上。
亞太地區是成長最快的地區,其GPU中介軟體市場預計到2031年將以32.15%的複合年成長率成長。該地區受益於對自主人工智慧的投資、不斷成長的企業需求以及加強國內運算能力的廣泛努力。 2026年4月,微軟宣佈在日本投資100億美元,其中包括透過與Sakura Internet和Softbank Corporation的合作,提供滿足日本國內數據居住要求的基於GPU的人工智慧運算服務。這個案例清楚地展現了該地區的發展趨勢,其成長不僅源自於運算能力的提升,也源自於在地化的管理需求。亞太地區的快速成長意味著它正成為新契約的重要來源,尤其是在企業和公共機構尋求在其國內建立人工智慧基礎設施的情況下。這種成長勢頭表明,儘管北美目前仍佔據銷售額榜首,但從長遠來看,GPU中間件市場的區域格局將更加均衡。
其他好處:
- Excel格式的市場預測(ME)表
- 3個月的分析師支持
目錄
第1章:引言
- 研究假設和市場定義
- 調查範圍
第2章:調查方法
第3章執行摘要
第4章 市場狀況
- 市場概覽
- 市場促進因素
- 提高人工智慧模型訓練與推理中的GPU密度
- 企業對多租戶GPU資源共用的需求日益成長
- 雲端和本地環境中對最佳化 GPU 利用率的需求日益成長。
- 擴展各產業的高效能運算工作負載
- 擴大容器化人工智慧和MLOps工作流程的應用
- 擴大混合雲和多重雲端GPU 基礎設施的使用
- 市場限制因素
- GPU基礎架構整合成本高且複雜。
- GPU編配、CUDA調優和叢集最佳化方面的人才短缺。
- 傳統資料中心的電力、冷卻和機架密度限制
- 高階GPU的出口限制與硬體供應波動
- 產業價值鏈分析
- 監理情勢
- 技術展望
- 波特五力分析
第5章 市場規模與成長預測
- 按組件
- 軟體
- 服務
- 部署模式
- 雲
- 現場
- 混合
- 邊緣/嵌入式
- 按公司規模
- 大公司
- 小型企業
- 透過使用
- 人工智慧和機器學習
- 高效能運算以及科學和工程模擬
- 數據分析、資料庫、圖處理
- 圖形、視覺化、渲染
- 虛擬桌面基礎架構與遠端工作站
- 數位孿生與工業仿真
- 按最終用戶行業分類
- 雲端服務供應商、超大規模資料中心業者資料中心營運商和資料中心營運商
- 資訊科技/通訊
- 銀行業、金融服務業及保險業
- 醫療保健和生命科學
- 媒體與娛樂
- 車
- 製造業
- 其他終端用戶產業
- 按地區
- 北美洲
- 美國
- 加拿大
- 墨西哥
- 歐洲
- 德國
- 英國
- 法國
- 義大利
- 其他歐洲國家
- 亞太地區
- 中國
- 日本
- 韓國
- 印度
- 東南亞
- 其他亞太國家
- 南美洲
- 中東和非洲
- 北美洲
第6章 競爭情勢
- 市場集中度
- 策略趨勢
- Vendor Positioning Analysis
- 公司簡介
- NVIDIA Corporation
- Amazon Web Services, Inc.
- Microsoft Corporation
- International Business Machines Corporation
- Oracle Corporation
- Red Hat, Inc.
- Hewlett Packard Enterprise Company
- CoreWeave, Inc.
- RunPod Inc.
- Rafay Systems, Inc.
- DigitalOcean, LLC
- Crusoe Energy Systems LLC
- Fujitsu Limited
- Lenovo Group Limited
- OVH SAS
- Scaleway SAS
- The Constant Company, LLC
- Linode, LLC
- Civo Limited
- Anyscale, Inc.
- Modal Labs, Inc.
第7章 市場機會與未來展望
According to Mordor Intelligence, the GPU middleware market size is expected to increase from USD 2.69 billion in 2025 to USD 3.64 billion in 2026 and reach USD 14.11 billion by 2031, growing at a CAGR of 31.12% over 2026-2031.
This report is Segmented by Component (Software, and Services), Deployment Mode (Cloud, On-Premises, Hybrid, and Edge/Embedded), Enterprise Size (Large Enterprises, and Small and Medium Enterprises), Application (Virtual Desktop Infrastructure and Remote Workstations, and More), End-User Industry (Healthcare and Life Sciences, and More), and Geography. The Market Forecasts are Provided in Terms of Value (USD).
Global GPU Middleware Market Trends and Insights
Rising AI Model Training and Inference GPU Density
The GPU middleware market is rising as AI model development increasingly depends on larger, denser compute environments. NVIDIA presented the Vera Rubin platform in June 2026 as a rack-scale system that combines CPU, GPU, networking, and software for science and AI workloads, which shows how tightly integrated next-generation deployments are becoming. Microsoft also announced a new datacenter campus in Pecos, Texas, in June 2026 to add around 2 gigawatts of AI and cloud capacity, reflecting how quickly infrastructure expansion continues in the core buyer base. NVIDIA and Eli Lilly also formed a co-innovation AI lab in January 2026, with up to USD 1 billion in planned investment over 5 years, indicating that large model workloads are spreading into highly regulated commercial settings. As these clusters grow, the operational load on schedulers, memory control layers, and resource allocation tools also rises. That pattern keeps the GPU middleware market closely tied to every new wave of AI training and scale-up in inference.
Growing Enterprise Demand for Multi-Tenant GPU Resource Sharing
The GPU middleware market is also gaining from the need to share limited GPU resources across teams, models, and workloads without losing control. IBM Research, Red Hat, and NxtGen Cloud reported in June 2026 that the open-source llm-d framework delivered 3 to 5 times faster inference and doubled throughput on mixed GPU hardware, while indicating potential annual savings of up to USD 5.25 million per large deployment. NVIDIA also moved its Dynamic Resource Allocation driver for GPUs into the Kubernetes community and onboarded the KAI Scheduler as a CNCF Sandbox project in March 2026, enabling wider use of shared, policy-driven GPU scheduling. Red Hat is built in the same direction as its AI Factory with NVIDIA, which offers pooled access, intelligent orchestration, and automatic checkpointing for long-running jobs. These moves reduce the need for a single application or team to reserve entire clusters for long periods. That supports the GPU middleware market because multi-tenant control becomes a central buying criterion rather than an optional feature.
High GPU Infrastructure Cost and Integration Complexity
The GPU middleware market still faces a clear barrier: scaling GPU infrastructure requires significant upfront investment and careful integration. CoreWeave closed a USD 8.5 billion financing facility in March 2026, followed by a further USD 3.1 billion loan facility in May 2026, underscoring how capital-intensive GPU platform expansion has become, even for specialized providers. Microsoft's June 2026 Pecos announcement also underlined that major AI capacity additions now happen at a very large scale, which smaller buyers cannot easily match. On the deployment side, Red Hat's AI Factory with NVIDIA was validated across hardware from Cisco, Dell Technologies, Lenovo, and Supermicro, which shows that real-world implementation often requires tested combinations across multiple layers. HPE's AI Factory portfolio follows the same logic by packaging orchestration, tenancy, and enterprise software into certified systems. Until these deployments become easier and cheaper to stand up, the GPU middleware market will continue to face slower adoption.
Other drivers and restraints analyzed in the detailed report include:
- Increasing Need for GPU Utilization Optimization in Cloud and On-Premises Environments
- Expansion of High-Performance Computing Workloads Across Industries
- Limited Talent for GPU Orchestration, CUDA Tuning, and Cluster Optimization
For complete list of drivers and restraints, kindly check the Table Of Contents.
Segment Analysis
Software accounted for 74.28% of revenue in 2025, while services are forecast to grow at a 32.56% CAGR through 2031. This revenue split shows that buyers still spend most heavily on schedulers, virtualization tools, and runtime software when they first build out GPU environments. The current mix also reflects how the GPU middleware market developed around platform control, cluster management, and container-ready software layers. NVIDIA's decision to open-source the KAI Scheduler and donate the Dynamic Resource Allocation driver for GPUs in 2026 reinforced software's central position in the stack. Red Hat's general availability release of Dynamic Resource Allocation in OpenShift 4.21 also highlighted a maturing software layer that is becoming more standardized across enterprise deployments.
Services, however, are expanding faster because deployment complexity is now harder to absorb solely through software. Red Hat AI Factory with NVIDIA includes GPU-as-a-Service orchestration, pooled access, and automatic checkpointing, and that kind of rollout usually requires structured implementation support and operating guidance. HPE also pushed the same direction through its AI Factory portfolio, where Mission Control software and hybrid deployment support are packaged with enterprise infrastructure services. Anyscale's June 2026 release of Ray Data with NVIDIA cuDF support showed that even cost and performance gains at the workload layer still depend on strong integration into broader operating environments. In practice, the faster growth of services suggests that the GPU middleware market is moving from software purchase decisions toward software plus deployment outcomes. That shift should keep service-heavy engagements important as organizations move from pilot clusters to production-scale estates.
Cloud represented 52.41% of revenue in 2025, while hybrid is projected to record the fastest growth at a 31.96% CAGR through 2031. That split shows that the largest share of current spending still goes to managed GPU access, which lets enterprises get started quickly without building dedicated infrastructure first. At the same time, the faster hybrid growth rate indicates that the GPU middleware market is moving toward mixed operating models rather than a cloud-only default. This pattern meets enterprise needs by combining burst training, internal data control, and varying latency requirements across workloads. It also reflects the fact that cloud and on-premises environments are being treated less as alternatives and more as interconnected parts of a single operating stack.
Vendor moves support that direction. Red Hat's AI Factory with NVIDIA was built around pooled access and orchestration across enterprise environments, which fits organizations that want internal control without giving up flexible resource sharing. HPE's March 2026 AI Factory updates also highlighted multi-scale tenancy, Mission Control integration, and Red Hat OpenShift support for hybrid AI deployments. Microsoft's April 2026 announcement on Japan showed how in-country AI infrastructure and local compute services remain important where data residency matters. The GPU middleware market is therefore seeing hybrid gain traction because it gives buyers policy control, workload flexibility, and more room to align infrastructure with internal governance. Edge and embedded deployments remain smaller, but the same hybrid logic is starting to influence real-time use cases in automotive and industrial settings.
Complete Report Scope:
- By Component
- Software
- Services
- By Deployment Mode
- Cloud
- On-Premises
- Hybrid
- Edge/Embedded
- By Enterprise Size
- Large Enterprises
- Small and Medium Enterprises
- By Application
- Artificial Intelligence and Machine Learning
- High-Performance Computing and Scientific/Engineering Simulation
- Data Analytics, Databases and Graph Processing
- Graphics, Visualization and Rendering
- Virtual Desktop Infrastructure and Remote Workstations
- Digital Twins and Industrial Simulation
- By End-User Industry
- Cloud Service Providers, Hyperscalers and Data Center Operators
- Information Technology and Telecommunications
- Banking, Financial Services and Insurance
- Healthcare and Life Sciences
- Media and Entertainment
- Automotive
- Manufacturing
- Other End-User Industries
- By Geography
- North America
- United States
- Canada
- Mexico
- Europe
- Germany
- United Kingdom
- France
- Italy
- Rest of Europe
- Asia-Pacific
- China
- Japan
- South Korea
- India
- Southeast Asia
- Rest of Asia-Pacific
- South America
- Middle East and Africa
- North America
Geography Analysis
North America accounted for 43.72% of global revenue in 2025, making it the largest regional contributor to the GPU middleware market. This lead reflects the region's dense concentration of hyperscaler campuses, AI software vendors, and enterprise GPU deployments. Microsoft announced a new datacenter campus in Pecos, Texas, in June 2026, adding around 2 gigawatts of AI and cloud capacity, which reinforced North America's role as the largest infrastructure build zone in the current cycle. NVIDIA also invested USD 2 billion in CoreWeave in January 2026 as part of an expanded collaboration to accelerate more than 5 gigawatts of AI factory capacity by 2030. These moves support the region's scale advantage because infrastructure, software, and service layers are being expanded together. South America remained smaller, but demand continued to build through managed cloud access and regional enterprise modernization programs. In practical terms, North America still sets the pace for product maturity, deployment scale, and vendor alignment in the GPU middleware market.
Europe is developing the GPU middleware market through a different path that places more weight on governance, sovereignty, and enterprise control. The region's demand pattern favors cloud-agnostic and on-premises deployment models in workloads that involve compliance-sensitive data. France's national AI strategy identified GPU middleware innovation as a priority area for support, which showed that the software coordination layer is being treated as strategically important rather than secondary. This policy backdrop supports steady demand for orchestration tools that can fit localized deployment choices and stricter operating requirements. As a result, Europe contributes to the GPU middleware market less through sheer scale and more through the push for controllable and sovereign operating models.
Asia-Pacific is the fastest-growing region, with the GPU middleware market size in this geography projected to advance at a 32.15% CAGR through 2031. The region is benefiting from sovereign AI investment, expanding enterprise demand, and a wider push for in-country compute capability. Microsoft announced a USD 10 billion investment in Japan in April 2026, including work with Sakura Internet and SoftBank to provide GPU-based AI compute services with domestic data residency. That example captures the regional theme clearly, because growth is being driven not only by capacity additions but also by local control requirements. Asia-Pacific's faster pace means it is becoming a more important source of new contracts, especially where enterprises and public institutions want AI infrastructure within national boundaries. This momentum should keep the GPU middleware market geographically more balanced over time, even though North America still leads in current revenue.
- NVIDIA Corporation
- Amazon Web Services, Inc.
- Microsoft Corporation
- International Business Machines Corporation
- Oracle Corporation
- Red Hat, Inc.
- Hewlett Packard Enterprise Company
- CoreWeave, Inc.
- RunPod Inc.
- Rafay Systems, Inc.
- DigitalOcean, LLC
- Crusoe Energy Systems LLC
- Fujitsu Limited
- Lenovo Group Limited
- OVH SAS
- Scaleway SAS
- The Constant Company, LLC
- Linode, LLC
- Civo Limited
- Anyscale, Inc.
- Modal Labs, Inc.
Additional Benefits:
- The market estimate (ME) sheet in Excel format
- 3 months of analyst support
TABLE OF CONTENTS
1 INTRODUCTION
- 1.1 Study Assumptions and Market Definition
- 1.2 Scope of the Study
2 RESEARCH METHODOLOGY
3 EXECUTIVE SUMMARY
4 MARKET LANDSCAPE
- 4.1 Market Overview
- 4.2 Market Drivers
- 4.2.1 Rising AI Model Training and Inference GPU Density
- 4.2.2 Growing Enterprise Demand for Multi-Tenant GPU Resource Sharing
- 4.2.3 Increasing Need for GPU Utilization Optimization in Cloud and On-Premises Environments
- 4.2.4 Expansion of High-Performance Computing Workloads Across Industries
- 4.2.5 Rising Adoption of Containerized AI and MLOps Workflows
- 4.2.6 Greater Use of Hybrid and Multi-Cloud GPU Infrastructure
- 4.3 Market Restraints
- 4.3.1 High GPU Infrastructure Cost and Integration Complexity
- 4.3.2 Limited Talent for GPU Orchestration, CUDA Tuning, and Cluster Optimization
- 4.3.3 Power, Cooling, and Rack Density Constraints in Legacy Data Centers
- 4.3.4 Export Controls and Hardware Allocation Volatility for Advanced GPUs
- 4.4 Industry Value Chain Analysis
- 4.5 Regulatory Landscape
- 4.6 Technological Outlook
- 4.7 Porter's Five Forces Analysis
- 4.7.1 Bargaining Power of Suppliers
- 4.7.2 Bargaining Power of Buyers
- 4.7.3 Threat of New Entrants
- 4.7.4 Threat of Substitutes
- 4.7.5 Competitive Rivalry
5 MARKET SIZE AND GROWTH FORECASTS (VALUE)
- 5.1 By Component
- 5.1.1 Software
- 5.1.2 Services
- 5.2 By Deployment Mode
- 5.2.1 Cloud
- 5.2.2 On-Premises
- 5.2.3 Hybrid
- 5.2.4 Edge/Embedded
- 5.3 By Enterprise Size
- 5.3.1 Large Enterprises
- 5.3.2 Small and Medium Enterprises
- 5.4 By Application
- 5.4.1 Artificial Intelligence and Machine Learning
- 5.4.2 High-Performance Computing and Scientific/Engineering Simulation
- 5.4.3 Data Analytics, Databases and Graph Processing
- 5.4.4 Graphics, Visualization and Rendering
- 5.4.5 Virtual Desktop Infrastructure and Remote Workstations
- 5.4.6 Digital Twins and Industrial Simulation
- 5.5 By End-User Industry
- 5.5.1 Cloud Service Providers, Hyperscalers and Data Center Operators
- 5.5.2 Information Technology and Telecommunications
- 5.5.3 Banking, Financial Services and Insurance
- 5.5.4 Healthcare and Life Sciences
- 5.5.5 Media and Entertainment
- 5.5.6 Automotive
- 5.5.7 Manufacturing
- 5.5.8 Other End-User Industries
- 5.6 By Geography
- 5.6.1 North America
- 5.6.1.1 United States
- 5.6.1.2 Canada
- 5.6.1.3 Mexico
- 5.6.2 Europe
- 5.6.2.1 Germany
- 5.6.2.2 United Kingdom
- 5.6.2.3 France
- 5.6.2.4 Italy
- 5.6.2.5 Rest of Europe
- 5.6.3 Asia-Pacific
- 5.6.3.1 China
- 5.6.3.2 Japan
- 5.6.3.3 South Korea
- 5.6.3.4 India
- 5.6.3.5 Southeast Asia
- 5.6.3.6 Rest of Asia-Pacific
- 5.6.4 South America
- 5.6.5 Middle East and Africa
- 5.6.1 North America
6 COMPETITIVE LANDSCAPE
- 6.1 Market Concentration
- 6.2 Strategic Moves
- 6.3 Vendor Positioning Analysis
- 6.4 Company Profiles (includes Global Level Overview, Market Level Overview, Core Segments, Financials as available, Strategic Information, Market Rank/Share, Products and Services, Recent Developments)
- 6.4.1 NVIDIA Corporation
- 6.4.2 Amazon Web Services, Inc.
- 6.4.3 Microsoft Corporation
- 6.4.4 International Business Machines Corporation
- 6.4.5 Oracle Corporation
- 6.4.6 Red Hat, Inc.
- 6.4.7 Hewlett Packard Enterprise Company
- 6.4.8 CoreWeave, Inc.
- 6.4.9 RunPod Inc.
- 6.4.10 Rafay Systems, Inc.
- 6.4.11 DigitalOcean, LLC
- 6.4.12 Crusoe Energy Systems LLC
- 6.4.13 Fujitsu Limited
- 6.4.14 Lenovo Group Limited
- 6.4.15 OVH SAS
- 6.4.16 Scaleway SAS
- 6.4.17 The Constant Company, LLC
- 6.4.18 Linode, LLC
- 6.4.19 Civo Limited
- 6.4.20 Anyscale, Inc.
- 6.4.21 Modal Labs, Inc.
7 MARKET OPPORTUNITIES AND FUTURE OUTLOOK
- 7.1 White-Space and Unmet-Need Assessment

 AI編配平台市場預測至2034年-全球分析(按組件、部署模式、編配類型、技術、應用、最終用戶和地區分類)人工智慧驅動的供應鏈編配市場預測至2034年:全球部署模式、產品/服務、服務類型、人工智慧技術、功能、應用、最終用戶和區域分析
 全球人工智慧模型路由器市場:按產品、路由方式、部署方式、組織規模和最終用戶產業分類-市場規模、產業動態、機會分析和預測(2026-2035 年)
 GPU編配:市佔率分析、產業趨勢與統計、成長預測(2026-2031年)
 2026年全球工作流程市場報告勞動力編配平台市場預測至2034年-按平台類型、部署模式、技術、應用、最終用戶和地區分類的全球分析人工智慧市場預測:智慧流程自動化的全球分析(至2034年),涵蓋流程、組件、技術、應用、最終用戶和區域。智慧流程自動化平台市場預測至2034年—按組件、技術、部署模式、應用、最終用戶和地區分類的全球分析企業代理基礎設施:市場佔有率分析、產業趨勢與統計、成長預測(2026-2031 年)2026年全球多模型編配市場報告