


 |
市場調查報告書
商品編碼
2097382
線上電商平台:市場佔有率分析、產業趨勢與統計、成長預測(2025-2030)Live Commerce Platforms - Market Share Analysis, Industry Trends & Statistics, Growth Forecasts (2025 - 2030) |
||||||

※ 本網頁內容可能與最新版本有所差異。詳細情況請與我們聯繫。
據 Mordor Intelligence 稱,2025 年即時電商平台市值為 14.1 億美元,預計到 2030 年將達到 37.9 億美元。
這意味著在預測期內,複合年成長率將達到 21.84%。
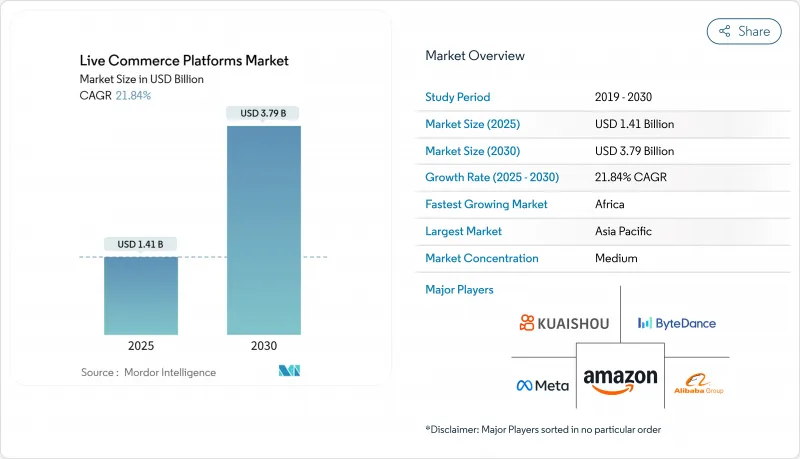
本報告依產品類型(直播電商平台、社群媒體直播電商工具等)、經營模式(B2C平台、混合平台等)、產業領域(居家生活、食品雜貨等)、平台類型(網頁平台、行動應用程式等)和地區進行細分。市場預測以美元計價。
全球直播電商平台市場趨勢及洞察
5G網路的普及提高了影片串流的品質。
超低延遲的 5G 技術消除了以往導致觀眾斷線的緩衝問題,讓主播能夠即時回覆消費者的提問。由於 5G 可以流暢播放高清視訊串流和互動式疊加層,73% 的直播電商支付都透過行動應用完成。消費性電子產品和美妝產品的展示尤其受益於清晰的細節和流暢的畫面,從而讓產品評估更加便捷。雖然通訊業者表示直播電商比普通影片消耗的頻寬高出 40%,但 5G 的容量足以應對這一流量激增,即使在大量觀眾同時線上情況下也能保持視訊品質。更高的可靠性使品牌能夠安排更長的直播時長,從而拓展了深入講解品牌故事和提升銷售的機會。這些因素正在推動直播電商平台在零售業走向主流應用。
新興經濟體智慧型手機普及率不斷提高
目前,撒哈拉以南非洲的智慧型手機普及率超過54%,東南亞更是高達73%,這使得消費者無需使用電腦即可直接與直播互動。在地化的支付錢包、在地化的音訊以及精通當地方言的網紅主播,都提升了首次嘗試電商用戶的參與度。在這些地區運作的平台轉換率是成熟經濟體的2.3倍。這是因為直播電商能夠同時滿足用戶的好奇心、促進社交互動並建立信任。這一趨勢正在推動小眾本地手工藝者的直播發展,並擴大賣家的覆蓋範圍。這不僅促進了基層用戶的參與,也鞏固了行動端作為直播電商平台市場預設管道的地位。
平台營運商的高額獲客成本
隨著內容量的激增,用戶注意力變得稀缺,已開發地區獲客成本平均高達47美元,幾乎是傳統電商平台的四倍。由於用戶對內容品質的期望不斷提高,平台不得不聘請專業主播和工作室,導致在實現盈利之前,固定成本大幅增加。整合了直播購物功能的社交網路給依賴付費廣告吸引用戶的中小企業帶來了壓力,因為這些平台能夠幫助它們利用現有社群,同時降低額外成本。因此,維持高用戶參與度需要在行銷預算和創作者獎勵之間找到微妙的平衡,這阻礙了直播電商平台市場的短期擴張。
細分市場分析
2024年,嵌入式直播購物外掛佔據了直播電商平台市場22.78%的佔有率,預計到2030年將維持最高的複合年成長率。零售商更傾向於在現有網站上添加即插即用的模組,而不是遷移到新的生態系統,從而保護現有的IT投資並維持其搜尋引擎最佳化(SEO)排名。在品牌自有店舖內實現無縫結帳可以防止流量流失,而即時API則可以將庫存狀態反映在螢幕上的產品卡上。在直播電商平台市場,直播交易平台憑藉其龐大的用戶群仍佔據37.64%的市場佔有率,但對於尋求完全掌控客戶數據和視覺形象的成熟品牌而言,嵌入式方案更具吸引力。社群媒體直播電商工具則介於兩者之間,透過在網紅直播中整合“可購買標籤”,利用其龐大的用戶群體創造收入。白牌套件滿足了尋求多區域合規性和深度分析的公司的需求,突顯了推動整個即時商務平台市場收入成長的各種途徑。
結合市場產品發現功能和嵌入式Widgets的混合解決方案正日益普及,因為它們允許賣家集中管理訂單,同時在多個平台上進行配送。人工智慧驅動的審核功能可過濾評論以保護品牌聲譽,而低程式碼設計工作室則讓缺乏技術專長的團隊也能輕鬆創建影片橫幅。這些優勢引進週期從數月縮短至數週,從而釋放行銷預算,用於提升配送能力和付費推廣。隨著外掛程式庫的日趨成熟,它們將成為全通路策略的基礎,將店內活動、網頁彈跳窗和社群媒體推廣活動同步到一個統一的控制面板上,從而鞏固嵌入式解決方案作為即時電商平台市場支柱的地位。
2024年,B2C模式佔據了44.83%的收入佔有率,主要服務於那些優先考慮直接資料收集和高效履約的品牌自營店鋪。相較之下,融合了B2C和C2C供應的混合平台,憑藉其更廣泛的產品種類和動態定價,正以22.67%的複合年成長率快速成長。消費者樂於在同一會話中同時享受官方發售產品和用戶間轉售的優惠,這有助於提高用戶留存率和平均觀看時長。賣家可以利用靈活的收費結構,根據自身庫存風險接受度,在固定費用和收益分成之間自由切換。這種柔軟性深受中型品牌和獨立主播的青睞,從而擴大了直播電商平台市場主播的潛在客戶群。
C2C直播電商在亞太地區特別蓬勃發展,該地區更重視社群信任而非品牌權威,這使得小規模企業能夠居家直播,快速出售庫存。雖然B2B直播電商目前仍處於小眾領域,但在工業工具和原料行業正迅速擴張,因為直播演示比靜態產品目錄更能有效地展示產品規格。整體而言,這種混合模式顯示直播電商平台市場日趨成熟,正從一個孤立的垂直市場演變為一個動態的生態系統,在線上複製線下集市的活力。
區域分析
亞太地區在2024年佔總銷售額的46.92%。這主要得益於中國成熟的生態系統,以及印尼、越南和泰國等國的快速發展,在這些國家,社交電商模式正在推動互動式購物。國內電子錢包和當日達服務正在簡化支付和配送流程,增強客戶忠誠度並提高購買頻率。非洲市場雖然規模較小,但其複合年成長率(CAGR)高達22.78%,主要得益於較低的行動資料通訊以及創業賣家將配送中心轉型為數位攤販。此外,Reach還透過與通訊業者合作,提供包含免費資料通訊的串流套餐,進一步擴大了市場佔有率。
北美市場的成長得益於科技巨頭將即時功能整合到現有社交網路中,從而降低了用戶和賣家的進入門檻。美國品牌擴大在其倉庫附近設立工作室,以加快揀貨、包裝和出貨週期,從而增強消費者對「即時」的感知。
在歐洲,由於隱私法規更為嚴格,在地化支付閘道器的普及速度較為緩慢,但在奢侈品領域卻取得了顯著成效,限量版產品和獨家幕後內容足以支撐其高價。在拉丁美洲,隨著在地化付款閘道在巴西和墨西哥的規模不斷擴大,其發展動能也日益強勁。當地重視故事敘述的文化與主持人主導的產品展示方式不謀而合。
在中東,高可支配收入和對高階商品的需求推動了市場需求,免稅直播導覽和私人購物直播服務迎合了富裕消費者對客製化服務的需求。這些區域特徵使得有意進入直播電商平台市場的公司可以採取不同的打入市場策略。
其他好處:
- Excel格式的市場預測(ME)表
- 3個月的分析師支持
目錄
第1章:引言
- 研究假設和市場定義
- 調查範圍
第2章:調查方法
第3章執行摘要
第4章 市場狀況
- 市場概覽
- 市場促進因素
- 5G網路的普及正在提高影片串流的品質。
- 新興國家智慧型手機普及率不斷提高
- 整合人工智慧產品建議引擎
- Z世代和千禧世代購買行為的影響力日益增強
- 跨境履約基礎架構的擴展
- 我們自有直播購物工作室的品牌採用率提高
- 市場限制因素
- 平台營運商的高額獲客成本
- 對影響者推薦透明度的監管
- 發展中地區支付和物流生態系統的碎片化
- 觀眾對直播內容感到厭倦,導致觀看參與度下降。
- 產業價值鏈分析
- 監理情勢
- 技術展望
- 宏觀經濟因素的影響
- 波特五力分析
第5章 市場規模與成長預測
- 依產品類型
- 直播市場平台
- 嵌入式直播購物插件
- 社群媒體即時電商工具
- 白牌直播購物軟體
- 其他產品類型
- 按經營模式
- 企業對消費者 (B2C) 平台
- 企業對企業 (B2B) 平台
- 個人對個人 (C2C) 平台
- 混合平台
- 按行業分類
- 時尚與服裝
- 美容及個人護理
- 家用電子產品
- 居家生活
- 食品和雜貨
- 其他工業部門
- 依平台類型
- 網路為基礎的平台
- 行動應用
- 跨平台全通路解決方案
- 智慧電視和OTT應用
- 按地區
- 北美洲
- 美國
- 加拿大
- 墨西哥
- 歐洲
- 德國
- 英國
- 法國
- 俄羅斯
- 其他歐洲國家
- 亞太地區
- 中國
- 日本
- 印度
- 韓國
- 澳洲
- 其他亞太國家
- 中東和非洲
- 中東
- 沙烏地阿拉伯
- 阿拉伯聯合大公國
- 其他中東國家
- 非洲
- 南非
- 埃及
- 其他非洲國家
- 中東
- 南美洲
- 巴西
- 阿根廷
- 其他南美國家
- 北美洲
第6章 競爭情勢
- 市場集中度
- 策略趨勢
- 市佔率分析
- 公司簡介
- Alibaba Group Holding Limited
- Amazon.com, Inc.
- ByteDance Ltd.
- Kuaishou Technology
- Meta Platforms, Inc.
- Google LLC
- Tencent Holdings Limited
- Qurate Retail, Inc.
- Mogu Inc.
- Sea Limited
- Pinduoduo Inc.
- JD.com, Inc.
- Flipkart Internet Private Limited
- NTWRK Inc.
- Bilibili Inc.
- ShopShops Holdings Inc.
- TalkShopLive, Inc.
- CommentSold, Inc.
- Bambuser AB
- Livescale Technologies Inc.
第7章 市場機會與未來展望
According to Mordor Intelligence, the live commerce platforms market size is valued at USD 1.41 billion in 2025 and is projected to reach USD 3.79 billion by 2030, translating into a 21.84% CAGR over the forecast period.
This report is Segmented by Product Type (Livestream Marketplace Platforms, Social Media Live Commerce Tools, and More), Business Model (Business-To-Consumer Platforms, Hybrid Platforms, and More), Industry Vertical (Home and Living, Food and Grocery, and More), Platform Type (Web-Based Platforms, Mobile Applications, and More), and Geography. The Market Forecasts are Provided in Terms of Value (USD).
Global Live Commerce Platforms Market Trends and Insights
Proliferation of 5G Networks Enhancing Video Streaming Quality
Ultra-low-latency 5G eliminates buffering that has historically caused viewer drop-off, allowing hosts to respond instantly to shopper questions. Mobile apps process 73% of live-commerce checkouts because 5G handles high-definition streams and interactive overlays without delays. Consumer electronics and beauty demonstrations benefit most from crisp detail and smooth motion, as these enhancements improve product assessment. Network providers confirm live commerce consumes 40% more bandwidth than standard video, yet 5G capacity absorbs the spike while sustaining quality across large concurrent audiences. Higher reliability persuades brands to schedule longer broadcasts that deepen storytelling and upsell opportunities, pushing the Live Commerce Platforms market toward mainstream retail adoption.
Rising Smartphone Penetration in Emerging Economies
Smartphone ownership now exceeds 54% in sub-Saharan Africa and 73% in Southeast Asia, allowing consumers to leapfrog desktop shopping and interact directly with live broadcasts. Localized payment wallets, vernacular audio tracks, and influencer hosts familiar with regional dialects raise engagement among first-time e-commerce users. Platforms active in these regions report conversion rates 2.3 times higher than in mature economies because live commerce simultaneously satisfies curiosity, fosters social bonding, and builds trust. The trend widens seller reach as niche artisans stream from rural areas, fueling grassroots participation and reinforcing mobile as the default channel for the Live Commerce Platforms market.
High Customer Acquisition Costs for Platform Operators
As content volume climbs, viewer attention becomes scarce, driving average acquisition outlays to USD 47 per user in developed regions, nearly quadruple standard e-commerce benchmarks. Production-quality expectations push platforms to hire professional hosts and studios, inflating fixed costs ahead of monetization. Social networks that integrate live shopping features leverage existing communities at a lower incremental spend, squeezing smaller firms that rely on paid ads to attract audiences. Sustaining high engagement thus requires a delicate balance between marketing budgets and creator incentives, tempering the near-term expansion of the Live Commerce Platforms market.
Other drivers and restraints analyzed in the detailed report include:
- Integration of AI-Powered Product Recommendation Engines
- Growing Influence of Gen Z and Millennial Shopping Behaviors
- Regulatory Scrutiny Over Influencer Endorsement Transparency
For complete list of drivers and restraints, kindly check the Table Of Contents.
Segment Analysis
Embedded livestream shopping plugins accounted for 22.78% of the Live Commerce Platforms market size in 2024 and are forecast to post the fastest CAGR through 2030. Retailers prefer augmenting existing websites with plug-and-play modules rather than migrating to new ecosystems, protecting prior IT investments and preserving SEO authority. Seamless checkout within branded storefronts prevents traffic leakage, while real-time APIs feed inventory status to on-screen product cards. Livestream marketplace platforms still hold a 37.64% market share in Live Commerce Platforms, thanks to their built-in audiences; however, embedded options entice heritage brands that demand full control over customer data and visual identity. Social media live commerce tools sit between these extremes, monetizing vast user bases by integrating shoppable tags during influencer broadcasts. White-label suites cater to enterprises seeking multi-region compliance and in-depth analytics, highlighting the diverse paths that fuel revenue growth across the Live Commerce Platforms market.
Hybrid offerings that package marketplace discovery with embeddable widgets are gaining momentum because they let sellers simulcast on multiple domains while centralizing order management. AI-driven moderation filters comments to shield brand reputation, and low-code design studios democratize video banner creation for non-technical teams. These advantages shorten deployment cycles from months to weeks, freeing marketing budgets for on-air talent and paid amplification. As plugin libraries mature, they will anchor omnichannel strategies that sync in-store events, web pop-ups, and social promotions under one dashboard, cementing embedded solutions as a structural pillar of the Live Commerce Platforms market.
The B2C format captured 44.83% of 2024 revenue, serving brand-owned stores that value direct data capture and streamlined fulfillment. In contrast, hybrid platforms blending B2C and C2C supply are expanding at a 22.67% CAGR as they unlock broader catalog depth and dynamic pricing. Consumers appreciate the variety of official launches alongside peer-resale bargains within a single session, boosting stickiness and average watch time. Sellers leverage elastic commission structures, shifting between fixed fees and revenue shares based on inventory risk tolerance. This flexibility appeals to mid-sized labels and independent creators alike, enlarging the addressable pool of broadcasters on Live Commerce Platform market venues.
C2C live commerce excels in Asia Pacific, where community trust supersedes brand authority, enabling micro-entrepreneurs to stream from home and clear inventory quickly. B2B adoption remains niche, but it is rising for industrial tools and raw materials, where live demos clarify specifications more effectively than static catalogs. Overall, hybridization signals the maturation of the Live Commerce Platforms market, evolving from siloed verticals into fluid ecosystems that mirror offline bazaar dynamics online.
Complete Report Scope:
- By Product Type
- Livestream Marketplace Platforms
- Embedded Livestream Shopping Plugins
- Social Media Live Commerce Tools
- White-Label Live Shopping Software
- Other Product Type
- By Business Model
- Business-to-Consumer (B2C) Platforms
- Business-to-Business (B2B) Platforms
- Consumer-to-Consumer (C2C) Platforms
- Hybrid Platforms
- By Industry Vertical
- Fashion and Apparel
- Beauty and Personal Care
- Consumer Electronics
- Home and Living
- Food and Grocery
- Other Industry Vertical
- By Platform Type
- Web-Based Platforms
- Mobile Applications
- Cross-Platform Omni Channel Solutions
- Smart TV and OTT Applications
- By Geography
- North America
- United States
- Canada
- Mexico
- Europe
- Germany
- United Kingdom
- France
- Russia
- Rest of Europe
- Asia-Pacific
- China
- Japan
- India
- South Korea
- Australia
- Rest of Asia-Pacific
- Middle East and Africa
- Middle East
- Saudi Arabia
- United Arab Emirates
- Rest of Middle East
- Africa
- South Africa
- Egypt
- Rest of Africa
- Middle East
- South America
- Brazil
- Argentina
- Rest of South America
- North America
Geography Analysis
The Asia Pacific generated 46.92% of 2024 revenue, driven by China's mature ecosystems and the rapid adoption in Indonesia, Vietnam, and Thailand, where social commerce norms favor interactive shopping. Domestic e-wallets and same-day fulfillment services streamline the checkout and delivery process, reinforcing loyalty and increasing frequency. African markets contribute a modest base yet post the highest 22.78% CAGR, driven by the affordability of mobile data and entrepreneurial sellers transforming broadcast rooms into digital stalls. Partnerships with telecom operators offering zero-rated streaming packages further widen reach.
North America's growth relies on technology giants integrating live features into existing social networks, reducing friction for both users and merchants. U.S. brands are increasingly operating studio spaces adjacent to warehouses to accelerate the pick-pack-ship cycle, thereby enhancing the perceived immediacy.
Europe lags in adoption due to stricter privacy regulations, yet it records strong performance in luxury, where limited-edition drops and exclusive backstage content justify premium price points. Latin America is seeing traction in Brazil and Mexico as localized payment gateways achieve scale, while the cultural emphasis on storytelling aligns well with host-led product narratives.
The Middle East leverages high disposable incomes and an appetite for exclusive goods; duty-free live tours and personal shopper streams cater to affluent audiences seeking bespoke service. Such regional nuances validate a diversified go-to-market strategy for any entrant eyeing the Live Commerce Platforms market.
- Alibaba Group Holding Limited
- Amazon.com, Inc.
- ByteDance Ltd.
- Kuaishou Technology
- Meta Platforms, Inc.
- Google LLC
- Tencent Holdings Limited
- Qurate Retail, Inc.
- Mogu Inc.
- Sea Limited
- Pinduoduo Inc.
- JD.com, Inc.
- Flipkart Internet Private Limited
- NTWRK Inc.
- Bilibili Inc.
- ShopShops Holdings Inc.
- TalkShopLive, Inc.
- CommentSold, Inc.
- Bambuser AB
- Livescale Technologies Inc.
Additional Benefits:
- The market estimate (ME) sheet in Excel format
- 3 months of analyst support
TABLE OF CONTENTS
1 INTRODUCTION
- 1.1 Study Assumptions and Market Definition
- 1.2 Scope of the Study
2 RESEARCH METHODOLOGY
3 EXECUTIVE SUMMARY
4 MARKET LANDSCAPE
- 4.1 Market Overview
- 4.2 Market Drivers
- 4.2.1 Proliferation of 5G Networks Enhancing Video Streaming Quality
- 4.2.2 Rising Smartphone Penetration in Emerging Economies
- 4.2.3 Integration of AI-Powered Product Recommendation Engines
- 4.2.4 Growing Influence of Gen Z and Millennial Shopping Behaviors
- 4.2.5 Expansion of Cross-Border E-Commerce Fulfillment Infrastructure
- 4.2.6 Increasing Brand Adoption of In-House Live Shopping Studios
- 4.3 Market Restraints
- 4.3.1 High Customer Acquisition Costs for Platform Operators
- 4.3.2 Regulatory Scrutiny Over Influencer Endorsement Transparency
- 4.3.3 Fragmented Payment and Logistics Ecosystems in Developing Regions
- 4.3.4 Livestream Content Fatigue Reducing Viewer Engagement
- 4.4 Industry Value Chain Analysis
- 4.5 Regulatory Landscape
- 4.6 Technological Outlook
- 4.7 Impact of Macroeconomic Factors
- 4.8 Porter's Five Forces Analysis
- 4.8.1 Bargaining Power of Buyers
- 4.8.2 Bargaining Power of Suppliers
- 4.8.3 Threat of New Entrants
- 4.8.4 Threat of Substitutes
- 4.8.5 Competitive Rivalry
5 MARKET SIZE AND GROWTH FORECASTS (VALUE)
- 5.1 By Product Type
- 5.1.1 Livestream Marketplace Platforms
- 5.1.2 Embedded Livestream Shopping Plugins
- 5.1.3 Social Media Live Commerce Tools
- 5.1.4 White-Label Live Shopping Software
- 5.1.5 Other Product Type
- 5.2 By Business Model
- 5.2.1 Business-to-Consumer (B2C) Platforms
- 5.2.2 Business-to-Business (B2B) Platforms
- 5.2.3 Consumer-to-Consumer (C2C) Platforms
- 5.2.4 Hybrid Platforms
- 5.3 By Industry Vertical
- 5.3.1 Fashion and Apparel
- 5.3.2 Beauty and Personal Care
- 5.3.3 Consumer Electronics
- 5.3.4 Home and Living
- 5.3.5 Food and Grocery
- 5.3.6 Other Industry Vertical
- 5.4 By Platform Type
- 5.4.1 Web-Based Platforms
- 5.4.2 Mobile Applications
- 5.4.3 Cross-Platform Omni Channel Solutions
- 5.4.4 Smart TV and OTT Applications
- 5.5 By Geography
- 5.5.1 North America
- 5.5.1.1 United States
- 5.5.1.2 Canada
- 5.5.1.3 Mexico
- 5.5.2 Europe
- 5.5.2.1 Germany
- 5.5.2.2 United Kingdom
- 5.5.2.3 France
- 5.5.2.4 Russia
- 5.5.2.5 Rest of Europe
- 5.5.3 Asia-Pacific
- 5.5.3.1 China
- 5.5.3.2 Japan
- 5.5.3.3 India
- 5.5.3.4 South Korea
- 5.5.3.5 Australia
- 5.5.3.6 Rest of Asia-Pacific
- 5.5.4 Middle East and Africa
- 5.5.4.1 Middle East
- 5.5.4.1.1 Saudi Arabia
- 5.5.4.1.2 United Arab Emirates
- 5.5.4.1.3 Rest of Middle East
- 5.5.4.2 Africa
- 5.5.4.2.1 South Africa
- 5.5.4.2.2 Egypt
- 5.5.4.2.3 Rest of Africa
- 5.5.4.1 Middle East
- 5.5.5 South America
- 5.5.5.1 Brazil
- 5.5.5.2 Argentina
- 5.5.5.3 Rest of South America
- 5.5.1 North America
6 COMPETITIVE LANDSCAPE
- 6.1 Market Concentration
- 6.2 Strategic Moves
- 6.3 Market Share Analysis
- 6.4 Company Profiles (includes Global level Overview, Market level overview, Core Segments, Financials as available, Strategic Information, Market Rank/Share for key companies, Products and Services, and Recent Developments)
- 6.4.1 Alibaba Group Holding Limited
- 6.4.2 Amazon.com, Inc.
- 6.4.3 ByteDance Ltd.
- 6.4.4 Kuaishou Technology
- 6.4.5 Meta Platforms, Inc.
- 6.4.6 Google LLC
- 6.4.7 Tencent Holdings Limited
- 6.4.8 Qurate Retail, Inc.
- 6.4.9 Mogu Inc.
- 6.4.10 Sea Limited
- 6.4.11 Pinduoduo Inc.
- 6.4.12 JD.com, Inc.
- 6.4.13 Flipkart Internet Private Limited
- 6.4.14 NTWRK Inc.
- 6.4.15 Bilibili Inc.
- 6.4.16 ShopShops Holdings Inc.
- 6.4.17 TalkShopLive, Inc.
- 6.4.18 CommentSold, Inc.
- 6.4.19 Bambuser AB
- 6.4.20 Livescale Technologies Inc.
7 MARKET OPPORTUNITIES AND FUTURE OUTLOOK
- 7.1 White-space and Unmet-Need Assessment

 虛擬直播平台市場:全球市場預測,2026-2032年直播軟體市場:按組件、部署模式、平台、串流技術、定價模式和最終用途分類-2026-2032年全球市場預測
 全球直播市場-產業規模、佔有率、趨勢、機會和預測:按直播類型、應用、地區和競爭格局分類,2021-2031年
 直播付費觀看市場規模、佔有率和成長分析:按內容類型、平台類型、收入模式、設備類型、最終用戶和地區分類-2026-2033年產業預測
 直播:市場佔有率分析、產業趨勢與統計、成長預測(2026-2031)
 2026年全球薪資串流平台市場報告2026年全球直播電商平台市場報告2026年全球直播付費隨選市場報告2026年全球直播市場報告虛擬直播市場:按平台類型、應用程式、最終用戶、裝置類型和收入模式分類的全球預測,2026-2032年