


 |
市場調查報告書
商品編碼
2073627
美國電動皮卡:市場佔有率分析、產業趨勢與統計及成長預測(2026-2031)United States Electric Pick-up Trucks - Market Share Analysis, Industry Trends & Statistics, Growth Forecasts (2026 - 2031) |
||||||

※ 本網頁內容可能與最新版本有所差異。詳細情況請與我們聯繫。
據 Mordor Intelligence 稱,2025 年美國電動皮卡市場價值為 257.9 億美元,預計到 2031 年將達到 1018.8 億美元,而 2026 年為 324.3 億美元,預測期(2026-2031 年)的複合年成長率為 25.73%。
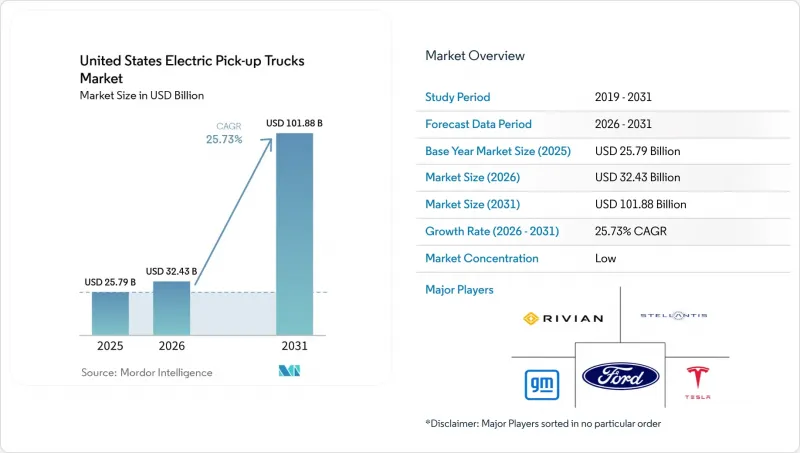
本報告按燃料類型(例如,電池式電動車)、車輛類別(1類和2a類,2b類和3類)、電池容量(例如,小於100千瓦時)、最終用戶(例如,普通消費者)、銷售管道(特許經銷商和直接面對消費者的銷售/線上銷售)以及所在州/省份進行細分。市場預測以價值(美元)和銷售(輛)表示。
美國電動皮卡市場趨勢與洞察
降低電池組成本
國內超級工廠的擴張以及透過材料替代品降低正極材料成本,持續推動電池組價格下降。美國能源局預測,這些成本降低將在2020年代中期之前大幅縮小純電動卡車和汽油卡車之間的價格差距。汽車製造商正在調整其車型陣容,專注於兼顧續航里程和價格優勢的化學成分。電池組成本的降低縮短了總擁有成本(TCO)的投資回收期,而TCO是商用車隊的關鍵指標。資本風險的降低促使金融機構採用更長的租賃期限,從而促進了這項轉型。因此,曾經是最大障礙的價格敏感度正在降低,零售和車隊買家的這項需求均有所緩解。
聯邦和州政府的採購獎勵
雖然聯邦清潔車輛稅額扣抵已於2025年9月到期,但一系列州政府退稅和銷售點稅收優惠政策仍在繼續減輕消費者的初始成本負擔。零排放車輛(ZEV)強制令將這些獎勵與合規目標掛鉤,使消費者利益與製造商義務保持一致。過渡性政策已將需求集中在人口稠密地區,為原始設備製造商(OEM)提供了可預測的立足點,從而確保初始銷售。同時,公共部門車隊採購計畫有助於提高車輛殘值並降低貸款機構風險。因此,這些獎勵措施的組合既能加速需求成長,又能降低風險,從而增強了擴大生產規模的商業理由。
車輛初始價格差異較大
與同類汽油動力汽車相比,電動車相對較高的價格仍然是其大眾市場普及的主要障礙。隨著聯邦政府獎勵的結束,實現價格親民取決於各州政府的扶持政策、汽車製造商的租賃策略以及對二手市場的信心。儘管電池訂閱模式等創新資金籌措方式正在湧現,但其普及程度仍然有限。沒有家用充電基礎設施的購車者還必須承擔額外的安裝費用,這構成了另一個障礙。在規模經濟進一步降低電池成本之前,高昂的初始價格可能會減緩價格敏感地區的市場普及速度。
細分市場分析
預計到2025年,純電動卡車將占美國電動皮卡市場93.12%的佔有率,並預計在2031年之前以31.33%的複合年成長率成長。這標誌著純電動卡車對混合動力汽車的顯著領先優勢。主要汽車製造商的產品規劃強調更大容量的電池組和更快的充電速度,顯示他們對擴大市場佔有率充滿信心。簡化的動力傳動系統降低了維護成本,從而提高了殘值和租賃吸引力。軟體驅動的扭力管理賦予純電動車型卓越的性能優勢,使其深受休閒和商業用戶的青睞。
在充電基礎設施不發達的地區,插電式混合動力車和有效距離式混合動力車仍然是重要的選擇,但隨著基礎設施的普及,它們的優勢正在減弱。配備車載發電機的品牌宣稱其續航里程極長,但市場反應取決於與純電動車的價格比較。如果電池生產速度超過預期,混合動力汽車的市場佔有率可能會進一步下降。同時,政策框架繼續支持「零排放」解決方案,這形成了一種與消費者趨勢相符的系統性壓力。
到2025年,售價在6,001英鎊至14,000英鎊之間的電動皮卡將佔據美國電動皮卡市場61.74%的佔有率,這反映出建設業、公共產業和物流車隊的強勁需求。其載重能力和外部電源供應能力能夠滿足現場作業需求,使該級別車型成為企業買家的首選。此外,車隊運作週期與電池高利用率模式相吻合,從而最大限度地提高了電動動力系統的投資回報率。
同時,輕型卡車市場正經歷更迅猛的成長,預計年複合成長率將達到26.04%,這主要得益於注重生活方式的消費者選擇電動卡車用於通勤和休閒。汽車製造商正在為這些車型量身定做運動化配置,並採用數位化購車流程。隨著電池能量密度的提升,輕型卡車的續航里程將達到以往只有重型卡車才能企及的水平,進一步擴大其目標客戶群。未來,輕型卡車與中型SUV的交叉銷售可能會加劇該細分市場的競爭。
其他好處:
- Excel格式的市場預測(ME)表
- 3個月的分析師支持
目錄
第1章:引言
- 研究假設和市場定義
- 調查範圍
第2章:調查方法
第3章執行摘要
第4章:主要產業趨勢
- 都市化、人口以及對汽車和大眾運輸的需求
- 卡車市場電動車滲透率
- 燃油價格與電費差異(每公里,內燃機汽車與電動車)
- 電動車和內燃機汽車的總擁有成本(TCO)差異
- 資金籌措和所有權模式(貸款、租賃、認購)
- 電池化學成分構成比與電池組能量密度(LFP 與 NMC)
- 家庭、職場和公共充電樁的普及程度/密度
- 快速充電網路覆蓋範圍和輸出頻寬
- 替代燃料基礎設施(燃料電池電動車的氫氣)
- 補貼和消費者獎勵的價值
- 汽車製造商的電動車產品陣容和未來車型計劃
- 價值鍊和通路分析
- 監管、財政和產業政策框架
第5章 市場狀況
- 市場概覽
- 市場促進因素
- 降低電池組成本
- 聯邦和州政府的採購激勵措施
- 企業在車隊脫碳的義務
- 國內電池製造規模擴大
- 雙向充電的收入來源
- 人們對電動卡車的殘值寄予厚望
- 市場限制因素
- 車輛初始價格的巨大差異
- 農村地區直流快速充電網路發展水準較低
- 拖車導致續航里程縮短。
- 經銷商服務網路準備的差距
- 價值/供應鏈分析
- 監理情勢
- 技術展望
- 波特五力模型
第6章 市場規模與成長預測
- 按燃料類別
- 電池式電動車(BEV)
- 混合動力電動車(HEV)
- 插電式混合動力車(PHEV)
- 按車輛類別
- 1 類和 2a 類(總重低於 6,000 英鎊)
- 2b 類及 3 類(總重 6,001 英鎊至 14,000 英鎊)
- 電池容量(千瓦時)
- 小於100度
- 100~150 kWh
- 超過150度
- 最終用戶
- 一般消費者
- 商用及租賃車輛
- 政府/公共產業
- 按銷售管道
- 加盟店
- 直接面對消費者 (DTC) / 在線
- 按州
- 阿拉巴馬州
- 阿拉斯加州
- 亞利桑那
- 阿肯色州
- 加州
- 科羅拉多
- 康乃狄克州
- 德拉瓦
- 佛羅裡達
- 喬治亞
- 夏威夷
- 愛達荷州
- 伊利諾州
- 印第安納州
- 愛荷華州
- 堪薩斯州
- 肯塔基州
- 路易斯安那州
- 緬因州
- 馬裡蘭州
- 麻薩諸塞州
- 密西根州
- 明尼蘇達州
- 密西西比州
- 密蘇裡州
- 蒙大拿
- 內布拉斯加州
- 內華達州
- 新罕布夏州
- 紐澤西州
- 新墨西哥州
- 紐約
- 北卡羅來納州
- 北達科他州
- 俄亥俄州
- 奧克拉荷馬州
- 奧勒岡州
- 賓州
- 羅德島
- 南卡羅來納州
- 南達科他州
- 田納西州
- 德克薩斯州
- 猶他州
- 佛蒙特
- 維吉尼亞
- 華盛頓州
- 西維吉尼亞
- 威斯康辛州
- 懷俄明州
第7章 競爭情勢
- 市場集中度
- 策略趨勢
- 市佔率分析
- 公司簡介
- Ford Motor Company
- General Motors Company
- Mullen Automotive Inc.(Bollinger Motors)
- Stellantis NV(Ram)
- Rivian Automotive, Inc.
- Toyota Motor Corporation
- Tesla, Inc.
- Hercules Electric Vehicles
- Via Motors
- Workhorse Group Inc.
- Hyundai Motor Company
- Kia Corporation
- Isuzu Commercial Truck of America
第8章 市場機會與未來展望
- 評估閒置頻段和未滿足的需求
第9章:執行長面臨的關鍵策略挑戰
According to Mordor Intelligence, the united states electric pick-up trucks market size was valued at USD 25.79 billion in 2025 and estimated to grow from USD 32.43 billion in 2026 to reach USD 101.88 billion by 2031, at a CAGR of 25.73% during the forecast period (2026-2031).
This report is Segmented by Fuel Category (Battery-Electric Vehicles and More), Vehicle Class (Class 1 and 2a and Class 2b and 3), Battery Capacity (Below 100 KWh and More), End-User (Retail Consumers and More), Sales Channel (Franchise Dealerships and Direct-To-Consumer / Online), and Geography. The Market Forecasts are Provided in Terms of Value (USD) and Volume (Units).
United States Electric Pick-up Trucks Market Trends and Insights
Falling Battery-Pack Costs
Pack prices continued to slide as domestic gigafactories scaled and material substitution reduced cathode expense. The U.S. Department of Energy projects that cost reductions will narrow the purchase-price gap between battery-electric and gasoline trucks well before mid-decade. Automakers are realigning model portfolios around chemistries that balance range and affordability. Lower pack costs translate into shorter total-cost-of-ownership payback periods, a metric closely tracked by commercial fleets. Reduced capital risk is prompting finance providers to introduce longer-tenor leases, further smoothing the transition. As a result, price sensitivity, once the dominant barrier, is easing for both retail and fleet buyers.
Federal & State Purchase Incentives
Although the federal clean-vehicle credit expired in September 2025, a patchwork of state rebates and point-of-sale tax relief continues to cushion upfront pricing. The ZEV mandate links these incentives to compliance targets, aligning consumer benefits with manufacturers' obligations. Transitional policies concentrate demand into high-population corridors, giving OEMs a predictable launchpad for early volumes. At the same time, procurement programs for public-sector fleets help backstop residual values, lowering lender exposure. Incentive stacks, therefore, act as both demand accelerant and risk-mitigation tool, reinforcing the business case for expanded production.
High Up-front Vehicle Price Differential
The sticker premium over comparable gasoline trucks still weighs on mass-market adoption. With the federal incentive expired, affordability hinges on state programs, OEM leasing strategies, and secondary-market confidence. Financing innovations such as battery-subscription models are emerging, yet their penetration remains limited. Buyers without home charging access also face additional installation costs, creating a compounded hurdle. Until scale economies shave more capital out of the battery, higher entry prices will temper the speed of uptake in price-sensitive regions.
Other drivers and restraints analyzed in the detailed report include:
- Corporate Fleet Decarbonization Mandates
- Domestic Battery-Cell Manufacturing Expansion
- Sparse Rural DC Fast-Charging Coverage
For complete list of drivers and restraints, kindly check the Table Of Contents.
Segment Analysis
Battery-electric trucks captured 93.12% of the United States electric pick-up trucks market in 2025 and are expected to register a CAGR of 31.33% to 2031, reflecting a decisive lead over hybrid alternatives. Product plans from leading OEMs emphasize larger packs and faster charging, signaling confidence in continued share gains. Greater drivetrain simplicity is lowering service costs, which, in turn, strengthens residual values and lease attractiveness. Software-enabled torque management gives battery-electric models a performance edge that resonates with both recreational and commercial users.
Plug-in and range-extended hybrids remain relevant in regions where charging access is thin, yet their advantage narrows as infrastructure spreads. Brands experimenting with on-board generators pitch extreme-range capability, but market reception hinges on pricing relative to pure battery-electric configurations. Should battery production outpace projections, hybrids may cede even more ground. In parallel, policy frameworks continue to favor zero-tailpipe-emission solutions, creating systemic pressure that aligns with buyer trends.
The 6,001-14,000 lbs segment held 61.74% of the United States electric pick-up trucks market share in 2025, underscoring strong demand from trade, utility, and delivery fleets. Payload capacity and exportable power features meet work-site requirements, making this class the default choice for institutional buyers. Fleet duty cycles also match high-battery utilization profiles, maximizing return on the electrified drivetrain investment.
Conversely, lighter classes are on a faster growth curve, posting a 26.04% CAGR outlook as lifestyle buyers embrace electric trucks for commuting and recreation. Automakers are tailoring these models with sport-oriented trims and digital-first purchase journeys. As battery density improves, lighter trucks will inherit range previously reserved for heavier models, further broadening audience reach. Over time, cross-shopping with mid-size SUVs is likely to raise competitive stakes in the segment.
Complete Report Scope:
- By Fuel Category
- Battery-Electric Vehicles (BEV)
- Hybrid Electric Vehicles (HEV)
- Plug-in Hybrid Electric Vehicles (PHEV)
- By Vehicle Class
- Class 1 and 2a (Below 6,000 lbs GVWR)
- Class 2b and 3 (6,001 to 14,000 lbs GVWR)
- By Battery Capacity (kWh)
- Below 100 kWh
- 100 to 150 kWh
- Over 150 kWh
- By End-User
- Retail Consumers
- Commercial and Leasing Fleets
- Government and Utilities
- By Sales Channel
- Franchise Dealerships
- Direct-to-Consumer (DTC) / Online
- By State
- Alabama
- Alaska
- Arizona
- Arkansas
- California
- Colorado
- Connecticut
- Delaware
- Florida
- Georgia
- Hawaii
- Idaho
- Illinois
- Indiana
- Iowa
- Kansas
- Kentucky
- Louisiana
- Maine
- Maryland
- Massachusetts
- Michigan
- Minnesota
- Mississippi
- Missouri
- Montana
- Nebraska
- Nevada
- New Hampshire
- New Jersey
- New Mexico
- New York
- North Carolina
- North Dakota
- Ohio
- Oklahoma
- Oregon
- Pennsylvania
- Rhode Island
- South Carolina
- South Dakota
- Tennessee
- Texas
- Utah
- Vermont
- Virginia
- Washington
- West Virginia
- Wisconsin
- Wyoming
List of Companies Covered in this Report:
- Ford Motor Company
- General Motors Company
- Mullen Automotive Inc. (Bollinger Motors)
- Stellantis N.V. (Ram)
- Rivian Automotive, Inc.
- Toyota Motor Corporation
- Tesla, Inc.
- Hercules Electric Vehicles
- Via Motors
- Workhorse Group Inc.
- Hyundai Motor Company
- Kia Corporation
- Isuzu Commercial Truck of America
Additional Benefits:
- The market estimate (ME) sheet in Excel format
- 3 months of analyst support
TABLE OF CONTENTS
1 Introduction
- 1.1 Study Assumptions and Market Definition
- 1.2 Scope of the Study
2 Research Methodology
3 Executive Summary
4 Key Industry Trends
- 4.1 Urbanization, Population and Vehicle/Transit Demand
- 4.2 EV Penetration in Truck Market
- 4.3 Fuel vs Electricity Price Spread (per km, ICE vs EV)
- 4.4 EV vs ICE Total Cost of Ownership (TCO) Gap
- 4.5 Financing and Ownership Models (Loans, Leasing, Subscription)
- 4.6 Battery Chemistry Mix and Pack Energy Density (LFP vs NMC)
- 4.7 Home, Workplace and Public Charger Access / Density
- 4.8 Fast-Charging Network Coverage and Power Bands
- 4.9 Alternative Fuels Infrastructure (Hydrogen for FCEVs)
- 4.10 Subsidy and Consumer Incentive Value
- 4.11 OEM EV Line-up and Model Pipeline
- 4.12 Value-Chain & Distribution-Channel Analysis
- 4.13 Regulatory, Fiscal and Industrial Policy Framework
5 Market Landscape
- 5.1 Market Overview
- 5.2 Market Drivers
- 5.2.1 Falling Battery-Pack Costs
- 5.2.2 Federal and State Purchase Incentives
- 5.2.3 Corporate Fleet Decarbonization Mandates
- 5.2.4 Domestic Battery-Cell Manufacturing Expansion
- 5.2.5 Bi-directional Charging Revenue Streams
- 5.2.6 High Residual-Value Expectation for Electric Trucks
- 5.3 Market Restraints
- 5.3.1 High Up-front Vehicle Price Differential
- 5.3.2 Sparse Rural DC Fast-Charging Coverage
- 5.3.3 Towing-Related Range Degradation
- 5.3.4 Dealer Service-Network Readiness Gaps
- 5.4 Value/Supply-Chain Analysis
- 5.5 Regulatory Landscape
- 5.6 Technological Outlook
- 5.7 Porter's Five Forces
- 5.7.1 Threat of New Entrants
- 5.7.2 Bargaining Power of Suppliers
- 5.7.3 Bargaining Power of Buyers
- 5.7.4 Threat of Substitutes
- 5.7.5 Competitive Rivalry
6 Market Size and Growth Forecasts (Value (USD) & Volume (Units))
- 6.1 By Fuel Category
- 6.1.1 Battery-Electric Vehicles (BEV)
- 6.1.2 Hybrid Electric Vehicles (HEV)
- 6.1.3 Plug-in Hybrid Electric Vehicles (PHEV)
- 6.2 By Vehicle Class
- 6.2.1 Class 1 and 2a (Below 6,000 lbs GVWR)
- 6.2.2 Class 2b and 3 (6,001 to 14,000 lbs GVWR)
- 6.3 By Battery Capacity (kWh)
- 6.3.1 Below 100 kWh
- 6.3.2 100 to 150 kWh
- 6.3.3 Over 150 kWh
- 6.4 By End-User
- 6.4.1 Retail Consumers
- 6.4.2 Commercial and Leasing Fleets
- 6.4.3 Government and Utilities
- 6.5 By Sales Channel
- 6.5.1 Franchise Dealerships
- 6.5.2 Direct-to-Consumer (DTC) / Online
- 6.6 By State
- 6.6.1 Alabama
- 6.6.2 Alaska
- 6.6.3 Arizona
- 6.6.4 Arkansas
- 6.6.5 California
- 6.6.6 Colorado
- 6.6.7 Connecticut
- 6.6.8 Delaware
- 6.6.9 Florida
- 6.6.10 Georgia
- 6.6.11 Hawaii
- 6.6.12 Idaho
- 6.6.13 Illinois
- 6.6.14 Indiana
- 6.6.15 Iowa
- 6.6.16 Kansas
- 6.6.17 Kentucky
- 6.6.18 Louisiana
- 6.6.19 Maine
- 6.6.20 Maryland
- 6.6.21 Massachusetts
- 6.6.22 Michigan
- 6.6.23 Minnesota
- 6.6.24 Mississippi
- 6.6.25 Missouri
- 6.6.26 Montana
- 6.6.27 Nebraska
- 6.6.28 Nevada
- 6.6.29 New Hampshire
- 6.6.30 New Jersey
- 6.6.31 New Mexico
- 6.6.32 New York
- 6.6.33 North Carolina
- 6.6.34 North Dakota
- 6.6.35 Ohio
- 6.6.36 Oklahoma
- 6.6.37 Oregon
- 6.6.38 Pennsylvania
- 6.6.39 Rhode Island
- 6.6.40 South Carolina
- 6.6.41 South Dakota
- 6.6.42 Tennessee
- 6.6.43 Texas
- 6.6.44 Utah
- 6.6.45 Vermont
- 6.6.46 Virginia
- 6.6.47 Washington
- 6.6.48 West Virginia
- 6.6.49 Wisconsin
- 6.6.50 Wyoming
7 Competitive Landscape
- 7.1 Market Concentration
- 7.2 Strategic Moves
- 7.3 Market Share Analysis
- 7.4 Company Profiles (Includes Global level Overview, Market level overview, Core Segments, Financials as available, Strategic Information, Market Rank/Share for key companies, Products & Services, and Recent Developments)
- 7.4.1 Ford Motor Company
- 7.4.2 General Motors Company
- 7.4.3 Mullen Automotive Inc. (Bollinger Motors)
- 7.4.4 Stellantis N.V. (Ram)
- 7.4.5 Rivian Automotive, Inc.
- 7.4.6 Toyota Motor Corporation
- 7.4.7 Tesla, Inc.
- 7.4.8 Hercules Electric Vehicles
- 7.4.9 Via Motors
- 7.4.10 Workhorse Group Inc.
- 7.4.11 Hyundai Motor Company
- 7.4.12 Kia Corporation
- 7.4.13 Isuzu Commercial Truck of America
8 Market Opportunities and Future Outlook
- 8.1 White-Space and Unmet-Need Assessment
9 Key Strategic Questions for CEOs

 皮卡車市場分析及預測(至2035年):車輛類型、技術、應用、材料類型、最終用戶、駕駛室類型、燃料類型
 電動皮卡市場:依動力傳動系統、負載容量、車身尺寸及地區分類
 全球大型皮卡市場規模、佔有率、趨勢和成長分析報告:2026-2034年全球小型皮卡市場規模、佔有率、趨勢和成長分析報告(2026-2034)全球皮卡車附件市場規模、佔有率、趨勢和成長分析報告:2026-2034年皮卡車市場規模、佔有率、成長及全球產業分析:按類型、應用和地區的洞察,2026-2034年預測
 皮卡車市場規模、佔有率、趨勢及預測(按燃料類型、車輛類型、應用和地區分類),2026-2034年
 皮卡車改裝後蓋市場:按產品類型、材料、價格範圍、表面處理、最終用戶和分銷管道分類的全球預測(2026-2032年)日本皮卡車市場報告(按燃料類型(柴油、汽油、電動及其他)、車輛類型(輕型、重型)、用途(個人用途、商業用途)和地區分類,2026-2034)
 皮卡車市場規模、佔有率和成長分析(按車輛類型、燃料類型、應用和地區分類)—產業預測(2026-2033 年)