


 |
市場調查報告書
商品編碼
2073589
美國儲能:市場佔有率分析、產業趨勢與統計及成長預測(2026-2031 年)United States Energy Storage - Market Share Analysis, Industry Trends & Statistics, Growth Forecasts (2026 - 2031) |
||||||

※ 本網頁內容可能與最新版本有所差異。詳細情況請與我們聯繫。
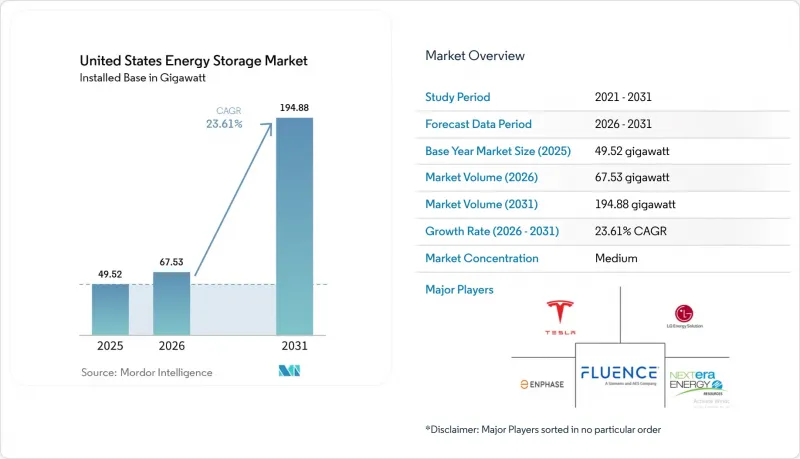
根據 Mordor Intelligence 預測,美國儲能市場規模(以裝置容量計算)預計將從 2025 年的 49.52 吉瓦擴大到 2026 年的 67.53 吉瓦,然後從 2026 年到 2031 年以 23.61% 的複合成長率 2026 年到 2031 年以 23.61。
本報告按技術(電池、抽水蓄能水力發電、氫能儲存等)、額定容量(小於 1 MWh、1-10 MWh、10-100 MWh、大於 100 MWh)、安裝位置(表前和表後)、應用(可再生能源併網、削峰和需求費用管理等)以及安裝位置(表前和表後)、應用(可再生能源併網、抑低尖峰負載和需求費用管理等)以及最終工業用戶(住宅、商業/公用事業、公共產業)進行分類。
美國儲能市場趨勢與洞察
聯邦投資稅額扣抵的延長將提振住宅儲能的需求。
一項持續到2032年的30%稅額扣抵,推動了維修銷售的激增,許多家庭紛紛在現有的屋頂太陽能發電系統上加裝電池。 2025年,住宅電池安裝量年增42%,其中加州、德克薩斯州和亞利桑那州貢獻了68%的成長。特斯拉的Powerwall 3擁有13.5千瓦時的公用容量和整合式混合逆變器,預計到2025年中期將佔據住宅市場約35%的佔有率。由於安裝商將電池系統與新的太陽能發電工程捆綁銷售,以最大限度地利用稅額扣抵抵免,Enphase Energy公司2025年第一季的IQ電池出貨量年增了29%。分時電價(尖峰時段在晚上)使住宅每月可節省80至150美元的電費,而虛擬電廠計畫每年可為每位參與者帶來300至700美元的電網服務收入。因此,該政策十多年來的確定性加快了其實施,並平緩了需求的波動。
聯邦能源管理委員會第 841 號和第 2222 號指令:加速儲能系統批發市場的准入
自2024年以來,區域輸電機構已開放約15吉瓦的新增市場進入。加州獨立系統營運商(CAISO)到2025年第三季將註冊6.2吉瓦的運作中電池儲能容量,其儲能容量可滿足高峰日晚間用電需求的18%。德州電力可靠性委員會(ERCOT)於2025年初運作了集中資源協議,並在六個月內註冊了超過800兆瓦的反向計量電池儲能容量。太平洋西北地區電力市場(PJM)在2025年的容量競標中贏得了2.1吉瓦的儲能容量,此前該運營商修改了規則,獎勵符合4小時持續時間標準的電池。紐約獨立系統營運商(NYISO)的參與度從2024年的2025年增加了兩倍,達到1.8吉瓦,開發商利用了人口密集地區的位置溢價。這些改革已將儲能的定位從一種小眾的輔助服務資產轉變為可靠、可調節的資源,可以直接取代天然氣尖峰發電。
電網連接隊列擁塞導致大型專案延期。
到2025年中期,PJM、MISO和SPP的儲能專案積壓總量超過120吉瓦,涵蓋儲能和混合發電容量,平均等待時間超過42個月。儘管聯邦能源監管委員會(FERC)的叢集調查指令會有所幫助,但其在區域層面的實施速度緩慢,開發商面臨著每千瓦超過50美元的升級成本,這損害了該項目的獲利能力。在MISO,由於營運商放棄了延期項目,2024年的退出率高達38%。在SPP的18吉瓦儲能專案待建工程中,2024年至2025年間僅有1.2吉瓦投入商業營運。由於這些限制,新的儲能設施正轉向ERCOT和CAISO,因為這些地區的併網程序可在兩年內完成,且成本分攤更加清晰。
細分市場分析
2025年,美國能源儲存系統市場中,電池佔裝置容量的81.7%。這主要得益於鋰離子電池組,其在2024年公用事業規模項目中的售價為每千瓦時271美元。磷酸鋰鐵(LFP)和高鎳NMC電池的出貨量約佔95%,這得益於國內超級工廠可獲得的45倍稅額扣抵。鉛酸電池維持了3%的市場佔有率,而釩液流電池和鋅溴電池的先導計畫計畫則針對需要6-10小時放電的應用。在美國能源儲存系統市場中,由於選址有限,抽水蓄能電廠在新建設中的佔有率仍然很小,但現有設施仍在繼續提供慣性力。
預計到2031年,氫氣儲存將以30.5%的複合年成長率成長,主要得益於電力公司對100小時放電容量的競標。三菱電力公司正在將猶他州的燃煤發電廠改造成一座300兆瓦的氫燃料電廠,電解氫氣生產將儲存在鹽隧道中。壓縮空氣項目,例如Hydrostall公司在加州開發的500兆瓦項目,可提供8小時的放電持續時間,且資本成本低於氫氣儲能。飛輪儲能系統和熱力儲能系統分別繼續在頻率調節和工業供熱等細分市場中使用,但兩者的容量佔有率均遠低於1%。
到2025年,10-100兆瓦時容量的儲能系統將佔總容量的38.6%,這反映出電力公司傾向於採用模組化的20-50兆瓦儲能模組,這些模組與太陽能發電工程相契合,並能避免複雜的電網升級。 Fluence Gridstack和Powin Centipede憑藉其工廠組裝的貨櫃式儲能系統在該領域處於領先地位,這些系統能夠縮短施工時間。在美國市場,隨著配電公司部署饋線規模的儲能裝置以推遲變電站升級,此類能源儲存系統的市場規模預計將穩定成長。
容量超過100兆瓦時的專案正以36.1%的複合年成長率快速擴張。 Vistra位於加州的Moss Landing專案預計在2024年達到750兆瓦/3000兆瓦時,證明了吉瓦級電池儲能系統的經濟可行性。 AES和LS Power目前正在德克薩斯州和內華達州開發多個容量超過300兆瓦時的項目,並利用稀缺定價和容量付費機制。容量低於1兆瓦時的儲能系統主要針對住宅用戶,在加州,預計到2025年,新增屋頂太陽能發電系統的併網率將超過85%。
其他好處:
- Excel格式的市場預測(ME)表
- 3個月的分析師支持
目錄
第1章:引言
- 研究假設和市場定義
- 調查範圍
第2章:調查方法
第3章執行摘要
第4章 市場狀況
- 市場概覽
- 市場促進因素
- 聯邦投資稅額扣抵的延長正在提振住宅儲能的需求。
- FERC 指令 841/2222:促進儲能設備進入批發市場。
- 加州第 21 號法規和 NEM 3.0 正在推動電錶後置安裝的引入。
- ERCOT 和 WECC 的太陽能發電和儲能設施項目數量增加。
- 透過與IRA相關的國內電池製造稅額扣抵抵免降低BESS成本
- 積極進取的電力公司透過綜合資源規劃 (IRP) 推動逐步淘汰燃煤電廠,並引入長期儲能設施。
- 市場限制因素
- 由於互連隊列堵塞,導致大型專案延期
- 人們對鋰離子電池電解(包括 PFAS)的安全性表示擔憂,這促使人們推出了更嚴格的消防安全法規。
- 各州之間的獎勵機制不平衡阻礙了全國範圍內的實施。
- 供應鏈中關鍵礦物(鋰、鎳、鈷)所面臨的地緣政治風險
- 供應鏈分析
- 監理展望
- 技術展望
- 波特五力模型
- 設備容量分析
- PESTLE分析
第5章 市場規模與成長預測
- 透過技術
- 電池(鋰離子電池、鉛酸電池、液流電池、鈉硫電池等)
- 抽水蓄能水力發電
- 壓縮空氣儲能
- 飛輪儲能
- 熱能儲存
- 氫能儲存
- 按額定容量
- 小於1兆瓦時
- 1~10 MWh
- 10~100 MWh
- 100兆瓦時或以上
- 按安裝位置
- 在電錶前面
- 儀錶板後面
- 透過使用
- 可再生能源的整合
- 抑低尖峰負載和基於需求的定價管理
- 頻率限制
- 緊急電源/容錯
- 最終用戶
- 住宅
- 商業和工業用途
- 公用事業
第6章 競爭情勢
- 市場集中度
- 策略趨勢(併購、聯盟、購電協議)
- 市場佔有率分析(主要公司的市場排名和佔有率)
- 公司簡介
- Tesla Inc.
- Fluence Energy LLC
- LG Energy Solution Ltd.
- Sungrow Power Supply Co. Ltd.
- BYD Co. Ltd.
- Enphase Energy Inc.
- NextEra Energy Resources LLC
- AES Corporation
- Powin Energy Corp.
- Samsung SDI Co. Ltd.
- Panasonic Holdings Corp.
- Eos Energy Enterprises Inc.
- EnerSys
- KORE Power Inc.
- Form Energy Inc.
- CATL
- Honeywell International Inc.
- Hydrostor Inc.
- Voith GmbH & Co. KGaA
- Andritz AG
- Siemens Energy AG
第7章 市場機會與未來展望
According to Mordor Intelligence, the united states energy storage market size in terms of installed base is expected to grow from 49.52 gigawatt in 2025 to 67.53 gigawatt in 2026 and is forecast to reach 194.88 gigawatt by 2031 at 23.61% CAGR over 2026-2031.
This report is Segmented by Technology (Batteries, Pumped Hydro Storage, Hydrogen Energy Storage, and More), Capacity Rating (Up To 1 MWh, 1 To 10 MWh, 10 To 100 MWh, and Above 100 MWh), Installation (Front-Of-The-Meter and Behind-The-Meter), Application (Renewable Integration, Peak Shaving and Demand Charge Management, and More), and End User (Residential, Commercial and Industrial, and Utility).
United States Energy Storage Market Trends and Insights
Federal Investment Tax Credit Extension Boosting Residential Storage Demand
The 30% standalone storage credit now available until 2032 unlocked a surge of retrofit sales as households add batteries to existing rooftop solar arrays. Residential installations rose 42% year over year in 2025, with California, Texas, and Arizona responsible for 68% of those additions. Tesla's Powerwall 3, featuring 13.5 kWh usable capacity and an integrated hybrid inverter, captured roughly 35% of the residential segment by mid-2025. Enphase Energy shipped 29% more IQ Battery units during Q1 2025 as installers bundled storage with new solar projects to maximize customer tax savings. Time-of-use rates that peak during evening hours let homeowners trim monthly bills by USD 80-150, and virtual power plant programs add USD 300-700 in annual grid-service revenue per participant. The decade-long policy certainty is therefore accelerating adoption and smoothing demand cycles.
FERC Order 841 & 2222 Accelerating Wholesale-Market Participation of Storage
Regional transmission organizations have opened roughly 15 GW of incremental market access since 2024. CAISO registered 6.2 GW of active battery participation by Q3 2025, with storage supplying up to 18% of evening peak demand on high-load days. ERCOT activated its aggregated-resource protocol in early 2025, enrolling more than 800 MW of behind-the-meter batteries within six months. PJM cleared 2.1 GW of storage in its 2025 capacity auction after revising rules that now pay batteries meeting four-hour duration thresholds. NYISO participation tripled between 2024 and 2025 to 1.8 GW as developers capitalized on locational premiums in densely populated zones. These reforms reposition storage from a niche ancillary-service asset into a dependable dispatchable resource that directly displaces gas peakers.
Interconnection Queue Congestion Delaying Large-Scale Projects
Backlogs in PJM, MISO, and SPP exceeded 120 GW of storage and hybrid capacity by mid-2025, with average wait times surpassing 42 months. FERC's cluster-study directive will help, but regional implementation lags, and developers face upgrade fees above USD 50 per kW that erode project economics. MISO recorded a 38% withdrawal rate in 2024 as sponsors abandoned delayed projects. SPP's 18 GW storage queue delivered only 1.2 GW of commercial operations between 2024 and 2025. These constraints push new capacity toward ERCOT and CAISO, which process interconnections within two years and offer clearer cost allocations.
Other drivers and restraints analyzed in the detailed report include:
- Solar-plus-Storage Pipeline Growth Across ERCOT and WECC
- IRA-Linked Domestic Battery-Manufacturing Credits Lowering BESS Cost
- PFAS Li-ion Electrolyte Safety Concerns Triggering Stricter Fire Codes
For complete list of drivers and restraints, kindly check the Table Of Contents.
Segment Analysis
The energy storage systems in the United States market saw batteries secure 81.7% of installed capacity in 2025, leveraging lithium-ion packs that cost USD 271 per kWh for utility-scale projects in 2024. Lithium-iron-phosphate and high-nickel NMC chemistries together account for about 95% of shipments, supported by domestic gigafactories that enjoy 45X credits. Lead-acid retains a 3% niche, while vanadium-flow and zinc-bromine pilots address applications needing 6- to 10-hour discharge. The energy storage systems in the United States market share for pumped hydro remains minimal for new builds because siting options are limited, though existing facilities continue to provide inertia.
Hydrogen storage is poised for a 30.5% CAGR through 2031, spurred by utility solicitations for 100-hour discharge capability. Mitsubishi Power is converting a Utah coal plant into a 300 MW hydrogen-fueled generator that will store electrolytic hydrogen in salt caverns. Compressed-air projects, such as Hydrostor's 500 MW California development, offer 8-hour durations at lower capital cost than hydrogen. Flywheel and thermal systems continue to serve frequency and industrial heat niches, respectively, each well under 1% of capacity.
The 10-100 MWh class held 38.6% of 2025 capacity, reflecting utility preference for modular 20-50 MW blocks that match solar projects and avoid complex transmission upgrades. Fluence Gridstack and Powin Centipede dominate this tier with factory-assembled containers that compress construction schedules. Energy storage systems in the United States market size for this band is set to rise steadily as distribution utilities deploy feeder-scale assets to defer substation upgrades.
Projects above 100 MWh are expanding at a 36.1% CAGR. Vistra's Moss Landing site in California reached 750 MW / 3,000 MWh in 2024, demonstrating the economic case for gigawatt-hour-scale batteries. AES and LS Power have multiple 300 MWh-plus projects underway in Texas and Nevada to exploit scarcity pricing and capacity payments. Sub-1 MWh systems serve the residential sector, where attachment rates in California exceeded 85% for new rooftop solar in 2025.
Complete Report Scope:
- By Technology
- Batteries (Lithium-ion, Lead-acid, Flow Batteries, Sodium-sulfur and Others)
- Pumped Hydro Storage
- Compressed Air Energy Storage
- Flywheel Storage
- Thermal Energy Storage
- Hydrogen Energy Storage
- By Capacity Rating
- Below 1 MWh
- 1 to 10 MWh
- 10 to 100 MWh
- Above 100 MWh
- By Installation
- Front-of-the-Meter
- Behind-the-Meter
- By Application
- Renewable Integration
- Peak Shaving and Demand Charge Management
- Frequency Regulation
- Backup Power/Resilience
- By End User
- Residential
- Commercial and Industrial
- Utility
List of Companies Covered in this Report:
- Tesla Inc.
- Fluence Energy LLC
- LG Energy Solution Ltd.
- Sungrow Power Supply Co. Ltd.
- BYD Co. Ltd.
- Enphase Energy Inc.
- NextEra Energy Resources LLC
- AES Corporation
- Powin Energy Corp.
- Samsung SDI Co. Ltd.
- Panasonic Holdings Corp.
- Eos Energy Enterprises Inc.
- EnerSys
- KORE Power Inc.
- Form Energy Inc.
- CATL
- Honeywell International Inc.
- Hydrostor Inc.
- Voith GmbH & Co. KGaA
- Andritz AG
- Siemens Energy AG
Additional Benefits:
- The market estimate (ME) sheet in Excel format
- 3 months of analyst support
TABLE OF CONTENTS
1 Introduction
- 1.1 Study Assumptions & Market Definition
- 1.2 Scope of the Study
2 Research Methodology
3 Executive Summary
4 Market Landscape
- 4.1 Market Overview
- 4.2 Market Drivers
- 4.2.1 Federal Investment Tax Credit Extension Boosting Residential Storage Demand
- 4.2.2 FERC Order 841/2222 Accelerating Wholesale?Market Participation of Storage
- 4.2.3 California Rule 21 & NEM 3.0 Driving Behind-the-Meter Deployments
- 4.2.4 Solar-plus-Storage Pipeline Growth Across ERCOT and WECC
- 4.2.5 IRA-Linked Domestic Battery-Manufacturing Tax Credits Lowering BESS Cost
- 4.2.6 Aggressive Utility IRPs Retiring Coal and Adding Long-Duration Storage
- 4.3 Market Restraints
- 4.3.1 Interconnection Queue Congestion Delaying Large-Scale Projects
- 4.3.2 PFAS Li-ion Electrolyte Safety Concerns Triggering Stricter Fire Codes
- 4.3.3 Uneven State-Level Incentives Undermining National Roll-out
- 4.3.4 Supply-Chain Critical-Minerals Exposure (Li, Ni, Co) to Geopolitical Risk
- 4.4 Supply-Chain Analysis
- 4.5 Regulatory Outlook
- 4.6 Technological Outlook
- 4.7 Porter's Five Forces
- 4.7.1 Bargaining Power of Suppliers
- 4.7.2 Bargaining Power of Buyers
- 4.7.3 Threat of New Entrants
- 4.7.4 Threat of Substitutes
- 4.7.5 Competitive Rivalry
- 4.8 Installed Capacity Analysis
- 4.9 PESTLE Analysis
5 Market Size & Growth Forecasts
- 5.1 By Technology
- 5.1.1 Batteries (Lithium-ion, Lead-acid, Flow Batteries, Sodium-sulfur and Others)
- 5.1.2 Pumped Hydro Storage
- 5.1.3 Compressed Air Energy Storage
- 5.1.4 Flywheel Storage
- 5.1.5 Thermal Energy Storage
- 5.1.6 Hydrogen Energy Storage
- 5.2 By Capacity Rating
- 5.2.1 Below 1 MWh
- 5.2.2 1 to 10 MWh
- 5.2.3 10 to 100 MWh
- 5.2.4 Above 100 MWh
- 5.3 By Installation
- 5.3.1 Front-of-the-Meter
- 5.3.2 Behind-the-Meter
- 5.4 By Application
- 5.4.1 Renewable Integration
- 5.4.2 Peak Shaving and Demand Charge Management
- 5.4.3 Frequency Regulation
- 5.4.4 Backup Power/Resilience
- 5.5 By End User
- 5.5.1 Residential
- 5.5.2 Commercial and Industrial
- 5.5.3 Utility
6 Competitive Landscape
- 6.1 Market Concentration
- 6.2 Strategic Moves (M&A, Partnerships, PPAs)
- 6.3 Market Share Analysis (Market Rank/Share for key companies)
- 6.4 Company Profiles (includes Global level Overview, Market level overview, Core Segments, Financials as available, Strategic Information, Products & Services, and Recent Developments)
- 6.4.1 Tesla Inc.
- 6.4.2 Fluence Energy LLC
- 6.4.3 LG Energy Solution Ltd.
- 6.4.4 Sungrow Power Supply Co. Ltd.
- 6.4.5 BYD Co. Ltd.
- 6.4.6 Enphase Energy Inc.
- 6.4.7 NextEra Energy Resources LLC
- 6.4.8 AES Corporation
- 6.4.9 Powin Energy Corp.
- 6.4.10 Samsung SDI Co. Ltd.
- 6.4.11 Panasonic Holdings Corp.
- 6.4.12 Eos Energy Enterprises Inc.
- 6.4.13 EnerSys
- 6.4.14 KORE Power Inc.
- 6.4.15 Form Energy Inc.
- 6.4.16 CATL
- 6.4.17 Honeywell International Inc.
- 6.4.18 Hydrostor Inc.
- 6.4.19 Voith GmbH & Co. KGaA
- 6.4.20 Andritz AG
- 6.4.21 Siemens Energy AG
7 Market Opportunities & Future Outlook
- 7.1 White-Space & Unmet-Need Assessment

 儲能線束市場:全球市場預測,2026-2032年
 2026-2030年全球先進能源市場
 先進液化空氣儲能市場分析與預測(至2035年):按類型、產品、技術、組件、應用、製程、最終用戶、功能及安裝類型分類
 公用事業規模太陽能發電市場:策略分析與預測(2026-2031 年)
 低溫熱能儲存市場:按類型、產品類型、服務、技術、組件、應用、國家和地區分類-全球產業分析、市場規模、市場佔有率及2026年至2033年預測電動車充電市場可再生能源應用:市場規模、佔有率、成長、全球產業分析、區域趨勢及2026-2034年預測
 儲能:市場佔有率分析、產業趨勢與統計、成長預測(2026-2031)
 2026年全球儲能市場報告商業和工業儲能:市場佔有率分析、行業趨勢和統計數據以及成長預測(2026-2031 年)
 儲能轉捩點(2026年):AIDC透過「雙引擎」方式推動需求擴張