

 |
市場調查報告書
商品編碼
2062470
商業和工業儲能:市場佔有率分析、行業趨勢和統計數據以及成長預測(2026-2031 年)Commercial and Industrial Energy Storage - Market Share Analysis, Industry Trends & Statistics, Growth Forecasts (2026 - 2031) |
||||||
※ 本網頁內容可能與最新版本有所差異。詳細情況請與我們聯繫。
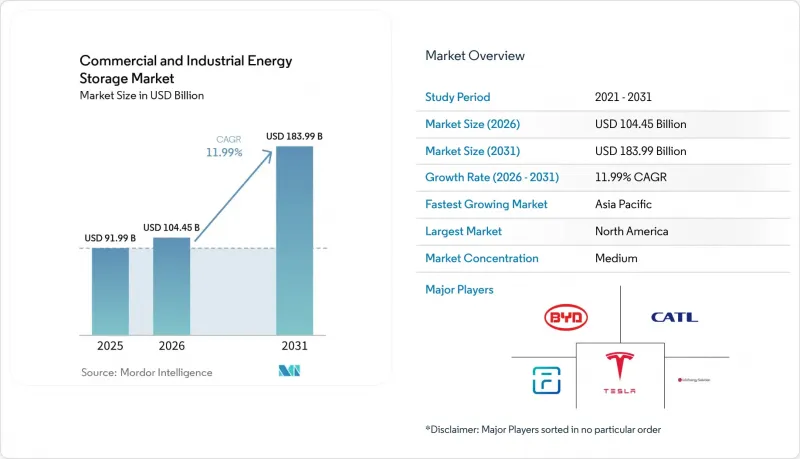
根據 Mordor Intelligence 預測,商業和工業儲能市場規模將從 2025 年的 919.9 億美元成長到 2026 年的 1044.5 億美元,到 2031 年將達到 1839.9 億美元,2026 年至 2031 年的複合成長率為 11.9%。
本報告按技術(鋰離子電池、鈉離子電池、鉛酸電池、液流電池及其他)、應用(尖峰用電調節、負荷轉移、備用電源/UPS及其他)、最終用戶(商業建築、資料中心及其他)和地區(北美、亞太、歐洲、南美、中東和非洲)進行細分。市場預測以美元計價。
全球商業及工業儲能市場趨勢及洞察
鋰離子電池的成本曲線正接近每千瓦時 90 美元以下的水平。
預計到2025年,固定式電池組的平均價格將達到每千瓦時70美元,較2020年下降35%,但仍高於高成本地區商業設施通常3-5年投資回收期所需的水平。中國製造規模的擴大以及向無鈷磷酸鐵鋰電池(LFP)化學成分的轉變,已使材料成本降低了高達20%。資本支出成本的降低刺激了商業和工業儲能市場的新需求,並將目標客戶群從超大規模用戶擴展到中型工業工廠。 LG能源解決方案公司與特斯拉之間價值43億美元的磷酸鐵鋰電池交易等重大供應合約表明,未來18個月內價格將呈下降趨勢。鈉離子電池試驗生產線和早期固態電池預計將在2026年底前將平均安裝成本降至每千瓦時350美元以下,從而進一步加速成本敏感型產業的採用。
全球可再生能源強制性規定與企業 RE100 目標
超過400家跨國公司承諾轉型使用100%再生能源,其年總消耗量超過380太瓦時(TWh),大致相當於德國的電力需求。這些承諾迫使大型設施儲存白天太陽能和夜間風能產生的剩餘電力,並在晚高峰時段供電,將波動不定的電力輸出轉化為更可控的供電來源。谷歌位於明尼蘇達州的300兆瓦/30吉瓦時計畫將於2025年中期投入運作,該計畫已使其高峰時段對石化燃料發電的依賴減少了85%,是企業大規模採用再生能源的典範。在歐洲,「REPowerEU」計畫要求到2030年,45%的電力必須來自可再生能源,這明確地將儲能目標與緩解電網擁塞聯繫起來。鑑於德國工業業者目前面臨接近每兆瓦時100歐元的限電罰款,電池正成為經濟有效的風險對沖手段。
與柴油發電機相比:資本投資成本高
雖然安裝成本在每千瓦時 280 美元至 580 美元之間,但柴油發電機的初始成本為每千瓦 500 美元至 1000 美元。儘管柴油發電機的生命週期成本更低,但對於缺乏低成本資金籌措管道的中小型企業 (SME) 而言,它們仍然是一個障礙。能源即服務 (EaaS) 合約有助於緩解資金壁壘,但也增加了交易的複雜性。
細分市場分析
到2025年,鋰離子電池技術將佔據商業和工業儲能市場80.4%的佔有率。這主要得益於其在80%放電深度下超過6000次的循環壽命以及較低的熱失控風險。寧德時代和比亞迪等公司已實現商業化的鈉離子電池平台,在原料豐富且價格優於磷酸鋰鐵鋰(LFP)的推動下,到2031年將以37.5%的複合年成長率快速成長。雖然鈉離子電池的能量密度低於鎳錳電容(NMC)電池,但倉庫屋頂和地面安裝空間充足,彌補了這一劣勢,使其對商業用戶更具優勢。鉛酸電池仍佔據通訊備用電源這一細分市場,但由於環境廢棄物法規的日益嚴格,其市場佔有率正在逐年下降。液流電池,特別是釩液流電池和鐵液流電池,正逐漸確立其在超過4小時的長時放電應用中的地位。儲能系統(ESS)計劃在2025年為工業微電網提供500兆瓦時的儲能容量。混合型超級電容雖然已在PJM等市場獲得頻率調節契約,但其較低的能量密度限制了目標市場規模。固態電池仍處於示範階段,由於規模生產方面仍存在挑戰,在2028年之前不太可能廣泛應用。目前在美國和歐洲普遍採用的UL 9540A標準強制性測試,每個項目將額外增加3萬至5萬美元的成本,但對於符合標準的供應商而言,它可以降低高達25%的保險費,從而帶來全生命週期成本效益。
汽車二手電池組(剩餘容量70-80%時即被淘汰)因其總成本比新系統低40-50%,正吸引著注重性價比的買家。然而,標準化進程卻相對滯後。保固機制、電芯可追溯性以及化學成分的多樣性都使整合變得複雜。由此產生的零散局面阻礙了其廣泛應用,儘管西班牙和加州的一些區域性試點計畫顯示出其對價格敏感的商業用戶具有一定的吸引力。整體而言,技術多樣化在拓展選擇的同時,也鞏固了鋰離子電池的現有主導地位,並使其在商業和工業儲能市場中保持主導地位。
區域分析
到2025年,北美將佔全球儲能裝機量的36.5%,其中美國佔據主導地位,這得益於獨立儲能系統投資稅額扣抵(ITC)政策取消了共址安裝要求。加州發揮主導作用,預計到2025年底,在其「自發電獎勵計畫」的支持下,商業儲能裝機量將超過3吉瓦,該計畫提供高達每千瓦時200美元的補貼。德克薩斯州緊隨其後,因為ERCOT的純電價市場非常適合批發套利,夏季高峰期價格波動超過每千瓦時0.20美元。加拿大的成長主要集中在安大略省和亞伯達,這兩個省的獎勵和微電網需求相契合。墨西哥仍處於發展階段,低成本和資金籌措困難限制了儲能裝機量,儘管蒙特雷製造區正在進行先導計畫。亞太地區是成長最快的地區,預計到2031年將以23.3%的複合年成長率成長。中國垂直整合的巨頭企業供應了全球一半以上的商用儲能系統,使平均系統成本比歐美同類產品低20-30%。印度強制規定,超過500千瓦的商用太陽能發電系統必須配備兩小時的電池儲能,古吉拉突邦和馬哈拉斯特拉邦的推廣活動正在加速。日本和韓國優先考慮應對自然災害和供應鏈中斷的韌性,鼓勵豐田等企業在其廠區內安裝電池儲能系統。東南亞國協的進展不一;泰國和越南正吸引外國工廠採用電池儲能系統,而印尼的柴油補貼政策則減緩了電池儲能系統的普及。澳洲和紐西蘭由於零售電費高企以及屋頂太陽能發電的廣泛應用,正在積極推廣電池儲能系統,這提高了自用電的效益。
在德國工業中心,由於可再生能源每年有超過200天的現貨價格為負,為了避免棄電費用,電池儲能系統正在廣泛安裝。在英國,容量市場競標傾向於能夠運作數小時的資產,這促使超級市場和宅配中心積極簽訂12年期的電池儲能系統安裝合約。法國、西班牙和義大利正在擴大部署規模,以整合不斷成長的太陽能發電工程,並實現其「Fit for 55」脫碳目標。北歐國家正在平衡風能和水力發電,但仍在安裝電池儲能系統以穩定頻率並緩解電網擁塞。由於電價低且缺乏獎勵,俄羅斯在這方面進展緩慢,其部署僅限於偏遠礦區和油氣前哨站。在南美洲、中東和非洲,巴西、阿拉伯聯合大公國和南非正在購物中心和電信設施中進行試點計畫。儘管存在區域差異,但目前各大洲均有商業項目記錄,凸顯了商業和工業儲能市場的地域覆蓋範圍。
其他好處:
- Excel格式的市場預測(ME)表
- 3個月的分析師支持
目錄
第1章:引言
- 研究假設和市場定義
- 調查範圍
第2章:調查方法
第3章執行摘要
第4章 市場狀況
- 市場概覽
- 市場促進因素
- 鋰離子電池的成本曲線正接近每千瓦時 90 美元以下的水平。
- 全球可再生能源採用義務與企業 RE100 目標
- 美國投資稅收抵免 (ITC) 和全球同等獎勵,用於支持獨立式儲能系統
- 全球工商業能源需求高峰不斷上升
- 對超大規模資料中心電網部署延遲的需求
- 需要可調節負載轉移的合成購電協議激增
- 市場限制因素
- 與柴油發電機相比,高昂的資本投資成本
- 關鍵礦產供應鏈的波動性
- 互聯互通和授權法規脫節
- 都市區室內儲能系統遵守消防安全法規的成本
- 供應鏈分析
- 監理情勢
- 技術展望
- 電池化學的進展
- 人工智慧和物聯網在急診醫療服務/皮膚病學中的作用
- 二次電池的應用
- 新興的混合型長壽命系統
- 波特五力分析
- 價格分析
- 宏觀經濟和地緣政治因素的影響
- 供應鏈中斷
- 關稅和貿易政策趨勢
- 投資和利率趨勢
第5章 市場規模與成長預測
- 透過技術
- 鋰離子電池(LFP、NMC/NCA、LCO)
- 鈉離子
- 鉛酸蓄電池(閥控式鉛酸蓄電池,液態)
- 液流電池(釩液流電池、鋅溴液流電池)
- 混合超級電容系統
- 其他新興化學技術(全固體、金屬空氣)
- 透過使用
- 尖峰用電調節
- 負荷轉移
- 緊急電源/UPS
- 可再生能源的整合
- 輔助服務(頻率調整)
- 基於需求的定價管理
- 相容於電動車快速充電
- 微電網穩定化
- 最終用戶
- 商業設施(零售、辦公室)
- 工業設施(製造、倉儲)
- 資料中心
- 教育機構
- 醫療機構
- 通訊基地台和邊緣站點
- 電動車隊營運商和充電中心
- 公共基礎設施(機場、鐵路)
- 按地區
- 北美洲
- 美國
- 加拿大
- 墨西哥
- 歐洲
- 英國
- 德國
- 法國
- 西班牙
- 北歐國家
- 俄羅斯
- 其他歐洲國家
- 亞太地區
- 中國
- 印度
- 日本
- 韓國
- 東南亞國協
- 澳洲和紐西蘭
- 其他亞太國家
- 南美洲
- 巴西
- 阿根廷
- 哥倫比亞
- 其他南美國家
- 中東和非洲
- 阿拉伯聯合大公國
- 沙烏地阿拉伯
- 南非
- 埃及
- 其他中東和非洲國家
- 北美洲
第6章 競爭情勢
- 市場集中度
- 策略趨勢(併購、聯盟、購電協議)
- 市場佔有率分析(主要公司的市場排名和佔有率)
- 公司簡介
- Tesla Inc.
- Fluence Energy
- LG Energy Solution
- BYD Co. Ltd.
- CATL
- Panasonic Holdings Corp.
- Saft(TotalEnergies)
- Samsung SDI
- Sungrow Power Supply
- Powin Energy
- Wartsila
- Eos Energy Enterprises
- ABB
- Schneider Electric
- Eaton
- Enphase Energy
- Hitachi Energy
- Generac Power Systems
- Kokam
- ESS Inc.
- EnerSys
第7章 市場機會與未來展望
According to Mordor Intelligence, the commercial and industrial energy storage market size is expected to increase from USD 91.99 billion in 2025 to USD 104.45 billion in 2026 and reach USD 183.99 billion by 2031, growing at a CAGR of 11.99% over 2026-2031.
This report is Segmented by Technology (Lithium-Ion, Sodium-Ion, Lead-Acid, Flow Batteries, and Others), Application (Peak Shaving, Load Shifting, Backup Power/UPS, and More), End-User (Commercial Building, Data Centers, and More), and Geography (North America, Asia-Pacific, Europe, South America, and Middle East and Africa). Market Forecasts are Provided in Value (USD).
Global Commercial and Industrial Energy Storage Market Trends and Insights
Li-ion Cost Curve Approaching Sub-USD 90/kWh
Stationary battery pack prices averaged USD 70 per kWh in 2025, a 35% drop from 2020, crossing the point where three-to-five-year paybacks become common for commercial facilities in high-tariff regions. Manufacturing scale in China and the pivot to cobalt-free LFP chemistries have trimmed material costs by up to 20%. Lower capex broadens the addressable base from hyperscale users to mid-sized industrial plants, stimulating fresh demand for the commercial and industrial energy storage market. Major supply contracts, such as LG Energy Solution's USD 4.3 billion LFP deal with Tesla, signal sustained downward pricing over the next 18 months. Pilot lines for sodium-ion and early solid-state designs are expected to push average installed costs beneath USD 350 per kWh by late 2026, deepening penetration across cost-sensitive sectors.
Global Renewable Mandates & Corporate RE100 Targets
More than 400 multinational firms have pledged 100% renewable electricity, together consuming upwards of 380 TWh annually, roughly Germany's load. These commitments force large facilities to store surplus midday solar and nighttime wind for evening peaks, converting variable output into dispatchable supply. Google's 300 MW / 30 GWh Minnesota project, operational since mid-2025, cuts fossil peaker reliance by 85% and exemplifies large-scale corporate adoption. In Europe, the REPowerEU plan mandates that 45% of electricity be renewable by 2030, explicitly linking storage targets to congestion relief. Industrial operators in Germany now face curtailment penalties approaching EUR 100 per MWh, making batteries a cost-effective hedge.
High CAPEX vs Diesel Gensets
Installed costs of USD 280-580/kWh still exceed a diesel generator's USD 500-1,000/kW upfront, deterring smaller enterprises lacking low-cost finance, despite superior lifetime economics. Energy-as-a-service contracts help mitigate capital barriers but add transaction complexity.
Other drivers and restraints analyzed in the detailed report include:
- Stand-alone Storage ITC & Equivalent Global Incentives
- Rising Global C&I Peak-Demand Charges
- Critical-Mineral Supply-Chain Volatility
For complete list of drivers and restraints, kindly check the Table Of Contents.
Segment Analysis
Lithium-ion technologies controlled 80.4% of the commercial and industrial energy storage market in 2025, thanks to cycle lives exceeding 6,000 cycles at 80% depth of discharge and lower thermal-runaway risk. Sodium-ion platforms, commercialized by CATL and BYD, are expanding at a 37.5% CAGR through 2031, enabled by abundant raw materials and parity pricing with LFP for stationary duties. Although energy density trails NMC, warehouse rooftops and ground-mount yards offer ample space, softening the penalty for commercial users. Lead-acid remains in telecom backup niches, but environmental disposal rules erode its share each year. Flow batteries, especially vanadium redox and iron-flow variants, are carving out long-duration roles beyond four-hour discharge, with ESS Inc. delivering 500 MWh to industrial microgrids in 2025. Hybrid supercapacitors secure frequency-regulation contracts in markets like PJM, though low energy density caps their addressable segment. Solid-state chemistries linger in pilot stages; wide deployment before 2028 appears unlikely, given unresolved manufacturing scale-up hurdles. Mandatory UL 9540A testing, now common in the United States and Europe, adds USD 30,000-50,000 per project but cuts insurance costs by up to 25%, improving lifecycle economics for compliant suppliers.
Second-life automotive packs, retired at 70-80% state of health, entice value-oriented buyers, offering landed costs 40-50% below new systems. Standardization, however, lags: warranty schemes, cell traceability, and varying chemistries complicate integration. The resulting patchwork slows widespread adoption, but localized pilots in Spain and California illustrate promise for price-sensitive commercial users. On balance, technology diversification widens choice yet reinforces lithium-ion's incumbency, sustaining its leading position in the commercial and industrial energy storage market.
Geography Analysis
North America captured 36.5% of global installations in 2025, with the United States accounting for the lion's share after the standalone-storage Investment Tax Credit removed co-location requirements. California leads, exceeding 3 GW of commercial deployments by the end of 2025 under the Self-Generation Incentive Program that rebates up to USD 200 per kWh. Texas follows as ERCOT's energy-only market swings more than USD 0.20 per kWh during summer peaks, ideal for wholesale arbitrage. Canada's growth centers on Ontario and Alberta, where provincial incentives and microgrid needs intersect. Mexico remains nascent; lower tariffs and scarce financing limit adoption, though pilot projects are underway in Monterrey manufacturing zones. Asia-Pacific is the fastest-growing region, projected at a 23.3% CAGR through 2031. China's vertically integrated giants supply more than half of worldwide commercial shipments, keeping average system costs 20-30% below Western equivalents. India mandates two-hour storage for commercial solar above 500 kW, igniting activity in Gujarat and Maharashtra. Japan and South Korea prioritize resilience against natural disasters and supply-chain shocks, prompting corporate buyers like Toyota to install on-site batteries. ASEAN states advance unevenly, Thailand and Vietnam attract FDI-backed factories that embrace storage, but diesel subsidies in Indonesia slow progress. Australia and New Zealand deploy aggressively because high retail tariffs and prolific rooftop solar heighten self-consumption benefits.
Germany's industrial hubs deploy batteries to dodge curtailment fees when renewables drive spot prices negative more than 200 days each year. The United Kingdom's capacity-market auctions reward multi-hour assets, spurring supermarket chains and parcel depots to contract storage under twelve-year agreements. France, Spain, and Italy scale installations to integrate growing solar pipelines and comply with Fit-for-55 decarbonization targets. The Nordics pair wind with hydropower balancing, yet still adopt batteries for frequency support and grid congestion relief. Russia lags due to low tariffs and limited incentives; deployments are confined to remote mines and oil-and-gas outposts. In South America, the Middle East & Africa, Brazil, the UAE, and South Africa exhibit pilot activity in malls and telecom sites. Regional disparities notwithstanding, every continent now records commercial projects, underscoring the broad geographic spread of the commercial and industrial energy storage market.
- Tesla Inc.
- Fluence Energy
- LG Energy Solution
- BYD Co. Ltd.
- CATL
- Panasonic Holdings Corp.
- Saft (TotalEnergies)
- Samsung SDI
- Sungrow Power Supply
- Powin Energy
- Wartsila
- Eos Energy Enterprises
- ABB
- Schneider Electric
- Eaton
- Enphase Energy
- Hitachi Energy
- Generac Power Systems
- Kokam
- ESS Inc.
- EnerSys
Additional Benefits:
- The market estimate (ME) sheet in Excel format
- 3 months of analyst support
TABLE OF CONTENTS
1 Introduction
- 1.1 Study Assumptions & Market Definition
- 1.2 Scope of the Study
2 Research Methodology
3 Executive Summary
4 Market Landscape
- 4.1 Market Overview
- 4.2 Market Drivers
- 4.2.1 Li-ion cost curve approaching sub-$90/kWh
- 4.2.2 Global renewable mandates & corporate RE100 targets
- 4.2.3 Stand-alone storage ITC (US) & equivalent global incentives
- 4.2.4 Rising global C&I peak-demand charges
- 4.2.5 Hyperscale data-centre grid-deferral demand
- 4.2.6 Surge in synthetic PPAs needing dispatchable load-shifting
- 4.3 Market Restraints
- 4.3.1 High CAPEX vs diesel gensets
- 4.3.2 Critical-mineral supply-chain volatility
- 4.3.3 Fragmented interconnection & permitting rules
- 4.3.4 Urban fire-code compliance costs for indoor BESS
- 4.4 Supply-Chain Analysis
- 4.5 Regulatory Landscape
- 4.6 Technological Outlook
- 4.6.1 Advances in Battery Chemistries
- 4.6.2 Role of AI & IoT in EMS/DERMS
- 4.6.3 Second-life Battery Applications
- 4.6.4 Emerging Hybrid & Long-Duration Systems
- 4.7 Porters Five Forces Analysis
- 4.7.1 Supplier Power
- 4.7.2 Buyer Power
- 4.7.3 Threat of Substitutes
- 4.7.4 Threat of New Entrants
- 4.7.5 Competitive Rivalry
- 4.8 Pricing Analysis
- 4.9 Impact of Macroeconomic & Geopolitical Factors
- 4.9.1 Supply-chain disruptions
- 4.9.2 Tariff & trade-policy shifts
- 4.9.3 Investment & interest-rate trends
5 Market Size & Growth Forecasts
- 5.1 By Technology
- 5.1.1 Lithium-ion (LFP, NMC/NCA, LCO)
- 5.1.2 Sodium-ion
- 5.1.3 Lead-acid (VRLA, Flooded)
- 5.1.4 Flow Batteries (Vanadium-Redox, Zinc-Bromine)
- 5.1.5 Hybrid Super-capacitor Systems
- 5.1.6 Other Emerging Chemistries (Solid-state, Metal-air)
- 5.2 By Application
- 5.2.1 Peak Shaving
- 5.2.2 Load Shifting
- 5.2.3 Backup Power/UPS
- 5.2.4 Renewable Integration
- 5.2.5 Ancillary Services (Frequency Regulation)
- 5.2.6 Demand-charge Management
- 5.2.7 EV Fast-charging Support
- 5.2.8 Microgrid Stabilisation
- 5.3 By End-user
- 5.3.1 Commercial Buildings (Retail, Offices)
- 5.3.2 Industrial Facilities (Manufacturing, Warehousing)
- 5.3.3 Data Centres
- 5.3.4 Educational Institutions
- 5.3.5 Healthcare Facilities
- 5.3.6 Telecom BTS and Edge Sites
- 5.3.7 EV-fleet Operators and Charging Hubs
- 5.3.8 Public Infrastructure (Airports, Rail)
- 5.4 By Geography
- 5.4.1 North America
- 5.4.1.1 United States
- 5.4.1.2 Canada
- 5.4.1.3 Mexico
- 5.4.2 Europe
- 5.4.2.1 United Kingdom
- 5.4.2.2 Germany
- 5.4.2.3 France
- 5.4.2.4 Spain
- 5.4.2.5 Nordic Countries
- 5.4.2.6 Russia
- 5.4.2.7 Rest of Europe
- 5.4.3 Asia-Pacific
- 5.4.3.1 China
- 5.4.3.2 India
- 5.4.3.3 Japan
- 5.4.3.4 South Korea
- 5.4.3.5 ASEAN Countries
- 5.4.3.6 Australia and New Zealand
- 5.4.3.7 Rest of Asia-Pacific
- 5.4.4 South America
- 5.4.4.1 Brazil
- 5.4.4.2 Argentina
- 5.4.4.3 Colombia
- 5.4.4.4 Rest of South America
- 5.4.5 Middle East and Africa
- 5.4.5.1 United Arab Emirates
- 5.4.5.2 Saudi Arabia
- 5.4.5.3 South Africa
- 5.4.5.4 Egypt
- 5.4.5.5 Rest of Middle East and Africa
- 5.4.1 North America
6 Competitive Landscape
- 6.1 Market Concentration
- 6.2 Strategic Moves (M&A, Partnerships, PPAs)
- 6.3 Market Share Analysis (Market Rank/Share for key companies)
- 6.4 Company Profiles (includes Global level Overview, Market level overview, Core Segments, Financials as available, Strategic Information, Products & Services, and Recent Developments)
- 6.4.1 Tesla Inc.
- 6.4.2 Fluence Energy
- 6.4.3 LG Energy Solution
- 6.4.4 BYD Co. Ltd.
- 6.4.5 CATL
- 6.4.6 Panasonic Holdings Corp.
- 6.4.7 Saft (TotalEnergies)
- 6.4.8 Samsung SDI
- 6.4.9 Sungrow Power Supply
- 6.4.10 Powin Energy
- 6.4.11 Wartsila
- 6.4.12 Eos Energy Enterprises
- 6.4.13 ABB
- 6.4.14 Schneider Electric
- 6.4.15 Eaton
- 6.4.16 Enphase Energy
- 6.4.17 Hitachi Energy
- 6.4.18 Generac Power Systems
- 6.4.19 Kokam
- 6.4.20 ESS Inc.
- 6.4.21 EnerSys
7 Market Opportunities & Future Outlook
- 7.1 White-space & unmet-need assessment
 2026年全球儲能市場報告
 高容量電池市場-全球產業規模、佔有率、趨勢、機會、預測:按類型、應用、最終用戶、地區和競爭格局分類,2021-2031年
 氨能源儲存系統市場預測至2034年-按儲能類型、技術、應用、最終用戶和地區分類的全球分析
 儲能市場:依技術、時長、配置和最終用戶分類-2026-2032年全球市場預測可再生能源儲存市場預測至2034年-全球分析(按儲存技術、再生能源來源整合、系統類型、容量、所有權、連接方式、組件、應用、最終用戶和地區分類)
 2026-2030年全球人工智慧資料中心可再生能源儲存市場
 併網電池市場:按電池類型、最終用戶和地區分類
 全球儲能市場規模、佔有率、趨勢和成長分析報告(2026-2034年)氨基儲能市場預測:至2034年-按儲能類型、技術、應用、最終用戶和地區分類的全球分析雷射核融合中子源市場:按雷射類型、能量範圍、應用和終端用戶產業分類-全球預測,2026-2032年