


 |
市場調查報告書
商品編碼
2073585
線上配對服務:市場佔有率分析、產業趨勢與統計、成長預測(2026-2031)Online Dating Services - Market Share Analysis, Industry Trends & Statistics, Growth Forecasts (2026 - 2031) |
||||||

※ 本網頁內容可能與最新版本有所差異。詳細情況請與我們聯繫。
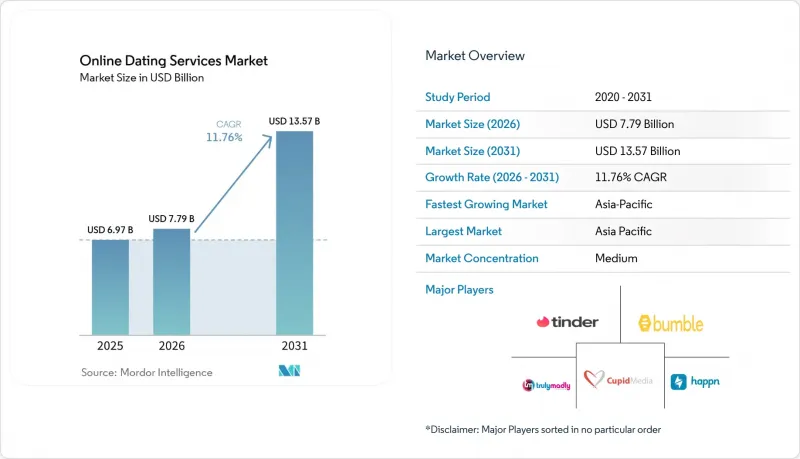
根據 Mordor Intelligence 預測,線上交友服務市場規模將從 2025 年的 69.7 億美元成長到 2026 年的 77.9 億美元,然後在 2031 年達到 135.7 億美元,2026 年至 2031 年的複合年成長率為 11.76%。
本報告按類型(付費線上約會、免費線上約會)、收入模式(訂閱、廣告、其他模式)、平台(入口網站、應用程式)、年齡層(成年人、嬰兒潮世代等)和地區進行細分。市場預測以美元(USD)計價。
全球線上交友服務市場趨勢與洞察
Z世代和千禧世代越來越願意為高階配對功能收費。
加值服務的日益普及反映出使用者行為從隨意瀏覽轉向有意識地建立關係。 Match Group報告稱,2024年每位付費用戶的收入成長了17%,其中美洲地區的增幅高達26%,這表明儘管付費用戶總數有所下降,但用戶支出卻有所增加。隨著用戶選擇單獨付費購買推廣和個人資料分析等功能,而非選擇固定費用套餐,微交易正在加速發展,催生了針對不同預算規模的分級費率方案。高消費用戶的留存率也更高,這有助於平台的現金流。這種轉變有助於抵消在用戶飽和的城市中不斷上漲的用戶獲取成本。
北美和歐洲對基於身分的小眾平台的接受度日益提高
小眾應用程式吸引的用戶更注重社群親和性而非大規模的用戶群。 Grindr在2025年第一季實現了25%的營收成長,每月有效用戶(MAU)達到1,450萬,凸顯了專注於特定細分市場的商業模式的有效性。專注於宗教或生活方式的服務由於用戶參與度更高、解約率更低,因此能夠透過更高的用戶平均收入(ARPU)實現獲利。為了因應這種成功,主流應用程式也被迫添加社群篩選功能和客製化演算法來留住用戶。
GDPR和加州CPRA法規下隱私權保護成本不斷增加。
Grindr因違反資料共用規定在挪威被罰款570萬歐元(約620萬美元)。義大利資料保護機構也因其人工智慧伴侶服務對Luka Inc.處以500萬歐元(約540萬美元)的罰款。如今,合規需要專門的法律團隊、資料映射系統和第三方審計,這提高了新進入者的門檻,並擠壓了中小企業的利潤空間。
細分市場分析
預計到2025年,付費服務將佔線上約會服務市場的69.45%,並將以12.61%的複合年成長率持續成長至2031年。隨著用戶開始將費用與安全性和演算法品質聯繫起來,付費線上約會服務的市場規模正在擴大。免費套餐起到「漏斗」的作用,一旦透過初步配對建立起信任,用戶就會升級到付費套餐,以尋求已讀回執、高級篩選和驗證徽章等功能。每個平台都在努力平衡提升銷售策略和用戶滿意度,以避免因過度收費引發用戶不滿。
在新興市場,由於用戶可支配收入較低,免費服務仍發揮著至關重要的作用,但智慧型手機普及率的不斷提高增加了用戶轉向付費服務的可能性。廣告收入是免費服務營運的部分資金來源,但針對廣告導向的隱私法規正在對每位使用者平均收入(ARPU)造成壓力。因此,雙層付費模式和免費增值模式仍然佔據主導地位,透過分級功能限制來最佳化用戶終身價值,同時又不降低新用戶獲取速度。
至2025年,訂閱模式將佔線上交友服務市場的54.35%。然而,微交易正以14.58%的複合年成長率成長,顯示用戶正逐漸轉向按需付費模式。虛擬禮物、個人資料突出顯示功能和限時展示通行證等功能鼓勵用戶在活躍度最高時進行衝動消費。用戶認為只在需要時付費更公平,這有助於緩解訂閱疲勞。
亞洲平台正在引領建構精細化虛擬經濟的潮流。 Grindr 透過推出週訂閱服務來滿足預算敏感型用戶的需求,展現了精細化定價的實驗性嘗試。雖然廣告仍然是第二大支柱,但隨著 cookie 和同意法規的逐步淘汰,直接支付收入來源的策略價值日益凸顯,因為精準度受到限制。
區域分析
預計到2025年,亞太地區將佔據線上約會服務市場34.85%的佔有率,年複合成長率達13.12%。中國2.4億單身人士正在推動「影片優先」平台的發展,這些平台融合了直播約會和社交電商,並創造了訂閱之外的多元化收入來源。東京投資128萬美元開發一款由人工智慧驅動的行政管理應用程式,凸顯了政府的大力支持。在印度,受二線城市滲透率提升的推動,預計2024年營收將達3.98億美元,2025年將達到7.83億美元。諸如家長控制面板等在地化功能正在迎合當地文化規範,並擴大其吸引力。
在北美,儘管擴張速度放緩,但各公司仍保持著較高的每用戶平均收入 (ARPU) 和成熟的品牌形象。 Match Group 在美洲地區的每位使用者收入成長了 26%,這表明價格仍有調整空間。由於《加州消費者隱私權法案》(CCPR) 的影響,規模經濟導致合規負擔加重和固定成本上升。為了防止使用者倦怠,各公司正積極參與線下聚會和心理健康合作項目,以維持使用者參與。
在歐洲,GDPR的嚴格監管下,市場正維持著均衡成長。 Grindr被處以570萬歐元的罰款,開創了先例,促使企業積極投資於用戶許可管理工具。雖然北歐國家的人均使用量最高,但隨著人們對約會軟體的偏見逐漸消退,南歐市場正在迎頭趕上。英國脫歐使服務於英國和歐盟的營運商的跨境資料流動變得更加複雜,迫使他們應對資料居住要求,從而增加了基礎設施成本。在文化較保守的地區,強調身分或人際關係的應用程式越來越受歡迎,加劇了市場競爭。
其他好處:
- Excel格式的市場預測(ME)表
- 3個月的分析師支持
目錄
第1章:引言
- 研究假設和市場定義
- 調查範圍
第2章:調查方法
第3章執行摘要
第4章 市場狀況
- 市場概覽
- 市場促進因素
- Z世代和千禧世代為高級婚戀交友功能付費的意願正在激增。
- 北美和歐洲對小眾和基於認同的平台(例如宗教、LGBTQ+)的接受度不斷提高
- 人工智慧驅動的個人化正在提高亞洲地區的匹配成功率。
- 與中國和東南亞的社交電商和直播產業的融合
- 利用 5G 技術的「影片優先」約會模式正在推動用戶參與。
- 市場限制因素
- GDPR和加州CPRA等隱私法規的成本不斷攀升。
- 飽和城區用戶疲勞度增加,應用卸載率上升。
- 因支付詐騙和小額交易扣回爭議帳款造成的損失
- 中東和非洲對自由交換規範的文化抵制
- 價值鏈分析
- 監管趨勢(強制性資料保護和年齡驗證)
- 技術展望(利用生成式人工智慧進行匹配,AR/VR約會)
- 波特五力分析
- 市場宏觀經濟趨勢的評估
第5章 市場規模與成長預測
- 按類型
- 付費線上約會
- 免費線上約會
- 按收入模式
- 訂閱
- 廣告收入
- 其他型號
- 按平台
- 網路入口網站
- 應用
- 按年齡層
- 成人
- 嬰兒潮世代
- X世代
- Z世代
- 千禧世代
- 地區
- 北美洲
- 美國
- 加拿大
- 墨西哥
- 歐洲
- 德國
- 英國
- 法國
- 北歐的
- 其他歐洲國家
- 亞太地區
- 中國
- 印度
- 日本
- 其他亞太國家
- 南美洲
- 巴西
- 阿根廷
- 其他南美國家
- 中東
- 阿拉伯聯合大公國
- 沙烏地阿拉伯
- 其他中東國家
- 非洲
- 南非
- 奈及利亞
- 其他非洲國家
- 北美洲
第6章 競爭情勢
- 市場集中度
- 策略性舉措(併購、資金籌措、合作)
- 市佔率分析
- 公司簡介
- Match Group, Inc.
- Bumble Inc.
- Grindr LLC
- The Meet Group, Inc.
- Spark Networks SE
- Coffee Meets Bagel, Inc.
- Happn SAS
- Hello Group Ltd.
- Zhenai Holding Ltd.
- TrulyMadly Matchmakers Pvt Ltd.
- ParshipMeet Holding GmbH
- Cupid Media Pty Ltd.
- Love Group Global Ltd.
- HER(Bloomer Inc.)
- Feeld Ltd.
- HAPPIER Pte Ltd.
- Once Dating Group
- Blued(BlueCity Holdings Ltd.)
- Shaadi.com(People Interactive Pvt Ltd.)
- Tawkify, Inc.
第7章 市場機會與未來展望
According to Mordor Intelligence, the online dating services market size is expected to grow from USD 6.97 billion in 2025 to USD 7.79 billion in 2026 and is forecast to reach USD 13.57 billion by 2031 at 11.76% CAGR over 2026-2031.
This report is Segmented by Type (Paying Online Dating, Non-Paying Online Dating), Revenue Model (Subscription, Advertising-Supported, Other Model), Platform (Web Portals, Applications), Age Group (Adult, Baby Boomer and More), and Geography. The Market Forecasts are Provided in Terms of Value (USD).
Global Online Dating Services Market Trends and Insights
Surge in Gen-Z and Millennial willingness to pay for premium matchmaking features
Premium adoption reflects a move from casual browsing toward intentional relationship building. Match Group reported a 17% rise in revenue per payer in 2024, with a 26% jump in the Americas, showing higher spending even as overall payers declined. Micro-transactions accelerate as users opt to pay for boosts or profile insights instead of fixed plans, creating tiered offers that meet different wallet sizes. Higher spending users also demonstrate longer retention, sustaining platform cash flows. This shift helps offset user-acquisition costs that continue to rise in saturated cities.
Growing acceptance of niche & identity-based platforms in North America & Europe
Niche applications attract users who value community alignment over large pools. Grindr's 25% Q1 2025 revenue jump and 14.5 million MAUs validate the viability of focused segments. Faith-based or lifestyle-specific services monetize via higher ARPU, stemming from deeper engagement and lower churn. Success forces major apps to add community filters and tailored algorithms to retain users.
Escalating privacy-regulation costs under GDPR & California CPRA
Grindr incurred a EUR 5.7 million fine (USD 6.2 million) in Norway for data-sharing infractions. Italy's data authority penalized Luka Inc. EUR 5 million (USD 5.4 million) for its AI companion service. Compliance now demands dedicated legal teams, data-mapping systems, and third-party audits, raising barriers for new entrants and squeezing margins for smaller players.
Other drivers and restraints analyzed in the detailed report include:
- AI-led personalization improving match success rates in Asia
- Integrations with social-commerce & live-streaming in China and SEA
- Rising user fatigue & app-deletion rates in saturated urban clusters
For complete list of drivers and restraints, kindly check the Table Of Contents.
Segment Analysis
Paying services controlled 69.45% of the online dating services market in 2025 and will compound at 12.61% through 2031. The online dating services market size for paying tiers increases as users equate fees with safety and algorithm quality. Free tiers act as funnels; once initial matches spark confidence, users migrate to paid plans for read-receipt visibility, advanced filters, and verification badges. Platforms balance upsell tactics with user satisfaction to avoid backlash from aggressive paywalls.
Non-paying services retain relevance in emerging economies where disposable incomes lag, yet conversion potential rises alongside smartphone penetration. Advertiser support partially funds free offerings, but privacy curbs on ad targeting pressure ARPU. Consequently, dual-tier or freemium models remain dominant, with iterative feature gating calibrated to optimize lifetime value without stalling onboarding velocity.
Subscriptions captured 54.35% share of the online dating services market size in 2025. However, micro-transactions growing at 14.58% CAGR signal a pivot toward a-la-carte spending. Virtual gifts, profile boosts, and timed visibility passes encourage spontaneous purchases during peak engagement moments. Users perceive fairness in paying only when they need an edge, mitigating subscription fatigue.
Asian platforms set precedents with detailed virtual economies. Grindr introduced weekly subscriptions to match budget-sensitive segments, illustrating granular price-point experimentation. Advertising remains a secondary pillar, but cookie deprecation and consent rules limit precision, giving direct-payment streams higher strategic value.
Complete Report Scope:
- By Type
- Paying Online Dating
- Non-Paying Online Dating
- By Revenue Model
- Subscription
- Advertising-Supported
- Other Model
- By Platform
- Web Portals
- Applications
- By Age Group
- Adult
- Baby Boomer
- Generation X
- Generation Z
- Millennials
- Geography
- North America
- United States
- Canada
- Mexico
- Europe
- Germany
- United Kingdom
- France
- Nordics
- Rest of Europe
- Asia-Pacific
- China
- India
- Japan
- Rest of Asia-Pacific
- South America
- Brazil
- Argentina
- Rest of South America
- Middle East
- United Arab Emirates
- Saudi Arabia
- Rest of Middle East
- Africa
- South Africa
- Nigeria
- Rest of Africa
- North America
Geography Analysis
Asia-Pacific commanded 34.85% of the online dating services market in 2025 and is projected to grow at a 13.12% CAGR. China's 240 million singles fuel video-first platforms where livestream dating merges with social-commerce, yielding diversified revenues beyond subscriptions. Tokyo's investment of USD 1.28 million in an AI-driven government app underscores institutional support. India generated USD 398 million in 2024 revenue with expectations of USD 783 million by 2025, boosted by tier-2 city adoption. Localized features such as parental dashboards meet cultural norms, widening appeal.
North America retains high ARPU and established brands despite slower expansion. Match Group raised revenue per payer by 26% in the Americas, demonstrating pricing headroom. The California Consumer Privacy Rights Act adds compliance layers that increase fixed costs, incentivizing scale economies. User fatigue prompts firms to organize real-world mixers and mental-health partnerships to sustain engagement.
Europe experiences balanced growth amid stringent GDPR oversight. A EUR 5.7 million fine on Grindr set a precedent that prompts preemptive investment in consent management tools. Northern Europe posts the highest per-capita usage, while Southern markets catch up as dating app stigma eases. Brexit complicates cross-border data flows for operators serving the UK and EU, forcing data-residency solutions that raise infrastructure expenses. Identity-based and relationship-focused apps gain traction in culturally conservative pockets, broadening the competitive field.
- Match Group, Inc.
- Bumble Inc.
- Grindr LLC
- The Meet Group, Inc.
- Spark Networks SE
- Coffee Meets Bagel, Inc.
- Happn SAS
- Hello Group Ltd.
- Zhenai Holding Ltd.
- TrulyMadly Matchmakers Pvt Ltd.
- ParshipMeet Holding GmbH
- Cupid Media Pty Ltd.
- Love Group Global Ltd.
- HER (Bloomer Inc.)
- Feeld Ltd.
- HAPPIER Pte Ltd.
- Once Dating Group
- Blued (BlueCity Holdings Ltd.)
- Shaadi.com (People Interactive Pvt Ltd.)
- Tawkify, Inc.
Additional Benefits:
- The market estimate (ME) sheet in Excel format
- 3 months of analyst support
TABLE OF CONTENTS
1 INTRODUCTION
- 1.1 Study Assumptions and Market Definition
- 1.2 Scope of the Study
2 RESEARCH METHODOLOGY
3 EXECUTIVE SUMMARY
4 MARKET LANDSCAPE
- 4.1 Market Overview
- 4.2 Market Drivers
- 4.2.1 Surge in Gen-Z and Millennial Willingness to Pay for Premium Matchmaking Features
- 4.2.2 Growing Acceptance of Niche & Identity-Based Platforms (e.g., Faith-based, LGBTQ+) in North America & Europe
- 4.2.3 AI-Led Personalization Improving Match Success Rates in Asia
- 4.2.4 Integrations with Social-Commerce & Live-Streaming in China and SEA
- 4.2.5 5G-Enabled Video-First Dating Formats Driving User-Time-Spent
- 4.3 Market Restraints
- 4.3.1 Escalating Privacy-Regulation Costs under GDPR & California CPRA
- 4.3.2 Rising User Fatigue & App-Deletion Rates in Saturated Urban Clusters
- 4.3.3 Payment-Fraud & Charge-back Losses on Micro-Transactions
- 4.3.4 Cultural Push-back in MEA on Liberal Dating Norms
- 4.4 Value-Chain Analysis
- 4.5 Regulatory Outlook (Data-Protection & Age-Verification Mandates)
- 4.6 Technological Outlook (Generative-AI Matchmaking, AR/VR Dates)
- 4.7 Porter's Five Forces Analysis
- 4.7.1 Bargaining Power of Suppliers
- 4.7.2 Bargaining Power of Buyers/Consumers
- 4.7.3 Threat of New Entrants
- 4.7.4 Threat of Substitute Products
- 4.7.5 Intensity of Competitive Rivalry
- 4.8 Assessment of Macro Economic Trends on the Market
5 MARKET SIZE AND GROWTH FORECASTS (VALUES)
- 5.1 By Type
- 5.1.1 Paying Online Dating
- 5.1.2 Non-Paying Online Dating
- 5.2 By Revenue Model
- 5.2.1 Subscription
- 5.2.2 Advertising-Supported
- 5.2.3 Other Model
- 5.3 By Platform
- 5.3.1 Web Portals
- 5.3.2 Applications
- 5.4 By Age Group
- 5.4.1 Adult
- 5.4.2 Baby Boomer
- 5.4.3 Generation X
- 5.4.4 Generation Z
- 5.4.5 Millennials
- 5.5 Geography
- 5.5.1 North America
- 5.5.1.1 United States
- 5.5.1.2 Canada
- 5.5.1.3 Mexico
- 5.5.2 Europe
- 5.5.2.1 Germany
- 5.5.2.2 United Kingdom
- 5.5.2.3 France
- 5.5.2.4 Nordics
- 5.5.2.5 Rest of Europe
- 5.5.3 Asia-Pacific
- 5.5.3.1 China
- 5.5.3.2 India
- 5.5.3.3 Japan
- 5.5.3.4 Rest of Asia-Pacific
- 5.5.4 South America
- 5.5.4.1 Brazil
- 5.5.4.2 Argentina
- 5.5.4.3 Rest of South America
- 5.5.5 Middle East
- 5.5.5.1 United Arab Emirates
- 5.5.5.2 Saudi Arabia
- 5.5.5.3 Rest of Middle East
- 5.5.6 Africa
- 5.5.6.1 South Africa
- 5.5.6.2 Nigeria
- 5.5.6.3 Rest of Africa
- 5.5.1 North America
6 COMPETITIVE LANDSCAPE
- 6.1 Market Concentration
- 6.2 Strategic Moves (M&A, Funding, Partnerships)
- 6.3 Market Share Analysis
- 6.4 Company Profiles {(includes Global level Overview, Market level overview, Core Segments, Financials as available, Strategic Information, Market Rank/Share for key companies, Products & Services, and Recent Developments)}
- 6.4.1 Match Group, Inc.
- 6.4.2 Bumble Inc.
- 6.4.3 Grindr LLC
- 6.4.4 The Meet Group, Inc.
- 6.4.5 Spark Networks SE
- 6.4.6 Coffee Meets Bagel, Inc.
- 6.4.7 Happn SAS
- 6.4.8 Hello Group Ltd.
- 6.4.9 Zhenai Holding Ltd.
- 6.4.10 TrulyMadly Matchmakers Pvt Ltd.
- 6.4.11 ParshipMeet Holding GmbH
- 6.4.12 Cupid Media Pty Ltd.
- 6.4.13 Love Group Global Ltd.
- 6.4.14 HER (Bloomer Inc.)
- 6.4.15 Feeld Ltd.
- 6.4.16 HAPPIER Pte Ltd.
- 6.4.17 Once Dating Group
- 6.4.18 Blued (BlueCity Holdings Ltd.)
- 6.4.19 Shaadi.com (People Interactive Pvt Ltd.)
- 6.4.20 Tawkify, Inc.
7 MARKET OPPORTUNITIES AND FUTURE OUTLOOK
- 7.1 White-space and Unmet-Need Assessment

 歐洲線上約會服務:市場佔有率分析、產業趨勢與統計及成長預測(2026-2031 年)北美線上約會服務:市場佔有率分析、產業趨勢與統計及成長預測(2026-2031 年)
 線上約會市場:2026-2032年全球市場預測(按平台、服務類型、收入模式、年齡層和最終用戶分類)線上約會服務市場:2026-2032年全球市場預測(按服務類型、平台類型、收入模式、使用者群體和應用程式分類)線上約會服務市場:按服務、配對技術、收費模式、婚姻狀況、年齡層和平台分類-2026-2032年全球市場預測
 2026-2030年全球線上約會服務市場
 2026年全球線上約會與婚介市場報告
 線上約會應用程式市場分析及預測(至2035年):按類型、產品類型、服務、技術、組件、應用、設備、部署類型、最終用戶和解決方案分類線上約會服務市場分析及預測(至2035年):按類型、產品類型、服務、技術、組件、應用、設備、最終用戶分類
 全球線上約會應用市場規模、佔有率、趨勢和成長分析報告(2026-2034)