


 |
市場調查報告書
商品編碼
2073579
亞太地區LED照明:市佔率分析、產業趨勢與統計及成長預測(2026-2031年)Asia Pacific LED Lighting - Market Share Analysis, Industry Trends & Statistics, Growth Forecasts (2026 - 2031) |
||||||

※ 本網頁內容可能與最新版本有所差異。詳細情況請與我們聯繫。
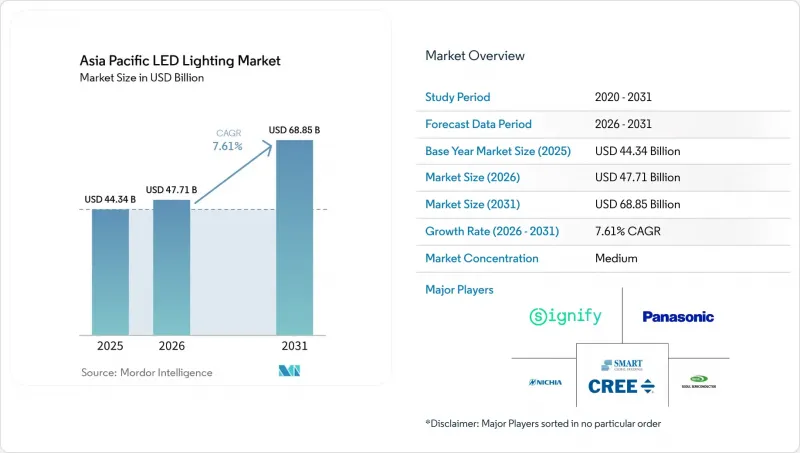
據 Mordor Intelligence 稱,亞太地區 LED 照明市場預計到 2026 年價值 477.1 億美元,高於 2025 年的 443.4 億美元,預計到 2031 年將達到 688.5 億美元。
預計 2026 年至 2031 年的複合年成長率為 7.61%。
本報告按產品類型(燈具、照明設備)、分銷管道(直銷、批發/零售等)、安裝類型(新安裝、維修安裝)、應用領域(商業辦公室、零售商店等)、最終用戶(室內、室外等)和國家/地區(英國等)進行細分。市場預測以美元計價。
亞太地區LED照明市場趨勢及洞察。
政府推出的節能政策和補貼計畫正在推動市場加速發展。
全部區域逐步淘汰螢光、修訂建築規範以及推出補貼計劃,持續快速推動LED照明的需求成長。在日本,2027年螢光生產禁令已促使磐田市啟動一項3000萬日圓(約20萬美元)的地方補貼計劃,旨在每年減少126.8萬千瓦時的電力消耗。越南能源部將LED照明視為實現該國碳中和目標的捷徑,並透過明確採購前景,支持製造商投資建造本地組裝線。同時,印度也推出了與LED照明生產相關的獎勵,從而降低了零件成本,縮短了供應鏈,並提高了國內自給自足能力。總而言之,及時的政策支援正透過縮短投資回收期,加速亞太市場對LED照明的採用。
快速的都市化和基礎設施正在重塑需求模式。
隨著每年數百萬新城市居民湧入該地區,地方政府面臨在鐵路樞紐、機場和主要道路安裝節能照明設備的壓力。在胡志明市新山一國際機場3號航站樓,一座佔地11.25萬平方公尺的設施配備了以生物為中心的LED照明系統,可滿足每年2000萬旅客的需求。在中國,包括超過1.6萬輛電動公車在內的車輛電氣化進程,正將充電基礎設施與LED路燈結合,以確保夜間安全並控制能源消耗。這正促使新建設項目拋棄傳統技術,進而推動亞太地區LED照明市場的領先訂單成長。
先進照明設備和控制系統的高昂初始成本限制了其推廣應用的速度。
網路化照明設備的成本可能是傳統產品的兩到四倍,這阻礙了中小企業的採用。世界銀行一項關於城市主導照明規劃的研究發現,如果沒有補貼,路燈照明可能占到小規模市政當局總預算的20%。即使在越南的出口導向工業園區,昕諾飛的智慧維修也需要四到五年才能收回投資。雖然諸如節能服務公司(ESCO)合約之類的資金籌措機制可以降低門檻,但許多本地用戶仍然缺乏對合約的深入理解,這阻礙了亞太地區LED照明市場的短期成長。
細分市場分析
預計到2025年,亞太地區LED照明市場中,燈具銷售額將佔62.05%。這主要歸因於燈具平均售價較高以及對整合要求更為嚴格。燈具佔據主導地位的原因在於商業項目對綜合能源管理的需求,在這些項目中,實施綜合系統往往比更換組件更為優先。而燈具市場則不然,其市佔率較小,主要得益於住宅的更換需求以及二次升級,預計到2031年,燈具市場的複合年成長率將達到9.35%。
燈具市場的成長得益於標準化降低了轉換成本,而日本即將禁止使用螢光也推動了對即插即用型LED燈管的需求。隨著安裝量的增加,銷售模式正逐漸從新燈具安裝轉向燈具更換,從而重塑了亞太地區LED照明市場的整體銷售結構。
到2025年,批發和零售將佔亞太地區LED照明市場銷售額的53.88%,這主要得益於與大型專案承包商建立的良好關係和信貸額度。然而,電子商務正以7.86%的複合年成長率快速成長,其透明的價格和送貨上門服務為中小企業和住宅提供了許多優勢。
為了彌補傳統服務的不足,數位化公司正在整合產品配置器和售後服務網路。在預測期內,通用SKU可能會擴大轉移到線上銷售,導致批發商將重心轉向設計安裝服務和資金籌措。雖然這可能會導致批發商的市佔率逐漸下降,但亞太地區LED照明市場的價值密度預計將保持穩定。
其他好處:
- Excel格式的市場預測(ME)表
- 3個月的分析師支持
目錄
第1章:引言
- 研究假設和市場定義
- 調查範圍
第2章:調查方法
第3章執行摘要
第4章 市場狀況
- 市場概覽
- 市場促進因素
- 政府關於能源效率的強制性規定和補貼計劃
- 快速的都市化和基礎設施建設的擴張
- LED價格下降和效率提高
- 智慧照明和連網照明的普及率正在迅速提高。
- 第二波對第一代LED的更換需求
- 以人性化、符合晝夜節律的照明的需求日益成長。
- 市場限制因素
- 先進的固定裝置和控制系統初始成本較高
- 激烈的競爭給利潤率帶來了壓力。
- 售後服務/改裝服務網分散
- 積體電路供應鏈波動與關稅風險
- 產業價值鏈分析
- 宏觀經濟因素的影響
- 監理情勢
- 技術展望
- 波特五力分析
第5章 市場規模與成長預測
- 依產品類型
- 燈
- 照明燈具/燈具
- 透過分銷管道
- 直銷
- 批發和零售
- 電子商務
- 按安裝類型
- 新推出
- 維修工程
- 透過使用
- 商業辦公
- 零售店
- 飯店業
- 產業
- 高速公路和普通公路
- 大樓
- 公共場所
- 醫院
- 園藝和花園
- 住宅
- 車
- 其他(化工、石油天然氣、農業)
- 最終用戶
- 室內的
- 戶外的
- 車
- 國家
- 中國
- 日本
- 印度
- 韓國
- 東南亞
- 其他亞太國家
第6章 競爭情勢
- 市場集中度
- 策略趨勢
- 市佔率分析
- 公司簡介
- Signify NV
- Nichia Corporation
- Seoul Semiconductor Co., Ltd.
- Everlight Electronics Co., Ltd.
- Opple Lighting Co., Ltd.
- Foshan Electrical and Lighting Co., Ltd.
- Yankon Group Co., Ltd.
- MLS Co., Ltd.(Forest Lighting)
- Zhejiang NVC Lighting Technology Co., Ltd.
- Wipro Enterprises(P)Ltd.(Wipro Lighting)
- Havells India Ltd.
- Syska LED Lights Pvt Ltd.
- Panasonic Corporation(Lighting)
- Toshiba Lighting and Technology Corp.
- Sharp Corporation(LED)
- Honglitronic Co., Ltd.
- Lite-On Technology Corp.
- Cree LED(Smart Global Holdings)
- Lextar Electronics Corp.
- Stanley Electric Co., Ltd.
- Lumileds Holding BV
- Sanan Optoelectronics Co., Ltd.
- Nationstar Optoelectronics Co., Ltd.
- Leedarson Lighting Co., Ltd.
- Unilumin Group Co., Ltd.
第7章 市場機會與未來展望
According to Mordor Intelligence, asia pacific LED lighting market size in 2026 is estimated at USD 47.71 billion, growing from 2025 value of USD 44.34 billion with 2031 projections showing USD 68.85 billion, growing at 7.61% CAGR over 2026-2031.
This report is Segmented by Product Type (Lamps, and Luminaires/Fixtures), Distribution Channel (Direct Sales, Wholesale/Retail, and More), Installation Type (New Installation, and Retrofit Installation), Application (Commercial Offices, Retail Stores, and More), End User (Indoor, Outdoor, and More), and Country (United Kingdom, and More). The Market Forecasts are Provided in Terms of Value (USD).
Asia Pacific LED Lighting Market Trends and Insights
Government Energy-Efficiency Mandates and Subsidy Programs Drive Market Acceleration
Fluorescent lamp phase-outs, building code revisions, and subsidy pools across the Asia Pacific continue to turbo-charge demand. Japan's 2027 production ban on fluorescent lamps already triggered a local rebate program worth JPY 30 million (USD 0.2 million) in Iwata City, targeting a 1,268,000 kWh annual cut in power use. Vietnam's energy ministry positions LEDs as a fast-track pathway toward achieving national carbon-neutrality goals, providing procurement certainty that enables manufacturers to invest in local assembly lines. Complementary Indian LED lighting production-linked incentives lower component costs, shorten supply chains, and reinforce domestic self-reliance. Overall, well-timed policy support shortens payback cycles and accelerates the uptake of LED lighting in the Asia Pacific market.
Rapid Urbanization and Infrastructure Build-Out Reshape Demand Patterns
The region adds millions of new urban residents each year, pushing municipalities to integrate energy-saving luminaires into rail hubs, airports, and arterial roads. Ho Chi Minh City's Tan Sơn Nhất Terminal 3 installation spans 112,500 square meters and utilizes bio-centric LED standards to accommodate 20 million annual passengers. China's fleet electrification, which includes over 16,000 e-buses, couples charging infrastructure with LED streetlighting to manage nighttime safety and energy budgets. New-build projects, therefore, sidestep legacy technologies, bolstering forward orders for the Asia Pacific LED lighting market.
High Upfront Cost of Advanced Fixtures and Controls Limits Adoption Velocity
Network-ready luminaires can cost two to four times more than conventional alternatives, slowing uptake among small enterprises. A World Bank review of city-led lighting schemes indicates that streetlighting may absorb up to 20% of a smaller municipality's total budget when unsubsidized. Even in Vietnam's export-oriented industrial parks, Signify's smart retrofits require four to five years to break even. Financing mechanisms, such as ESCO contracts, ease barriers but require contractual sophistication that many local users still lack, restraining near-term expansion in the Asia Pacific LED lighting market.
Other drivers and restraints analyzed in the detailed report include:
- Declining LED Prices With Higher Efficacy Expand Market Accessibility
- Surge in Smart and Connected Lighting Adoption Creates Premium Segments
- Margin Squeeze From Intense Price Competition Pressures Industry Profitability
For complete list of drivers and restraints, kindly check the Table Of Contents.
Segment Analysis
Luminaires accounted for 62.05% of the revenue in 2025 within the Asia Pacific LED lighting market, owing to higher average selling prices and tighter integration requirements. Their dominance stems from the holistic energy management needs in commercial projects, where comprehensive systems often outweigh the need for component replacements. Lamps, despite a lower base, are projected to record a 9.35% CAGR to 2031, buoyed by residential replacements and secondary upgrades.
Lamp growth benefits from standardization that lowers switching costs, while Japan's impending fluorescent ban boosts demand for drop-in LED tubes. As the installed base widens, volume shifts progressively from new fixture installations to lamp replacements, reshaping the revenue mix across the Asia Pacific LED lighting market.
Wholesale retail contributed 53.88% of the turnover in 2025 within the Asia Pacific LED lighting market, supported by contractor relationships and credit facilities essential for bulk projects. However, e-commerce is advancing at an 7.86% CAGR, capitalizing on transparent pricing and doorstep delivery for small firms and homeowners.
Digital players now embed product configurators and after-sales networks to close historical service gaps. Over the forecast horizon, commodity SKUs may increasingly migrate online, leaving wholesalers to focus on design-build services and financing, which should gradually dilute their share but sustain value density in the Asia Pacific LED lighting market.
Complete Report Scope:
- By Product Type
- Lamps
- Luminaires/ Fixtures
- By Distribution Channel
- Direct Sales
- Wholesale Retail
- E-commerce
- By Installation Type
- New Installation
- Retrofit Installation
- By Application
- Commercial Offices
- Retail Stores
- Hospitality
- Industrial
- Highway and Roadway
- Architectural
- Public Places
- Hospitals
- Horticulture Gardens
- Residential
- Automotive
- Others(Chemicals, Oil and gas, agriculture)
- By End User
- Indoor
- Outdoor
- Automotive
- By Country
- China
- Japan
- India
- South Korea
- Southeast Asia
- Rest of Asia-Pacific
List of Companies Covered in this Report:
- Signify N.V.
- Nichia Corporation
- Seoul Semiconductor Co., Ltd.
- Everlight Electronics Co., Ltd.
- Opple Lighting Co., Ltd.
- Foshan Electrical and Lighting Co., Ltd.
- Yankon Group Co., Ltd.
- MLS Co., Ltd. (Forest Lighting)
- Zhejiang NVC Lighting Technology Co., Ltd.
- Wipro Enterprises (P) Ltd. (Wipro Lighting)
- Havells India Ltd.
- Syska LED Lights Pvt Ltd.
- Panasonic Corporation (Lighting)
- Toshiba Lighting and Technology Corp.
- Sharp Corporation (LED)
- Honglitronic Co., Ltd.
- Lite-On Technology Corp.
- Cree LED (Smart Global Holdings)
- Lextar Electronics Corp.
- Stanley Electric Co., Ltd.
- Lumileds Holding B.V.
- Sanan Optoelectronics Co., Ltd.
- Nationstar Optoelectronics Co., Ltd.
- Leedarson Lighting Co., Ltd.
- Unilumin Group Co., Ltd.
Additional Benefits:
- The market estimate (ME) sheet in Excel format
- 3 months of analyst support
TABLE OF CONTENTS
1 INTRODUCTION
- 1.1 Study Assumptions and Market Definition
- 1.2 Scope of the Study
2 RESEARCH METHODOLOGY
3 EXECUTIVE SUMMARY
4 MARKET LANDSCAPE
- 4.1 Market Overview
- 4.2 Market Drivers
- 4.2.1 Government energy-efficiency mandates and subsidy programs
- 4.2.2 Rapid urbanization and infrastructure build-out
- 4.2.3 Declining LED prices with higher efficacy
- 4.2.4 Surge in smart and connected lighting adoption
- 4.2.5 Secondary replacement wave of first-gen LEDs
- 4.2.6 Growing demand for human-centric/circadian lighting
- 4.3 Market Restraints
- 4.3.1 High upfront cost of advanced fixtures and controls
- 4.3.2 Margin squeeze from intense price competition
- 4.3.3 Fragmented after-sales/retrofit service networks
- 4.3.4 IC supply-chain volatility and tariff exposure
- 4.4 Industry Value Chain Analysis
- 4.5 Impact of Macroeconomic Factors
- 4.6 Regulatory Landscape
- 4.7 Technological Outlook
- 4.8 Porter's Five Forces Analysis
- 4.8.1 Threat of New Entrants
- 4.8.2 Bargaining Power of Suppliers
- 4.8.3 Bargaining Power of Buyers
- 4.8.4 Threat of Substitute Products
- 4.8.5 Intensity of Competitive Rivalry
5 MARKET SIZE AND GROWTH FORECASTS (VALUE)
- 5.1 By Product Type
- 5.1.1 Lamps
- 5.1.2 Luminaires/ Fixtures
- 5.2 By Distribution Channel
- 5.2.1 Direct Sales
- 5.2.2 Wholesale Retail
- 5.2.3 E-commerce
- 5.3 By Installation Type
- 5.3.1 New Installation
- 5.3.2 Retrofit Installation
- 5.4 By Application
- 5.4.1 Commercial Offices
- 5.4.2 Retail Stores
- 5.4.3 Hospitality
- 5.4.4 Industrial
- 5.4.5 Highway and Roadway
- 5.4.6 Architectural
- 5.4.7 Public Places
- 5.4.8 Hospitals
- 5.4.9 Horticulture Gardens
- 5.4.10 Residential
- 5.4.11 Automotive
- 5.4.12 Others(Chemicals, Oil and gas, agriculture)
- 5.5 By End User
- 5.5.1 Indoor
- 5.5.2 Outdoor
- 5.5.3 Automotive
- 5.6 By Country
- 5.6.1 China
- 5.6.2 Japan
- 5.6.3 India
- 5.6.4 South Korea
- 5.6.5 Southeast Asia
- 5.6.6 Rest of Asia-Pacific
6 COMPETITIVE LANDSCAPE
- 6.1 Market Concentration
- 6.2 Strategic Moves
- 6.3 Market Share Analysis
- 6.4 Company Profiles (includes Global level Overview, Market level overview, Core Segments, Financials as available, Strategic Information, Market Rank/Share for key companies, Products and Services, and Recent Developments)
- 6.4.1 Signify N.V.
- 6.4.2 Nichia Corporation
- 6.4.3 Seoul Semiconductor Co., Ltd.
- 6.4.4 Everlight Electronics Co., Ltd.
- 6.4.5 Opple Lighting Co., Ltd.
- 6.4.6 Foshan Electrical and Lighting Co., Ltd.
- 6.4.7 Yankon Group Co., Ltd.
- 6.4.8 MLS Co., Ltd. (Forest Lighting)
- 6.4.9 Zhejiang NVC Lighting Technology Co., Ltd.
- 6.4.10 Wipro Enterprises (P) Ltd. (Wipro Lighting)
- 6.4.11 Havells India Ltd.
- 6.4.12 Syska LED Lights Pvt Ltd.
- 6.4.13 Panasonic Corporation (Lighting)
- 6.4.14 Toshiba Lighting and Technology Corp.
- 6.4.15 Sharp Corporation (LED)
- 6.4.16 Honglitronic Co., Ltd.
- 6.4.17 Lite-On Technology Corp.
- 6.4.18 Cree LED (Smart Global Holdings)
- 6.4.19 Lextar Electronics Corp.
- 6.4.20 Stanley Electric Co., Ltd.
- 6.4.21 Lumileds Holding B.V.
- 6.4.22 Sanan Optoelectronics Co., Ltd.
- 6.4.23 Nationstar Optoelectronics Co., Ltd.
- 6.4.24 Leedarson Lighting Co., Ltd.
- 6.4.25 Unilumin Group Co., Ltd.
7 MARKET OPPORTUNITIES AND FUTURE OUTLOOK
- 7.1 White-space and Unmet-need Assessment

 2026年全球LED櫥櫃下照明市場報告
 LED照明市場-2026-2032年全球市場預測
 LED 照明和 OLED 照明:市場分析和製造趨勢
 印度LED照明:市場佔有率分析、產業趨勢與統計及成長預測(2026-2031年)
 LED霓虹燈市場規模、佔有率和成長分析:按產品類型、安裝類型、電壓類型、應用、顏色類型、分銷管道、最終用戶和地區分類-2026-2033年產業預測
 LED面板燈市場報告:按應用和地區分類(2026-2034)歐洲LED照明:市場佔有率分析、產業趨勢與統計及成長預測(2026-2031年)
 LED照明市場規模、佔有率和成長分析:按產品類型、安裝類型、流明、應用、銷售管道和地區分類-2026-2033年產業預測
 LED環形燈市場:商業機會、成長要素、產業趨勢分析及2026-2035年預測
 LED照明系統市場預測至2034年-按產品、通路、技術、應用、最終用戶和地區分類的全球分析