


 |
市場調查報告書
商品編碼
2073569
東南亞垃圾焚化發電:市場佔有率分析、產業趨勢與統計及成長預測(2026-2031 年)Southeast Asia Waste-to-Energy - Market Share Analysis, Industry Trends & Statistics, Growth Forecasts (2026 - 2031) |
||||||

※ 本網頁內容可能與最新版本有所差異。詳細情況請與我們聯繫。
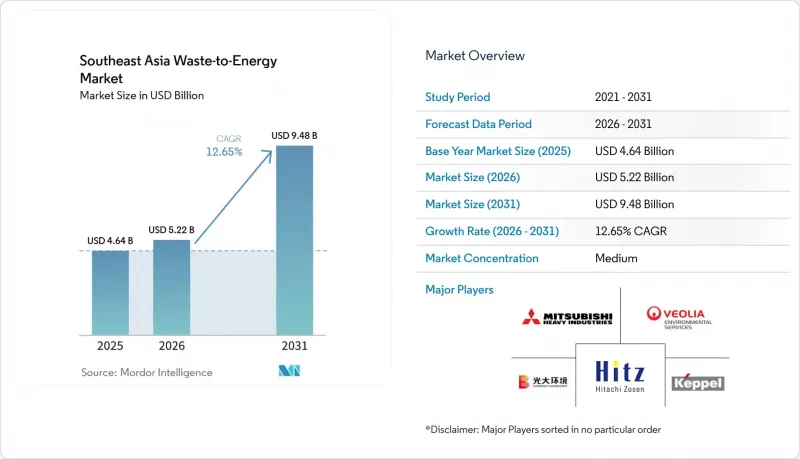
根據 Mordor Intelligence 預測,東南亞垃圾焚化發電市場規模將從 2025 年的 46.4 億美元成長到 2026 年的 52.2 億美元,到 2031 年達到 94.8 億美元,2026 年至 2031 年的複合年成長率為 12.65%。
本報告按技術(物理、熱能、生物)、廢棄物類型(生活廢棄物、工業廢棄物等)、能源輸出(電力、熱能等)、最終用戶(公共產業/獨立發電企業、工業自用、區域供熱、燃料經銷商)和地區(印尼、馬來西亞、泰國、新加坡、越南、菲律賓及其他東南亞國家)進行細分。市場預測以美元計價。
東南亞垃圾焚化發電市場的趨勢與洞察
廢棄物產生量的成長超過了掩埋的處理能力。
2023年,印尼產生了5,663萬噸城市廢棄物,但僅有39%得到了妥善處理,顯示垃圾收集和處理系統仍遠落後於廢棄物產生量。核心問題不僅在於垃圾量的增加,還在於特大城市和二線都會區在垃圾收集、處理和最終處置能力方面日益擴大的差距。隨著廢棄物的成長不再僅僅集中在特大城市,一些小規模的都會區也逐漸發展到可以運作商業性處理設施的程度,這種差距變得越來越顯著。因此,在一些收集網路尚無法應對大規模集中式專案的地區,日處理能力為200至500噸的垃圾處理廠模式的可行性日益凸顯。這些在地化條件使得直接照搬海外引進的大型垃圾處理廠模式難以實現,必須對規模、物流和資金籌措進行相應調整。因此,東南亞的垃圾焚化發電市場正從局限於大都會圈的解決方案擴展到更廣泛的市政基礎設施領域。
政府獎勵和公私合作框架有助於資金籌措
印尼2025年第109號總統令以單一固定費率0.20美元/千瓦時取代了原有的「處理費」和「購電費」雙重收費結構,該費率基於30年購電契約,顯著提高了項目的資金籌措潛力。該法規也透過集中採購流程,減少了地方政府決策與專案實施之間的碎片化。在泰國,由亞洲開發銀行(亞銀)支持的166億泰銖(約5.215億美元)援助計劃,用於建設12座工業廢棄物發電廠,表明多邊支持能夠使此前資金籌措得以實現。這些政策措施至關重要,因為儘早確定費率、廢棄物准入和特許經營條件能夠加速私人資本的流入。此外,這些措施有利於專案營運商,使他們能夠從資金籌措直接過渡到設計和電廠營運階段,而無需依賴冗長的交易對象鏈。這正是東南亞垃圾焚化發電市場從零星試點計畫轉向規模更大、更可複製的計畫體系的最明顯原因之一。
高昂的初始資本投入全部區域計畫的資金籌措潛力帶來了壓力。
近期公佈的項目表明,該地區日處理量1000噸級的污水處理廠仍需數億美元的資本投資,這使得資金籌措成為新進者的一大障礙。馬來西亞的Sungai Udang污水處理廠根據為期34年的特許經營協議,擁有日處理能力1056噸、裝機容量22兆瓦的產能,項目總成本為6.6億馬幣(約合1.49億美元)。位於河內市朔山的第二期擴建計畫將新增日處理能力1,600噸,投資額達5.83兆越南盾(約2.39億美元)。雖然較長的特許經營期有助於明確收入前景,但如果資產運作期間利率未根據通貨膨脹進行調整,貸款方仍會保持謹慎。預處理系統、排放氣體控制和建造風險等因素,即使在污水處理廠穩定運作之前,也會推高進入門檻。這意味著在東南亞垃圾焚化發電市場,擁有更雄厚的財力基礎、對承包商擁有更大控制權以及獲得政府和多邊組織支持的贊助商仍然具有優勢。
細分市場分析
2025年,熱處理技術在東南亞垃圾焚化發電市場佔據62.1%的佔有率,並持續保持其在大規模城市廢棄物管理系統中的主導地位。這項優勢源自於爐排焚化爐與高容量城市廢棄物的兼容性,尤其是在專案經濟效益依賴持續廢棄物接收和可靠購電協議的地區。位於河內的朔山垃圾處理廠於2025年10月投入運作,當時已處理了該市70%的日常生活垃圾,充分展現了熱處理系統能夠高效處理大城市垃圾量的潛力。此外,熱處理廠還受益於更成熟的營運模式、豐富的承包商資源以及與公共產業和地方政府建立的清晰的商業性合作關係。
預計2026年至2031年間,生物處理技術將以14.3%的複合年成長率成長,成為東南亞垃圾焚化發電市場中成長最快的技術領域。該領域的成長主要得益於馬來西亞和印尼的棕櫚油廠廢水(POME)項目,這兩個國家的廢棄物流量集中,且甲烷回收具有商業性可行性。預計到2025年,馬來西亞和印尼的粗製棕櫚油產量將達到8,040萬噸,佔全球總產量的83%。這為厭氧消化和沼氣系統提供了大規模的殘餘物基礎。然而,截至2026年初,印尼只有不到10%的棕櫚油廠安裝了厭氧消化設施,這意味著儘管原料供應充足,但成長的基數仍然很低。雖然 RDF(資源衍生燃料)的生產和機械生物處理 (MBT) 等物理技術仍然支持混燒和資源回收,但在東南亞的垃圾焚化發電行業中,它們仍然不如熱處理和生物處理重要。
到2025年,都市固態廢棄物將佔東南亞垃圾焚化發電市場的56.4%,繼續在全部區域的專案開發中佔據核心地位。這一地位反映了城市廢棄物收集系統與政府支持的特許經營模式之間的直接聯繫。印尼的國家計畫在2029年每天接收3.3萬噸廢棄物,目標涵蓋34個城市和30個都會區,這進一步提升了都市固體廢棄物作為未來工廠主要處理原料的重要性。在泰國和越南,隨著工業園區和出口導向製造區的環境法規日益嚴格,工業廢棄物也日益受到重視。
預計2026年至2031年間,農業及相關產業的殘餘物將以13.8%的複合年成長率成長,成為東南亞垃圾焚化發電市場中成長最快的廢棄物來源。最大的商機在於棕櫚油產業,該產業大量富含甲烷的殘餘物仍未充分利用。 2025年10月,馬來西亞生物經濟公司與北極星生物公司簽署了一份合作備忘錄,計劃建造一個價值7億馬幣(約合1.58億美元)的生物壓縮天然氣(bio-CNG)設施網路,該網路包含20多個設施。這表明,人們對殘餘物的商業性化利用越來越感興趣。在菲律賓,分散式殘餘物轉換也在進行試點,位於拉古納省的「Biosfair」試點計畫預計每年可處理1,200噸有機廢棄物,並產生25萬千瓦時的電力。這些項目表明,在原料集中的地區,與混合一般廢棄物系統相比,基於殘渣的系統可以快速擴大規模,並且收集物流更簡單。
其他好處:
- Excel格式的市場預測(ME)表
- 3個月的分析師支持
目錄
第1章:引言
- 研究假設和市場定義
- 調查範圍
第2章:調查方法
第3章執行摘要
第4章 市場狀況
- 市場概覽
- 市場促進因素
- 快速發展的都市區所產生的廢棄物量不斷增加
- 可再生能源與永續性目標(淨零排放、RE100)
- 政府獎勵和透過公私合作模式促進資金籌措
- 掩埋處置費上漲和強制關閉
- 透過自願市場將碳權額貨幣化
- 市場限制因素
- 初始投資額高/投資回收期長
- 民眾反對戴奧辛和氮氧化物排放
- 原料種類繁多,熱值低,水分含量高。
- 供應鏈分析
- 監理情勢
- 技術展望
- 波特五力模型
第5章 市場規模與成長預測
- 透過技術
- 物理處理(廢棄物衍生燃料、機械處理和生物處理)
- 熱處理(焚燒/燃燒、氣化、熱解、等離子弧)
- 生物加工(厭氧消化、發酵)
- 依廢物類型
- 都市固態廢棄物
- 工業廢棄物
- 農業及農業相關工業殘渣
- 污水污泥
- 其他(商業、建築、危險)
- 按能量輸出
- 電力
- 熱
- 熱電聯產(CHP)
- 運輸燃料(生物合成天然氣、生物液化天然氣、乙醇)
- 最終用戶
- 公共產業及獨立電力生產商(IPP)
- 工業私營發電廠
- 區域供熱業務
- 運輸燃料經銷商
- 按地區
- 印尼
- 馬來西亞
- 泰國
- 新加坡
- 越南
- 菲律賓
- 東南亞其他地區
第6章 競爭情勢
- 市場集中度
- 策略趨勢
- 市佔率分析
- 公司簡介
- Mitsubishi Heavy Industries Ltd
- Hitachi Zosen Corp
- Keppel Infrastructure Holdings
- Sembcorp Industries
- Veolia Environment SA
- China Everbright Environment Group
- China Jinjiang Environment
- Jiangsu Tianying Group
- Covanta Energy
- Babcock & Wilcox Volund
- MVV Energie AG
- Martin GmbH
- DP CleanTech
- Ramboll Group
- PT Yokogawa Indonesia
- Gulf Energy Development
- Earth Tech Environment
- Wastech Exponential
- Suez SA
- WTE International
第7章 市場機會與未來展望
According to Mordor Intelligence, the southeast asia waste-to-Energy market size is expected to increase from USD 4.64 billion in 2025 to USD 5.22 billion in 2026 and reach USD 9.48 billion by 2031, growing at a CAGR of 12.65% over 2026-2031.
This report is Segmented by Technology (Physical, Thermal, Biological), Waste Type (MSW, Industrial, and More), Energy Output (Electricity, Heat and More), End-User (Utilities/IPPs, Industrial Captive, District Heating, Fuel Distributors), and Geography (Indonesia, Malaysia, Thailand, Singapore, Vietnam, Philippines, Rest of Southeast Asia). Market Forecasts are Provided in Terms of Value (USD).
Southeast Asia Waste-to-Energy Market Trends and Insights
Waste Generation Pressure Outpaces Landfill Absorption Capacity
Indonesia generated 56.63 million tonnes of municipal solid waste in 2023, and only 39% of that volume was properly managed, which shows how far collection and treatment systems still lag the waste stream itself. The core issue is not only the rise in waste volumes, but the widening gap between collection, treatment, and final disposal capacity across large cities and second-tier urban centers. That gap is becoming more important because waste growth is no longer concentrated only in megacities, and smaller urban clusters are now large enough to support commercial treatment assets. This is why plant formats in the 200 to 500 tpd range are becoming more viable in parts of the region where collection networks cannot yet support very large centralized projects. These local conditions make imported large-plant models less transferable without changes in scale, logistics, and financing. As a result, the Southeast Asia waste-to-energy market is expanding from a narrow metropolitan solution into a wider municipal infrastructure category.
Government Incentives and PPP Frameworks Unlocking Financing
Indonesia's Presidential Regulation No. 109 of 2025 replaced the earlier dual tipping-fee and power-purchase structure with a single fixed tariff of USD 0.20/kWh under a 30-year power purchase agreement, which materially changed project bankability. The regulation also moved procurement into a more centralized framework, which reduced fragmentation between municipal decision-making and project execution. In Thailand, an Asian Development Bank-backed THB 16.6 billion package, equal to USD 521.5 million, for 12 industrial waste-to-energy plants showed how multilateral backing can unlock projects that had previously faced financing constraints. These policy steps matter because private capital moves faster when tariffs, waste delivery, and concession terms are defined early. They also favor sponsors that can move from financing to engineering to plant operations without depending on a long chain of counterparties. This is one of the clearest reasons the Southeast Asia waste-to-energy market is moving from scattered pilots toward larger and more repeatable project pipelines.
High Upfront Capex Strains Project Bankability Across the Region
Recent project announcements show that 1,000 tpd class plants in the region still require capital commitments in the hundreds of millions of dollars, which keeps financing barriers high for new entrants. Malaysia's Sungai Udang facility carries a project cost of RM660 million, equal to USD 149 million, for 1,056 tpd and 22 MW under a 34-year concession. Hanoi's Phase 2 expansion at Soc Son adds 1,600 tpd and carries an investment of VND 5,830 billion, equal to USD 239 million. Long concession terms help revenue visibility, but lenders remain cautious when tariffs do not adjust for inflation over the operating life of the asset. Pretreatment systems, emissions controls, and construction risk raise the entry cost even before a plant reaches stable utilization. This means the Southeast Asia waste-to-energy market still favors sponsors with stronger balance sheets, better contractor control, and access to sovereign or multilateral support.
Other drivers and restraints analyzed in the detailed report include:
- Renewable Energy and Sustainability Targets Raising Mandatory WtE Throughput
- Landfill Closure Mandates Creating Captive Feedstock for New Plants
- Feedstock Variability Imposes Hidden Technology Adaptation Costs
For complete list of drivers and restraints, kindly check the Table Of Contents.
Segment Analysis
Thermal technology held 62.1% of the Southeast Asia waste-to-energy market share in 2025, which kept it as the dominant route for large urban treatment systems. That lead comes from the fit between grate-furnace incineration and high-throughput municipal waste, especially where project economics depend on continuous intake and firm power offtake. Hanoi's Soc Son facility was already processing 70% of the city's daily household waste when it was inaugurated in October 2025, which shows how well thermal systems can absorb large city waste streams. Thermal plants also benefit from more mature operating models, deeper contractor pools, and a clearer commercial interface with utilities and local authorities.
Biological technology is projected to expand at 14.3% CAGR from 2026 to 2031, making it the fastest-growing technology segment in the Southeast Asia waste-to-energy market. The segment is being driven mainly by palm oil mill effluent projects in Malaysia and Indonesia, where waste streams are concentrated and methane capture is commercially meaningful. Malaysia and Indonesia were expected to produce 80.4 million metric tonnes of crude palm oil in 2025, or 83% of global output, which supports a very large residue base for anaerobic digestion and biogas systems. Yet fewer than 10% of Indonesian palm oil mills had installed anaerobic digestion by early 2026, so growth is starting from a low installed base even though feedstock availability is high. Physical technologies such as refuse-derived fuel production and mechanical biological treatment still support co-firing and recovery pathways, but they remain secondary to thermal and biological routes in the Southeast Asia waste-to-energy industry.
Municipal solid waste accounted for 56.4% of the Southeast Asia waste-to-energy market size in 2025, which kept it at the center of project development across the region. This position reflects the direct link between city waste collection systems and government-backed concession models. Indonesia's national programme is targeting 34 cities and 30 agglomeration zones by 2029, with planned waste intake of 33,000 tpd, which reinforces municipal waste as the main volume base for future plants. Industrial waste is also gaining weight in Thailand and Vietnam as environmental compliance standards tighten in industrial parks and export manufacturing zones.
Agricultural and agro-industrial residues are projected to grow at 13.8% CAGR from 2026 to 2031, making them the fastest-growing waste stream in the Southeast Asia waste-to-energy market. The strongest opportunity sits in the palm oil economy, where large volumes of methane-rich residue remain underused. In October 2025, Malaysia's Bioeconomy Corporation signed an MOU with Polaris Bio for a RM700 million network, equal to USD 158 million, of more than 20 Bio-CNG facilities, which highlighted growing commercial interest in residue monetization. The Philippines is also testing decentralized residue conversion, and the Biosfair pilot in Laguna is set to process 1,200 tonnes of organic waste annually while generating 250,000 kWh per year. These projects show that residue-based systems can scale quickly where feedstock is concentrated, and collection logistics are simpler than in mixed municipal waste systems.
Complete Report Scope:
- By Technology
- Physical (Refuse-Derived Fuel, Mechanical Biological Treatment)
- Thermal (Incineration/Combustion, Gasification, Pyrolysis and Plasma-Arc)
- Biological (Anaerobic Digestion, Fermentation)
- By Waste Type
- Municipal Solid Waste
- Industrial Waste
- Agricultural and Agro-industrial Residues
- Sewage Sludge
- Others (Commercial, Construction, Hazardous)
- By Energy Output
- Electricity
- Heat
- Combined Heat and Power (CHP)
- Transportation Fuels (Bio-SNG, Bio-LNG, Ethanol)
- By End-user
- Utilities and IPPs
- Industrial Captive Plants
- District Heating Operators
- Transport Fuel Distributors
- By Geography
- Indonesia
- Malaysia
- Thailand
- Singapore
- Vietnam
- Philippines
- Rest of Southeast Asia
List of Companies Covered in this Report:
- Mitsubishi Heavy Industries Ltd
- Hitachi Zosen Corp
- Keppel Infrastructure Holdings
- Sembcorp Industries
- Veolia Environment SA
- China Everbright Environment Group
- China Jinjiang Environment
- Jiangsu Tianying Group
- Covanta Energy
- Babcock & Wilcox Volund
- MVV Energie AG
- Martin GmbH
- DP CleanTech
- Ramboll Group
- PT Yokogawa Indonesia
- Gulf Energy Development
- Earth Tech Environment
- Wastech Exponential
- Suez SA
- WTE International
Additional Benefits:
- The market estimate (ME) sheet in Excel format
- 3 months of analyst support
TABLE OF CONTENTS
1 Introduction
- 1.1 Study Assumptions & Market Definition
- 1.2 Scope of the Study
2 Research Methodology
3 Executive Summary
4 Market Landscape
- 4.1 Market Overview
- 4.2 Market Drivers
- 4.2.1 Increasing waste generation in fast-growing urban hubs
- 4.2.2 Renewable-energy & sustainability targets (net-zero, RE100)
- 4.2.3 Government incentives & PPP frameworks unlocking financing
- 4.2.4 Rising landfill-tipping fees and closure mandates
- 4.2.5 Carbon-credit monetisation via voluntary markets
- 4.3 Market Restraints
- 4.3.1 High upfront capex / long payback periods
- 4.3.2 Public opposition over dioxin & NOx emissions
- 4.3.3 Low-calorific, high-moisture feedstock variability
- 4.4 Supply-Chain Analysis
- 4.5 Regulatory Landscape
- 4.6 Technological Outlook
- 4.7 Porter's Five Forces
- 4.7.1 Bargaining Power of Suppliers
- 4.7.2 Bargaining Power of Consumers
- 4.7.3 Threat of New Entrants
- 4.7.4 Threat of Substitute Products & Services
- 4.7.5 Intensity of Competitive Rivalry
5 Market Size & Growth Forecasts
- 5.1 By Technology
- 5.1.1 Physical (Refuse-Derived Fuel, Mechanical Biological Treatment)
- 5.1.2 Thermal (Incineration/Combustion, Gasification, Pyrolysis and Plasma-Arc)
- 5.1.3 Biological (Anaerobic Digestion, Fermentation)
- 5.2 By Waste Type
- 5.2.1 Municipal Solid Waste
- 5.2.2 Industrial Waste
- 5.2.3 Agricultural and Agro-industrial Residues
- 5.2.4 Sewage Sludge
- 5.2.5 Others (Commercial, Construction, Hazardous)
- 5.3 By Energy Output
- 5.3.1 Electricity
- 5.3.2 Heat
- 5.3.3 Combined Heat and Power (CHP)
- 5.3.4 Transportation Fuels (Bio-SNG, Bio-LNG, Ethanol)
- 5.4 By End-user
- 5.4.1 Utilities and IPPs
- 5.4.2 Industrial Captive Plants
- 5.4.3 District Heating Operators
- 5.4.4 Transport Fuel Distributors
- 5.5 By Geography
- 5.5.1 Indonesia
- 5.5.2 Malaysia
- 5.5.3 Thailand
- 5.5.4 Singapore
- 5.5.5 Vietnam
- 5.5.6 Philippines
- 5.5.7 Rest of Southeast Asia
6 Competitive Landscape
- 6.1 Market Concentration
- 6.2 Strategic Moves
- 6.3 Market Share Analysis
- 6.4 Company Profiles {(includes Global level Overview, Market level overview, Core Segments, Financials as available, Strategic Information, Products & Services, and Recent Developments)}
- 6.4.1 Mitsubishi Heavy Industries Ltd
- 6.4.2 Hitachi Zosen Corp
- 6.4.3 Keppel Infrastructure Holdings
- 6.4.4 Sembcorp Industries
- 6.4.5 Veolia Environment SA
- 6.4.6 China Everbright Environment Group
- 6.4.7 China Jinjiang Environment
- 6.4.8 Jiangsu Tianying Group
- 6.4.9 Covanta Energy
- 6.4.10 Babcock & Wilcox Volund
- 6.4.11 MVV Energie AG
- 6.4.12 Martin GmbH
- 6.4.13 DP CleanTech
- 6.4.14 Ramboll Group
- 6.4.15 PT Yokogawa Indonesia
- 6.4.16 Gulf Energy Development
- 6.4.17 Earth Tech Environment
- 6.4.18 Wastech Exponential
- 6.4.19 Suez SA
- 6.4.20 WTE International
7 Market Opportunities & Future Outlook
- 7.1 White-space & Unmet-Need Assessment

 2034年垃圾焚化發電市場預測-全球分析(依技術、廢棄物類型、能源產量、工廠產能、原料來源、應用、最終用戶、所有權結構、設施類型和地區分類)
 垃圾焚化發電市場:2026-2032年全球市場預測(按技術、原料類型、工廠產能、能源產量、應用、最終用戶和所有權類型分類)
 全球垃圾焚化發電市場規模、佔有率、趨勢和成長分析報告(2026-2034年)生質能和垃圾焚化發電市場預測至2034年—按原料、技術、應用、最終用戶和地區分類的全球分析
 中國廢棄物發電:市佔率分析、產業趨勢與統計及成長預測(2026-2031年)
 垃圾焚化發電市場規模、佔有率和趨勢分析報告:按技術、地區和細分市場分類(2026-2033 年)
 廢棄物衍生燃料市場:依燃料類型、應用、最終用戶產業和地區分類。垃圾焚化發電(WTE):市場佔有率分析、產業趨勢與統計、成長預測(2026-2031 年)垃圾焚化發電市場:按設備類型和地區分類
 2026年全球垃圾掩埋沼氣氣化能源(LFGTE)系統市場報告