


 |
市場調查報告書
商品編碼
2066442
垃圾焚化發電(WTE):市場佔有率分析、產業趨勢與統計、成長預測(2026-2031 年)Waste To Energy (WTE) - Market Share Analysis, Industry Trends & Statistics, Growth Forecasts (2026 - 2031) |
||||||
※ 本網頁內容可能與最新版本有所差異。詳細情況請與我們聯繫。
根據 Mordor Intelligence 預測,垃圾焚化發電市場規模將從 2025 年的 454.2 億美元成長到 2026 年的 499.7 億美元,到 2031 年將達到 853.5 億美元,2026 年至 2031 年的複合年成長率為 11.30%。
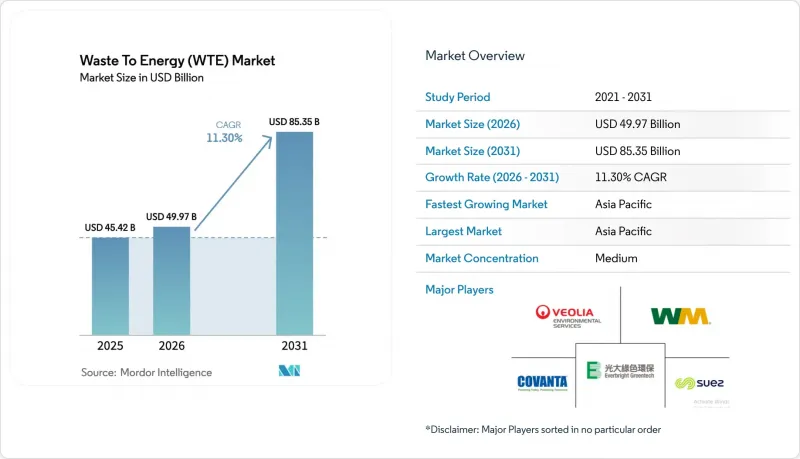
本報告按技術(物理、熱力、生物)、廢棄物類型(城市固態廢棄物、工業廢棄物等)、能源輸出(電力、熱等)、最終用戶(公共產業和獨立發電商 (IPP)、工業私人發電廠、區域供熱供應商、運輸燃料經銷商)和地區(北美、歐洲、亞太地區、南美、中東和非洲)進行分類。
全球垃圾焚化發電(WTE) 市場趨勢與洞察
中國粵港澳大灣區廢棄物焚化發電官民合作關係計畫快速發展
省級政府計劃在2024年至2027年間累計450億元人民幣,用於開發日處理量12萬噸的新垃圾處理能力,並提供25年收益保證,以降低私人資本的風險。爐底灰回收利用的收入使現金流量增加了8%至12%,而更嚴格的垃圾分類規定將低位熱值提高到2,400千卡/公斤,從而使每噸垃圾的淨發電量提高了22%。該模式正在向Delta和成渝經濟區推廣,預計到2025年將有14個特許經營項目完成融資。處理量的確定性和原料品質的保證,使償債損益平衡期從7年縮短至5年。國際貸款機構認可這種標準化的特許經營模式,認為其具有融資價值,從而能夠進行多幣種資金籌措,並擴大垃圾焚化發電市場的交易量。
歐盟綠色分類獎勵正在加速老舊焚化爐的維修。
根據2024/1214號授權條例,能源效率維修被重新歸類為永續投資,到2025年,47家工廠共獲得28億歐元的綠色債券融資。加權平均資本成本降低了120個基點,廢氣淨化和熱回收設備升級的投資回收期縮短至不到7年。 MVV Energie發行的3億歐元債券用於建造冷凝式節熱器,將熱效率提高到68%,從而為4.5萬戶家庭提供區域供熱。鼓勵在水泥窯中混燒廢棄物的獎勵每年減少了42萬噸煤炭需求,拓寬了廢棄物發電市場的價值創造途徑。
德國對戴奧辛排放的更嚴格規定導致爐排爐維修許可證的發放延遲。
德國一項於2024年7月生效的法令將戴奧辛排放基準值減半至0.05納克/立方米,並強制規定年處理能力為10萬噸的垃圾處理廠需進行800萬至1500萬歐元的維修。到2025年,23家垃圾處理廠的許可證續期被推遲,導致120萬噸的處理能力閒置,迫使垃圾以每噸35英鎊的價格出口到荷蘭。中型地方政府營運商推遲了維修,而威立雅等大型企業集團則接受了契約,並賺取了高額的廢棄物費。奧地利已表示計劃在2027年前實施這項更嚴格的限值,並已將原計劃的1.1億歐元資本投資提前,抑制了垃圾焚化發電市場的短期成長。
細分市場分析
到2025年,焚化將佔垃圾焚化發電市場的65.1%,這意味著其資本密集度較低,每噸日處理能力的資本投入僅為45萬至65萬美元。相較之下,儘管等離子弧氣化技術的資本投資超過每噸日85萬美元,但由於地方政府強調98%的減量率和適用於骨材的玻璃化爐渣,該技術仍在不斷發展。首爾的先導工廠已證明,透過避免掩埋,每噸可節省8.5萬韓元的成本,從而縮短了等離子設備維修的投資回收期。預計美國三家工廠對底灰等電漿炬的維修將使黑色金屬的回收率提高12%,並使每噸掩埋成本降低18美元。
在日本,氣化計畫正將都市固態廢棄物轉化為合成氣,發電效率高達32%,而爐排焚燒的效率僅22%。生物處理技術在有機物豐富的地區蓬勃發展,印度運作一座生物甲烷工廠,日產3,200噸壓縮天然氣(CNG)汽車燃料。英國一座機械生物處理(MBT)工廠預計到2025年將處理480萬噸廢棄物,使廢棄物衍生燃料出口的熱值提高14%。如今,技術選擇受到區域排放上限、排碳權帶來的盈利以及原料成分的影響,這些因素正在拓寬廢棄物發電(WTE)市場的整體技術選擇。
2025年,都市固態廢棄物佔垃圾焚化發電業投入物的70.2%,但預計到2031年,農業殘餘物將以14.4%的複合年成長率成長,這主要得益於巴西強制使用甘蔗渣生產沼氣,以及越南擴大稻殼造粒規模。工業廢棄物為垃圾焚化發電行業提供了穩定的處理量,尤其是來自電子和汽車工廠的廢棄物,這些工廠致力於實現塑膠和金屬的閉合迴路回收。在歐洲,修訂後的《都市污水處理指令》加速了垃圾焚化發電產業中污水污泥的消化處理,預計到2025年將新增112座消化池。
在荷蘭,建築和拆除廢棄物經過預處理,提取出高溫成分,供應給機械廢棄物處理(MBT)工廠;110萬噸可燃物已取代煤炭用於水泥窯。在中國,預計2025年,危險廢棄物處理能力將擴大到68萬噸,利用廢棄物和電子廢棄物發電420吉瓦時。原料物流仍是瓶頸。收集分散的農作物殘渣的成本為每噸25至40美元,限制了商業性活動的範圍,使其僅限於50公里半徑內,並導致高產農業區周邊的產業集中化,從而影響了垃圾焚化發電市場的空間分佈。
區域分析
到2025年,亞太地區將佔據45.1%的市場佔有率,成為垃圾焚化發電市場最大的區域板塊。隨著中國日處理能力80萬噸的目標和印度掩埋禁令的實施進入階段,預計到2031年,該地區將以13.0%的強勁複合年成長率成長。中國粵港澳大灣區的特許經營模式,擁有450億元人民幣的資金籌措和25年的原物料供應保障,降低了債務償還風險,並有可能推廣到東南亞國協。在東協,越南和泰國已簽署了11項特許經營協議,有效期至2025年。在印度,二線城市透過可行性缺口融資(VGF)新增了每日處理能力1.45萬噸,市政車輛也開始使用生物甲烷取代柴油燃料。日本批准了八個合成氣氣化項目,韓國每噸碳排放權額度為 28,000 韓元,這些都支持了政策正在提供順風的觀點。
歐洲垃圾焚化發電市場的發展動能取決於現有設施維修的經濟可行性。歐盟的綠色分類法促進了28億歐元綠色債券的發行,但德國收緊戴奧辛排放上限導致120萬噸處理能力閒置,限制了短期處理量。預計到2025年,北歐國家的企業沼氣購電協議總量將達到1.8太瓦時,將促進生物甲烷的投資。英國的合格垃圾衍生燃料(QP-RDF)熱值閾值規定,導致分揀設施升級改造費用高達7800萬英鎊,提高了出口燃料的質量,但同時也加劇了國內供應緊張。
在北美,產能擴張依賴美國的D3纖維素碳權額度,這使得專案的內部收益率(IRR)提高了12%至15%,從而促進了六座工廠的建設,總合年產量達到72萬噸。在加拿大,每噸80加元的碳價提高了垃圾焚化發電的競爭力,促使安大略省和不列顛哥倫比亞省開展了相關項目。拉丁美洲的進展主要集中在巴西的生物甲烷購買義務計劃上,這是該地區首個此類計劃,它保障了最低價格,並改善了原料合約。
中東和非洲是新興市場,但也是具有重要戰略意義的地區。沙迦的垃圾處理廠年處理能力達30萬噸,是該地區最大的垃圾處理廠;而在沙烏地阿拉伯,特許經營項目,正助力實現「2030願景」的廢棄物減量目標。在南非,三座城市垃圾處理廠已根據每千瓦時1.80蘭特的再生能源獨立電力生產定價投入運作。此外,埃及與歐洲復興開發銀行(EBRD)簽署的價值4.2億歐元的合作備忘錄,也顯示多邊組織對該地區日益成長的興趣。
其他好處:
- Excel格式的市場預測(ME)表
- 3個月的分析師支持
目錄
第1章:引言
- 研究假設和市場定義
- 調查範圍
第2章:調查方法
第3章執行摘要
第4章 市場狀況
- 市場概覽
- 市場促進因素
- 中國大灣區垃圾焚化發電官民合作關係(PPP)計畫快速發展
- 基於歐盟綠色分類法的獎勵正在加速老舊焚化爐的維修。
- 印度全國禁止對未分類掩埋處置,這促使印度二線城市的都市固態廢棄物處理方式發生轉變。
- 碳權價格飆升正在提高韓國垃圾焚化發電專案的內部收益率。
- 北歐國家基於循環經濟的生物燃氣公司間購電協議(CPPA)
- 英國脫歐後RDF出口的基本熱基準值
- 市場限制因素
- 由於德國對戴奧辛排放的規定更加嚴格,爐排爐維修許可證的發放被推遲了。
- 印尼廢棄物費的小幅上漲可能會削弱該專案的資金籌措潛力。
- 在巴西,厭氧消化原料價格的波動給利潤率帶來了壓力。
- 澳洲郊區居民反對興建等離子弧設施
- 供應鏈分析
- 技術展望
- 監理展望
- 波特五力模型
- 投資分析
第5章 市場規模與成長預測
- 透過技術
- 物理處理(廢棄物衍生燃料、機械處理和生物處理)
- 熱處理(焚燒/燃燒、氣化、熱解、等離子弧)
- 生物加工(厭氧消化、發酵)
- 廢棄物類型
- 都市固態廢棄物
- 工業廢棄物
- 農業及農業相關工業殘渣
- 污水污泥
- 其他(商業、建築、危險)
- 按能量輸出
- 電力
- 熱
- 熱電聯產(CHP)
- 運輸燃料(生物合成天然氣、生物液化天然氣、乙醇)
- 最終用戶
- 公共產業及獨立電力生產商(IPP)
- 工業私營發電廠
- 區域供熱業務
- 運輸燃料經銷商
- 按地區
- 北美洲
- 美國
- 加拿大
- 墨西哥
- 歐洲
- 英國
- 德國
- 法國
- 西班牙
- 北歐國家
- 俄羅斯
- 其他歐洲國家
- 亞太地區
- 中國
- 印度
- 日本
- 韓國
- 東南亞國協
- 其他亞太國家
- 南美洲
- 巴西
- 阿根廷
- 哥倫比亞
- 其他南美國家
- 中東和非洲
- 阿拉伯聯合大公國
- 沙烏地阿拉伯
- 南非
- 埃及
- 其他中東和非洲國家
- 北美洲
第6章 競爭情勢
- 市場集中度
- 策略趨勢(併購、聯盟、購電協議)
- 市場佔有率分析(主要公司的市場排名和佔有率)
- 公司簡介
- Veolia Environnement SA
- Suez SA
- Waste Management Inc.
- Covanta Holding Corp.
- Wheelabrator Technologies Inc.
- Mitsubishi Heavy Industries Ltd
- Hitachi Zosen Corp.
- Babcock & Wilcox Enterprises Inc.
- A2A SpA
- MVV Energie AG
- Martin GmbH fur Umwelt-und Energietechnik
- China Everbright Environment Group Ltd
- China Jinjiang Environment Holding Co.
- Xcel Energy Inc.
- Shenzhen Energy Group Co.
- Keppel Seghers
- Remondis SE & Co. KG
- FCC Servicios Medio Ambiente
- Enerkem Inc.
- Sembcorp Industries Ltd
- Green Conversion Systems LLC
- Fortum Oyj
第7章 市場機會與未來展望
According to Mordor Intelligence, the waste to energy market is expected to grow from USD 45.42 billion in 2025 to USD 49.97 billion in 2026 and is forecasted to reach USD 85.35 billion by 2031 at 11.30% CAGR over 2026-2031.
This report is Segmented by Technology (Physical, Thermal, and Biological), Waste Type (Municipal Solid Waste, Industrial Waste, and More), Energy Output (Electricity, Heat, and More), End-Users (Utilities and IPPs, Industrial Captive Plants, District Heating Operators, and Transport Fuel Distributors), and Geography (North America, Europe, Asia-Pacific, South America, and Middle East and Africa).
Global Waste To Energy (WTE) Market Trends and Insights
Rapid Roll-Out of EfW Public-Private Partnership Pipelines in China's Greater Bay Area
Provincial authorities earmarked CNY 45 billion between 2024 and 2027 to create 120,000 tonnes per day of new capacity backed by 25-year revenue guarantees that de-risk private capital. Bottom-ash recycling revenues add 8%-12% to cash flow, while stricter source-segregation rules have lifted lower-heating values to 2,400 kcal/kg, increasing net generation per tonne by 22%. The template is expanding to the Yangtze River Delta and Chengdu-Chongqing Economic Circle, where fourteen additional concessions reached financial close in 2025. Volume certainty and feedstock quality are shortening debt-service coverage break-evens from seven to five years. International lenders view the standardized concession model as bankable, unlocking multi-currency financing that amplifies the waste to energy market deal flow.
EU Green Taxonomy Incentives Accelerating Retrofit of Legacy Incineration Fleets
Delegated Regulation 2024/1214 re-tagged high-efficiency retrofits as sustainable investments, opening EUR 2.8 billion of green-bond proceeds for forty-seven plants in 2025. Weighted average costs of capital dropped 120 basis points, pushing payback on flue-gas cleaning and heat-recovery upgrades below seven years. MVV Energie's EUR 300 million bond financed a condensing economizer that elevates thermal efficiency to 68%, delivering district heat to 45,000 households. Co-firing incentives for refuse-derived fuel in cement kilns reduce coal demand by 420,000 tonnes annually, widening the waste to energy market valorization pathways.
Stricter Dioxin-Emission Caps Postponing Permits for Grate-Furnace Refurbishments in Germany
Germany's July 2024 ordinance halved the dioxin limit to 0.05 ng/m3, obliging EUR 8-15 million retrofits per 100,000 tpy plant. Twenty-three facilities had permit renewals deferred in 2025, idling 1.2 million tpy and forcing exports to the Netherlands at GBP 35 per tonne. Mid-sized municipal utilities deferred upgrades, while large integrated operators such as Veolia absorbed contracts, capturing premium tipping fees. Austria signaled adoption of the stricter cap by 2027, front-loading EUR 110 million of planned capital expenditure, and constraining near-term growth in the waste to energy market.
Other drivers and restraints analyzed in the detailed report include:
- National Bans on Unsegregated Landfill Triggering MSW Diversion in India's Tier-2 Cities
- Soaring Carbon-Credit Prices Improving WTE Project IRRs in South Korea
- Limited Tipping-Fee Escalation Clauses Hurting Project Bankability in Indonesia
For complete list of drivers and restraints, kindly check the Table Of Contents.
Segment Analysis
Incineration anchored 65.1% of the waste to energy market in 2025, reflecting the lower capital intensity of USD 450,000-650,000 per tonne-per-day capacity. In contrast, plasma-arc gasification, with capex north of USD 850,000 per tonne-per-day, is scaling because municipalities prize 98% volume reduction and vitrified slag suitable for aggregates. Seoul's pilot plant demonstrated KRW 85,000-per-tonne landfill-avoidance savings, quickening payback for plasma retrofits. Retrofitting bottom-ash plasma torches at three U.S. facilities will recover 12% more ferrous metals and cut landfill costs by USD 18/tonne.
Gasification projects in Japan convert municipal solid waste to syngas, hitting electrical efficiencies up to 32% against 22% for grate incineration. Biological routes thrive in organic-rich geographies; India commissioned 3,200 tpd biomethanation in 2025 for compressed natural gas fleets. Mechanical-biological treatment (MBT) plants in the United Kingdom processed 4.8 million tonnes in 2025, raising calorific value for refuse-derived fuel exports by 14%. Technology selection now hinges on local emission caps, carbon-credit upside, and feedstock composition, collectively widening the Waste to Energy (WTE) market's technology palette.
Municipal solid waste comprised 70.2% of input volumes in 2025 in the waste to energy industry, yet agricultural residues will post a 14.4% CAGR through 2031 as Brazil's sugar-bagasse biogas mandates and Vietnam's rice-husk pelletization gain scale. Industrial waste delivers steady volumes in the waste-to-energy sector, especially from electronics and automotive plants seeking closed-loop plastics and metal recovery. Sewage sludge digestion accelerated in the waste-to-energy industry in Europe after the revised Urban Wastewater Directive, adding 112 digesters in 2025.
Construction-and-demolition streams are pre-treated to extract high-calorific fractions for MBT plants in the Netherlands, where 1.1 million tonnes of combustible material replaced coal in cement kilns. Hazardous-waste capacity rose in China to 680,000 tonnes in 2025, generating 420 GWh of electricity from medical and electronic residues. Feedstock logistics remain a brake; dispersed crop-residue collection costs of USD 25-40/tonne confine commercial radii to 50 km, driving consolidation around high-yield farm belts and influencing the waste to energy market spatial clustering.
Geography Analysis
Asia-Pacific's 45.1% share in 2025 crowns it the largest regional block of the waste to energy market; the region is tracking a robust 13.0% CAGR to 2031 as China's 800,000 t-per-day capacity targets and India's landfill-ban deadlines reach execution. China's Greater Bay Area concession model, boasting CNY 45 billion funding and 25-year feedstock guarantees, lowered debt-service risk and may migrate to ASEAN, where Vietnam and Thailand closed eleven concessions in 2025. India's Tier-2 cities added 14,500 t-per-day via viability-gap funding, with biomethanation replacing diesel in municipal fleets. Japan's approval of eight syngas-gasification projects and South Korea's KRW 28,000-per-tonne carbon allowance underscore the policy-tailwind narrative.
Europe's waste to energy market momentum pivots on retrofit economics. The EU Green Taxonomy spurred EUR 2.8 billion in green-bond activity, yet Germany's tighter dioxin cap idled 1.2 million t-per-year, curbing near-term throughput. Nordic corporate biogas PPAs totaled 1.8 TWh in 2025, boosting biomethane investment. The United Kingdom's QP-RDF calorific-value floor imposed GBP 78 million in sorting upgrades, raising export fuel quality and tightening domestic supply.
North America's build-out depends on U.S. D3 cellulosic credits that lifted project IRRs 12-15%, catalyzing six plants totaling 720,000 tpy. Canada's CAD 80-per-tonne carbon price made waste-to-energy competitive, yielding projects in Ontario and British Columbia. Latin America's traction centers on Brazil's biomethane purchase mandate, the first of its kind in the region, guaranteeing floor prices that improve feedstock contracts.
The Middle East and Africa are emerging but strategic; the 300,000 t-per-year Sharjah plant is the region's largest, while Saudi Arabia's 2,400 t-per-day concessions underpin Vision 2030 waste-diversion targets. South Africa's tariff of ZAR 1.80/kWh under REIPPP unlocked three urban plants, and Egypt's EUR 420 million MoU with the EBRD signals growing multilateral appetite.
- Veolia Environnement SA
- Suez SA
- Waste Management Inc.
- Covanta Holding Corp.
- Wheelabrator Technologies Inc.
- Mitsubishi Heavy Industries Ltd
- Hitachi Zosen Corp.
- Babcock & Wilcox Enterprises Inc.
- A2A SpA
- MVV Energie AG
- Martin GmbH fur Umwelt- und Energietechnik
- China Everbright Environment Group Ltd
- China Jinjiang Environment Holding Co.
- Xcel Energy Inc.
- Shenzhen Energy Group Co.
- Keppel Seghers
- Remondis SE & Co. KG
- FCC Servicios Medio Ambiente
- Enerkem Inc.
- Sembcorp Industries Ltd
- Green Conversion Systems LLC
- Fortum Oyj
Additional Benefits:
- The market estimate (ME) sheet in Excel format
- 3 months of analyst support
TABLE OF CONTENTS
1 Introduction
- 1.1 Study Assumptions & Market Definition
- 1.2 Scope of the Study
2 Research Methodology
3 Executive Summary
4 Market Landscape
- 4.1 Market Overview
- 4.2 Market Drivers
- 4.2.1 Rapid roll-out of EfW public-private partnership pipelines in China's Greater Bay Area
- 4.2.2 EU Green Taxonomy incentives accelerating retrofit of legacy incineration fleets
- 4.2.3 National bans on unsegregated landfill triggering MSW diversion in India's Tier-2 cities
- 4.2.4 Soaring carbon credit prices improving WTE project IRRs in South Korea
- 4.2.5 Circular-economy led corporate power-purchase agreements (CPPAs) for biogas in Nordics
- 4.2.6 Mandatory calorific value thresholds for RDF exports in the UK post-Brexit
- 4.3 Market Restraints
- 4.3.1 Stricter dioxin emission caps postponing permits for grate-furnace refurbishments in Germany
- 4.3.2 Limited tipping-fee escalation clauses hurting project bankability in Indonesia
- 4.3.3 Anaerobic-digestion feedstock price volatility undermining margins in Brazil
- 4.3.4 Community push-back against plasma-arc facilities in Australia's peri-urban regions
- 4.4 Supply-Chain Analysis
- 4.5 Technological Outlook
- 4.6 Regulatory Outlook
- 4.7 Porter's Five Forces
- 4.7.1 Bargaining Power of Suppliers
- 4.7.2 Bargaining Power of Consumers
- 4.7.3 Threat of New Entrants
- 4.7.4 Threat of Substitutes
- 4.7.5 Intensity of Competitive Rivalry
- 4.8 Investment Analysis
5 Market Size & Growth Forecasts
- 5.1 By Technology
- 5.1.1 Physical (Refuse-Derived Fuel, Mechanical Biological Treatment)
- 5.1.2 Thermal (Incineration/Combustion, Gasification, Pyrolysis and Plasma-Arc)
- 5.1.3 Biological (Anaerobic Digestion, Fermentation)
- 5.2 By Waste Type
- 5.2.1 Municipal Solid Waste
- 5.2.2 Industrial Waste
- 5.2.3 Agricultural and Agro-industrial Residues
- 5.2.4 Sewage Sludge
- 5.2.5 Others (Commercial, Construction, Hazardous)
- 5.3 By Energy Output
- 5.3.1 Electricity
- 5.3.2 Heat
- 5.3.3 Combined Heat and Power (CHP)
- 5.3.4 Transportation Fuels (Bio-SNG, Bio-LNG, Ethanol)
- 5.4 By End-user
- 5.4.1 Utilities and Independent Power Producers (IPPs)
- 5.4.2 Industrial Captive Plants
- 5.4.3 District Heating Operators
- 5.4.4 Transport Fuel Distributors
- 5.5 By Geography
- 5.5.1 North America
- 5.5.1.1 United States
- 5.5.1.2 Canada
- 5.5.1.3 Mexico
- 5.5.2 Europe
- 5.5.2.1 United Kingdom
- 5.5.2.2 Germany
- 5.5.2.3 France
- 5.5.2.4 Spain
- 5.5.2.5 Nordic Countries
- 5.5.2.6 Russia
- 5.5.2.7 Rest of Europe
- 5.5.3 Asia-Pacific
- 5.5.3.1 China
- 5.5.3.2 India
- 5.5.3.3 Japan
- 5.5.3.4 South Korea
- 5.5.3.5 ASEAN Countries
- 5.5.3.6 Rest of Asia-Pacific
- 5.5.4 South America
- 5.5.4.1 Brazil
- 5.5.4.2 Argentina
- 5.5.4.3 Colombia
- 5.5.4.4 Rest of South America
- 5.5.5 Middle East and Africa
- 5.5.5.1 United Arab Emirates
- 5.5.5.2 Saudi Arabia
- 5.5.5.3 South Africa
- 5.5.5.4 Egypt
- 5.5.5.5 Rest of Middle East and Africa
- 5.5.1 North America
6 Competitive Landscape
- 6.1 Market Concentration
- 6.2 Strategic Moves (M&A, Partnerships, PPAs)
- 6.3 Market Share Analysis (Market Rank/Share for key companies)
- 6.4 Company Profiles (includes Global level Overview, Market level overview, Core Segments, Financials as available, Strategic Information, Products & Services, and Recent Developments)
- 6.4.1 Veolia Environnement SA
- 6.4.2 Suez SA
- 6.4.3 Waste Management Inc.
- 6.4.4 Covanta Holding Corp.
- 6.4.5 Wheelabrator Technologies Inc.
- 6.4.6 Mitsubishi Heavy Industries Ltd
- 6.4.7 Hitachi Zosen Corp.
- 6.4.8 Babcock & Wilcox Enterprises Inc.
- 6.4.9 A2A SpA
- 6.4.10 MVV Energie AG
- 6.4.11 Martin GmbH fur Umwelt- und Energietechnik
- 6.4.12 China Everbright Environment Group Ltd
- 6.4.13 China Jinjiang Environment Holding Co.
- 6.4.14 Xcel Energy Inc.
- 6.4.15 Shenzhen Energy Group Co.
- 6.4.16 Keppel Seghers
- 6.4.17 Remondis SE & Co. KG
- 6.4.18 FCC Servicios Medio Ambiente
- 6.4.19 Enerkem Inc.
- 6.4.20 Sembcorp Industries Ltd
- 6.4.21 Green Conversion Systems LLC
- 6.4.22 Fortum Oyj
7 Market Opportunities & Future Outlook
- 7.1 White-space & unmet-need assessment
 生質能和垃圾焚化發電市場預測至2034年—按原料、技術、應用、最終用戶和地區分類的全球分析
 垃圾焚化發電市場規模、佔有率和趨勢分析報告:按技術、地區和細分市場分類(2026-2033 年)
 垃圾焚化發電市場:2026-2032年全球市場預測(按技術、原料類型、工廠產能、發電量、應用、最終用戶和所有權類型分類)
 垃圾焚化發電市場:按設備類型和地區分類
 2026年全球垃圾掩埋沼氣氣化能源(LFGTE)系統市場報告2026年全球垃圾焚化發電(WtE)市場報告
 亞太地區廢棄物製氫(WtH)市場:按應用、技術、廢棄物類型和國家分類的分析和預測(2025-2035 年)
 歐洲廢棄物氫氣市場按應用、技術、垃圾類型和國家分類-分析與預測(2025-2035 年)
 垃圾焚化發電市場報告:按技術、廢棄物類型和地區分類(2026-2034 年)
 先進廢棄物能源化技術市場分析及預測(至2035年):按類型、產品類型、技術、組件、應用、最終用戶、製程、安裝類型、設備和解決方案分類