


 |
市場調查報告書
商品編碼
2073424
中國廢棄物發電:市佔率分析、產業趨勢與統計及成長預測(2026-2031年)China Waste To Energy (WTE) - Market Share Analysis, Industry Trends & Statistics, Growth Forecasts (2026 - 2031) |
||||||

※ 本網頁內容可能與最新版本有所差異。詳細情況請與我們聯繫。
根據 Mordor Intelligence 預測,中國垃圾焚化發電市場規模預計將從 2025 年的 97.2 億美元成長到 2026 年的 109.9 億美元,到 2031 年達到 197.9 億美元,2026 年至 2031 年的複合年成長率為 12.48%。
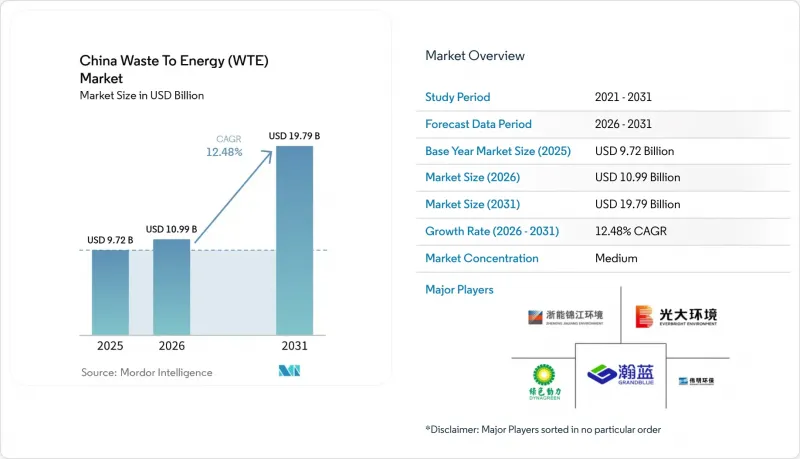
本報告按技術(物理、熱力、生物)、廢棄物類型(城市固態廢棄物、農業和農工廢棄物等)、能源輸出(電力、熱力、運輸燃料等)以及最終用戶(公共產業和獨立發電商 (IPP)、工業發電廠、運輸燃料經銷商等)進行細分。市場規模和預測以美元計價。
中國垃圾焚化發電(WTE)市場的趨勢與洞察
大型焚化爐維修以達到市電平價(超臨界)
超臨界鍋爐運作超過25兆帕,工作溫度超過攝氏580度C,可將淨熱效率提高到32-35%,使發電廠能夠以市場價格售電,而無需依賴上網電價補貼(FIT)。深圳能源的寶安三期專案於2025年運作,每噸廢棄物可發電550千瓦時,並已簽訂了一份為期15年的購電契約,其價格低於燃煤發電成本。國家能源局發布通知,鼓勵對180座日處理能力超過1200噸的垃圾處理廠維修,並由中國國家開發銀行提供16.7億美元的貸款支持。由於預計到2025年東部省份的現貨電價將下降12%,投資回收期已延長至11年,而維修的獲利能力取決於長期購電合約的簽訂。由於操作超臨界鍋爐的技術純熟勞工短缺,正在與三菱重工和日立造船等公司尋求技術轉移方面的合作。
全國「零廢棄城市」計畫(到2027年涵蓋113個城市)
該框架要求在2027年將垃圾掩埋量減少60%,以保障熱處理和生物處理項目的原料供應。到2025年,113個試點城市將處理全國48%的城市廢棄物,並撥款118.2億美元用於廢棄物基礎建設,其中40%將用於厭氧消化項目。光是成都市就已累計4.4512億美元興建四個厭氧消化池,每年可生產1.8億立方公尺沼氣,用於公車和區域供熱。符合城市總體規劃的專案現在可以在14個月內獲得環境許可,而先前需要24個月,這使得前期建設資金籌措成本降低了約20%。
對戴奧辛和呋喃類排放設定更嚴格的限制(GB 18485-2025)
新標準將戴奧辛的允許排放限值減半至0.05 ng TEQ/m³,並強制要求持續監測。為符合新標準,每家工廠需投入348萬至556萬美元用於活性碳注入和安裝即時分析設備,預計營業利潤率將下降至多6個百分點。約320家2016年以前建造的工廠被迫在維修或關閉之間做出選擇。浙江維明環境等先行企業正利用其符合新規的優勢,爭取為期20年的特許經營協議,並約定使用費與通貨膨脹掛鉤。
細分市場分析
到2025年,在中國垃圾焚化發電市場,熱處理將佔77.1%的市場佔有率,這得益於基於GB 18485標準的成熟處理流程以及對混合垃圾流的高接受度。生物處理正以17.8%的複合年成長率快速發展,因為它能夠從沼氣中獲得排碳權和可再生氣體證書。同時,由於焦油處理問題和高資本投入,氣化和熱解仍處於小眾領域,處理能力佔不到2%。
厭氧消化正受惠於中國核排放減排量(CCER)機制的重啟。該機制預計到2025年將以每噸二氧化碳當量支付平均13.21美元,使專案收益成長高達18%。國家能源局的目標是到2030年將厭氧消化能力提高三倍,並供應300億立方公尺沼氣。雖然這一趨勢預計將逐漸削弱熱處理的優勢,但焚燒仍能夠處理含水量高達60%的原料和未分類的物料,這是厭氧消化和RDF(固態燃料)生產線所不具備的優勢。
2025年,都市固態廢棄物佔處理廢棄物總量的74.8%,而農業和農業殘餘物在強制使用秸稈的政策下,以15.6%的複合年成長率成長,該政策的目標是到2028年實現60%的秸稈回收率。工業固態廢棄物佔原料的12%,污水污泥佔5%。
秸稈回收計畫仍面臨季節性和儲存成本的挑戰,但由於每噸6.96至11.13美元的回收補貼和靈活的上網電價補貼政策,其經濟效益正在提升。污泥聯合焚燒產生的處理費用是普通廢棄物的兩倍,有助於都市區企業彌補因回收而損失的處理能力。這些趨勢正在擴大中國垃圾焚化發電市場的資源基礎,同時也與鄉村振興政策相契合。
其他好處:
- Excel格式的市場預測(ME)表
- 3個月的分析師支持
目錄
第1章:引言
- 研究假設和市場定義
- 調查範圍
第2章:調查方法
第3章執行摘要
第4章 市場狀況
- 市場概覽
- 市場促進因素
- 主流政策主導的登機費和上網電價補貼
- 在全國推廣「零廢棄城市」(到2027年達到113個城市)
- 將一座達到市電平價(超臨界)的大型焚化爐維修
- 對被忽視的高價值塑膠進行分類將提高其低熱值(LHV)。
- 利用人工智慧最佳化熱電汽電共生電力供應區域供熱
- 各州對水泥窯RDF混合的要求
- 市場限制因素
- 公眾反對聲浪日益高漲,以及社會可接受的成本。
- 對戴奧辛和呋喃類排放設定更嚴格的限制(GB 18485-2025)
- 一線城市原料短缺,通常是由於未公開的回收做法造成的。
- 碳權價格的波動正在降低公私合營計畫的內部報酬率。
- 供應鏈分析
- 監理情勢
- 技術展望
- 波特五力模型
- PESTLE分析
第5章 市場規模與成長預測
- 透過技術
- 物理處理(廢棄物衍生燃料、機械處理和生物處理)
- 熱處理(焚燒/燃燒、氣化、熱解、等離子弧)
- 生物加工(厭氧消化、發酵)
- 廢棄物類型
- 都市固態廢棄物
- 工業廢棄物
- 農業及農業相關工業殘渣
- 污水污泥
- 其他(商業、建築、危險)
- 按能量輸出
- 電力
- 熱
- 熱電聯產(CHP)
- 運輸燃料(生物合成天然氣、生物液化天然氣、乙醇)
- 最終用戶
- 公共產業及獨立發電商(IPP)
- 工業私營發電廠
- 區域供熱業務
- 運輸燃料經銷商
第6章 競爭情勢
- 市場集中度
- 策略趨勢(併購、聯盟、購電協議)
- 市場佔有率分析(主要公司的市場排名和市場佔有率)
- 公司簡介
- China Everbright Environment Group Ltd
- Zheneng Jinjiang Environment Holding Co Ltd
- Zhejiang Weiming Environment Protection Co Ltd
- Grandblue Environment Co Ltd
- Dynagreen Environmental Protection Group Co Ltd
- China Tianying Inc
- Beijing Capital Eco-Environment Protection Group
- Beijing Enterprises Environment Group Ltd
- Shanghai Environment Group
- Sanfeng Environment Co Ltd
- Veolia Environnement SA(China Ops)
- Hitachi Zosen Inova AG
- Mitsubishi Heavy Industries Environmental & Chemical Eng.
- Babcock & Wilcox Enterprises Inc
- Covanta Holding Corporation
- Suez SA(China Ops)
- Keppel Seghers
- Dongjiang Environmental Co Ltd
- Tianjin Teda Environmental Protection Co Ltd
- Jiangsu Huahong Technology Co Ltd
- StockViz
第7章 市場機會與未來展望
According to Mordor Intelligence, the china waste to energy market size is expected to increase from USD 9.72 billion in 2025 to USD 10.99 billion in 2026 and reach USD 19.79 billion by 2031, growing at a CAGR of 12.48% over 2026-2031.
This report is Segmented by Technology (Physical, Thermal, and Biological), Waste Type (Municipal Solid Waste, Agricultural and Agro-Industrial Residues, and More), Energy Output (Electricity, Heat, Transportation Fuels, and More), and End-User (Utilities and IPPs, Industrial Captive Plants, Transport Fuel Distributors, and More). The Market Sizes and Forecasts are Provided in Terms of Value (USD).
China Waste To Energy (WTE) Market Trends and Insights
Grid-Parity Large-Scale Incinerator Retrofits (Ultra-Supercritical)
Ultra-supercritical boilers operating above 25 megapascals and 580 °C raise net thermal efficiency to 32-35%, allowing plants to sell power at market rates without feed-in tariffs. Shenzhen Energy's Baoan Phase III plant, commissioned in 2025, produces 550 kWh per tonne of waste and won a 15-year power purchase agreement that undercuts coal dispatch costs. A National Energy Administration circular encourages retrofitting 180 plants above 1,200 t/d, backed by USD 1.67 billion in China Development Bank loans. Retrofit economics depend on long-term offtake contracts because spot power prices in eastern provinces dipped 12% in 2025, stretching payback periods to 11 years. Skilled labor shortages in ultra-supercritical boiler operation have prompted partnerships with Mitsubishi Heavy Industries and Hitachi Zosen for technology transfer.
National Zero-Waste City Roll-Out (113 Cities by 2027)
The framework mandates 60% landfill diversion by 2027, guaranteeing baseline feedstock for thermal and biological projects. The 113 pilot cities handled 48% of national urban waste in 2025 and allocated USD 11.82 billion to waste infrastructure, 40% of which funds anaerobic digestion. Chengdu alone budgeted USD 445.12 million for four digesters that will yield 180 million m3 of biogas annually for buses and district heating. Projects aligned with municipal master plans secure environmental permits in 14 months versus 24 months previously, trimming pre-construction financing costs by about 20%.
Stricter Dioxin/Furan Emission Caps (GB 18485-2025)
The new standard halves allowable dioxin emissions to 0.05 ng TEQ/m3 and mandates continuous monitoring. Compliance needs USD 3.48-5.56 million per plant for activated-carbon injection and real-time analyzers, slicing operating margins by up to 6 percentage points. Roughly 320 plants built before 2016 face retrofit or closure. Early movers such as Zhejiang Weiming Environment leverage compliance readiness to win 20-year concessions with inflation-indexed gate fees.
Other drivers and restraints analyzed in the detailed report include:
- AI-Optimised Dispatch of CHP Exports to District Heating
- Provincial RDF Blending Mandates for Cement Kilns
- Recycling-Led Feedstock Shortfalls in Tier-1 Cities
For complete list of drivers and restraints, kindly check the Table Of Contents.
Segment Analysis
Thermal schemes controlled 77.1% of the Chinese waste-to-energy market in 2025, supported by proven GB 18485 pathways and high tolerance of mixed waste streams. Biological treatment is gaining traction at a 17.8% CAGR because biogas attracts carbon credits and renewable gas certificates. Gasification and pyrolysis remain niche at under 2% of capacity due to tar handling and high capital intensity.
Anaerobic digestion benefits from the relaunch of the China Certified Emission Reduction scheme, which paid an average USD 13.21 per tonne CO2-eq in 2025, boosting project revenues by up to 18%. The National Energy Administration aims to triple digestion capacity to supply 30 billion m3 of biogas by 2030. This trajectory positions biological routes to gradually erode thermal dominance, though incineration still tolerates 60% moisture and unsorted feed, a capability unmatched by digestion or RDF lines.
Municipal solid waste represented 74.8% of throughput in 2025, yet agricultural and agro-industrial residues are growing at 15.6% CAGR under straw-utilization mandates that target 60% recovery by 2028. Industrial solid waste contributed 12% of feedstock, and sewage sludge 5%.
Seasonality and storage costs challenge straw projects, yet USD 6.96-11.13 per tonne collection subsidies and flexible feed-in-tariff quotas improve economics. Sludge co-incineration attracts disposal fees twice those of household waste, helping urban operators backfill capacity lost to recycling. These trends broaden the resource base for the Chinese waste-to-energy market while aligning with rural revitalization policies.
Complete Report Scope:
- By Technology
- Physical (Refuse-Derived Fuel, Mechanical Biological Treatment)
- Thermal (Incineration/Combustion, Gasification, Pyrolysis and Plasma-Arc)
- Biological (Anaerobic Digestion, Fermentation)
- By Waste Type
- Municipal Solid Waste
- Industrial Waste
- Agricultural and Agro-industrial Residues
- Sewage Sludge
- Others (Commercial, Construction, Hazardous)
- By Energy Output
- Electricity
- Heat
- Combined Heat and Power (CHP)
- Transportation Fuels (Bio-SNG, Bio-LNG, Ethanol)
- By End-user
- Utilities and IPPs
- Industrial Captive Plants
- District Heating Operators
- Transport Fuel Distributors
List of Companies Covered in this Report:
- China Everbright Environment Group Ltd
- Zheneng Jinjiang Environment Holding Co Ltd
- Zhejiang Weiming Environment Protection Co Ltd
- Grandblue Environment Co Ltd
- Dynagreen Environmental Protection Group Co Ltd
- China Tianying Inc
- Beijing Capital Eco-Environment Protection Group
- Beijing Enterprises Environment Group Ltd
- Shanghai Environment Group
- Sanfeng Environment Co Ltd
- Veolia Environnement SA (China Ops)
- Hitachi Zosen Inova AG
- Mitsubishi Heavy Industries Environmental & Chemical Eng.
- Babcock & Wilcox Enterprises Inc
- Covanta Holding Corporation
- Suez SA (China Ops)
- Keppel Seghers
- Dongjiang Environmental Co Ltd
- Tianjin Teda Environmental Protection Co Ltd
- Jiangsu Huahong Technology Co Ltd
- StockViz Top Revenue Players ? USD 0.8 Bn (others)
Additional Benefits:
- The market estimate (ME) sheet in Excel format
- 3 months of analyst support
TABLE OF CONTENTS
1 Introduction
- 1.1 Study Assumptions & Market Definition
- 1.2 Scope of the Study
2 Research Methodology
3 Executive Summary
4 Market Landscape
- 4.1 Market Overview
- 4.2 Market Drivers
- 4.2.1 Mainstream Policy-Driven Gate Fees & FIT Subsidies
- 4.2.2 National "Zero-Waste City" Roll-out (113 cities by 2027)
- 4.2.3 Grid-Parity Large-Scale Incinerator Retrofits (Ultra-Supercritical)
- 4.2.4 Under-the-Radar High-Value Plastics Segregation Boosting LHV
- 4.2.5 AI-Optimised Dispatch of CHP Exports to District Heating
- 4.2.6 Provincial RDF Blending Mandates for Cement Kilns
- 4.3 Market Restraints
- 4.3.1 Mainstream Rising Public Opposition & Social Licence Costs
- 4.3.2 Stricter Dioxin/Furan Emission Caps (GB 18485-2025)
- 4.3.3 Under-the-Radar Recycling-Led Feedstock Shortfalls in Tier-1 Cities
- 4.3.4 Volatile Carbon Credit Prices Reducing PPP IRRs
- 4.4 Supply-Chain Analysis
- 4.5 Regulatory Landscape
- 4.6 Technological Outlook
- 4.7 Porter's Five Forces
- 4.7.1 Threat of New Entrants
- 4.7.2 Bargaining Power of Suppliers
- 4.7.3 Bargaining Power of Buyers
- 4.7.4 Threat of Substitutes
- 4.7.5 Competitive Rivalry
- 4.8 PESTLE Analysis
5 Market Size & Growth Forecasts
- 5.1 By Technology
- 5.1.1 Physical (Refuse-Derived Fuel, Mechanical Biological Treatment)
- 5.1.2 Thermal (Incineration/Combustion, Gasification, Pyrolysis and Plasma-Arc)
- 5.1.3 Biological (Anaerobic Digestion, Fermentation)
- 5.2 By Waste Type
- 5.2.1 Municipal Solid Waste
- 5.2.2 Industrial Waste
- 5.2.3 Agricultural and Agro-industrial Residues
- 5.2.4 Sewage Sludge
- 5.2.5 Others (Commercial, Construction, Hazardous)
- 5.3 By Energy Output
- 5.3.1 Electricity
- 5.3.2 Heat
- 5.3.3 Combined Heat and Power (CHP)
- 5.3.4 Transportation Fuels (Bio-SNG, Bio-LNG, Ethanol)
- 5.4 By End-user
- 5.4.1 Utilities and IPPs
- 5.4.2 Industrial Captive Plants
- 5.4.3 District Heating Operators
- 5.4.4 Transport Fuel Distributors
6 Competitive Landscape
- 6.1 Market Concentration
- 6.2 Strategic Moves (M&A, Partnerships, PPAs)
- 6.3 Market Share Analysis (Market Rank/Share for key companies)
- 6.4 Company Profiles (includes Global level Overview, Market level overview, Core Segments, Financials as available, Strategic Information, Products & Services, and Recent Developments)
- 6.4.1 China Everbright Environment Group Ltd
- 6.4.2 Zheneng Jinjiang Environment Holding Co Ltd
- 6.4.3 Zhejiang Weiming Environment Protection Co Ltd
- 6.4.4 Grandblue Environment Co Ltd
- 6.4.5 Dynagreen Environmental Protection Group Co Ltd
- 6.4.6 China Tianying Inc
- 6.4.7 Beijing Capital Eco-Environment Protection Group
- 6.4.8 Beijing Enterprises Environment Group Ltd
- 6.4.9 Shanghai Environment Group
- 6.4.10 Sanfeng Environment Co Ltd
- 6.4.11 Veolia Environnement SA (China Ops)
- 6.4.12 Hitachi Zosen Inova AG
- 6.4.13 Mitsubishi Heavy Industries Environmental & Chemical Eng.
- 6.4.14 Babcock & Wilcox Enterprises Inc
- 6.4.15 Covanta Holding Corporation
- 6.4.16 Suez SA (China Ops)
- 6.4.17 Keppel Seghers
- 6.4.18 Dongjiang Environmental Co Ltd
- 6.4.19 Tianjin Teda Environmental Protection Co Ltd
- 6.4.20 Jiangsu Huahong Technology Co Ltd
- 6.4.21 StockViz
7 Market Opportunities & Future Outlook
- 7.1 White-Space & Unmet-Need Assessment

 2034年垃圾焚化發電市場預測-全球分析(依技術、廢棄物類型、能源產量、工廠產能、原料來源、應用、最終用戶、所有權結構、設施類型和地區分類)
 垃圾焚化發電市場:2026-2032年全球市場預測(按技術、原料類型、工廠產能、能源產量、應用、最終用戶和所有權類型分類)
 全球垃圾焚化發電市場規模、佔有率、趨勢和成長分析報告(2026-2034年)生質能和垃圾焚化發電市場預測至2034年—按原料、技術、應用、最終用戶和地區分類的全球分析
 東南亞垃圾焚化發電:市場佔有率分析、產業趨勢與統計及成長預測(2026-2031 年)
 垃圾焚化發電市場規模、佔有率和趨勢分析報告:按技術、地區和細分市場分類(2026-2033 年)
 廢棄物衍生燃料市場:依燃料類型、應用、最終用戶產業和地區分類。垃圾焚化發電(WTE):市場佔有率分析、產業趨勢與統計、成長預測(2026-2031 年)垃圾焚化發電市場:按設備類型和地區分類
 2026年全球垃圾掩埋沼氣氣化能源(LFGTE)系統市場報告