


 |
市場調查報告書
商品編碼
2073546
浮體式液化天然氣發電廠:市佔率分析、產業趨勢與統計及成長預測(2026-2031 年)Floating LNG Power Plant - Market Share Analysis, Industry Trends & Statistics, Growth Forecasts (2026 - 2031) |
||||||

※ 本網頁內容可能與最新版本有所差異。詳細情況請與我們聯繫。
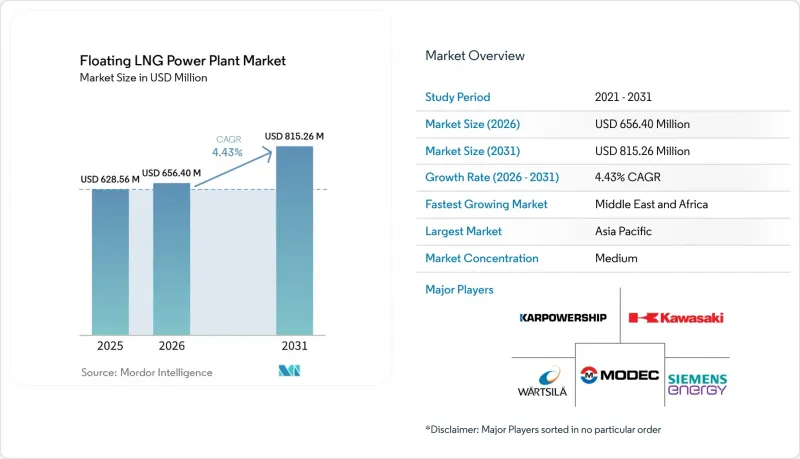
根據 Mordor Intelligence 預測,浮體式液化天然氣發電廠市場規模將從 2025 年的 6.2856 億美元成長到 2021 年的 6.564 億美元,到 2031 年達到 8.1526 億美元,在 2025 年至 2031 年的預測期內,複合年成長率將達到 4.3%。
本報告按類型(發電駁船、發電船舶)、發電容量(50兆瓦以下及以上)、應用(尖峰電力供應、基本負載電力供應、緊急和災害救援)、最終用戶(公共產業和獨立發電商 (IPP)、工業、商業和資料中心)以及地區(北美、歐洲、亞太、南美、中東和非洲)進行細分。市場預測以美元計價。
全球浮體式液化天然氣發電廠市場趨勢及洞察
液化天然氣相對於柴油的價格優勢仍然是其最強勁的商業性驅動力。
浮體式液化天然氣(LNG)發電廠市場持續受惠於強勁的燃料成本優勢。例如,根據UHERO發布的2026年數據,在與布蘭特原油價格掛鉤的情況下,LNG的交付價格為每百萬英熱單位(MMBtu)17.90美元,而低硫重質燃料油(LSFO)的價格為每百萬英熱單位22.20美元。印尼也出現了類似的成本趨勢。 2025年4月發表的一項同行評審研究表明,供應給島嶼發電廠的天然氣價格為每百萬英熱單位10.40至11.30美元,遠低於每百萬英熱單位25.50美元的高速柴油,天然氣的成本優勢高達55%至60%。這種價格差異正在推動浮體式LNG發電廠市場的專案活動。例如,2025年3月,印尼國家電力公司(PLN EPI)宣布了小規模LNG計畫。該計畫的目標是改造島上 41 座發電廠,總合裝置容量為 2,148 兆瓦,目標是每年減少 3 億美元的柴油燃料成本。
與分開採購相比,一體化浮體式儲存、再氣化和發電船解決方案具有更大的成本優勢。 Rahmanta 等人的研究表明,當浮式儲存再氣化裝置 (FSRU) 和發電資產分開採購時,樞紐輻射式供應鏈成本可能佔天然氣交付價格的 30-40%。這凸顯了一體化船舶解決方案的優勢,該方案消除了液化天然氣 (LNG) 發電供應鏈中的中間成本節點。因此,浮體式LNG 發電廠市場不僅受益於燃料成本的降低,也受惠於更有效率的供應模式。在競標中將再氣化和發電分開的籌資策略可能會低估一體化解決方案的商業性效益,並有利於那些能夠透過單一平台提供燃料接收、儲存、再氣化和發電服務的營運商。
國際海事組織的CII和EEXI正在加速船隊向燃氣動力船舶的轉換。
浮體式液化天然氣(LNG)發電廠市場受監管趨勢和燃料經濟性的影響。作為2025年4月舉行的第83屆國際海事組織海洋環境保護委員會(MEPC)會議的成果,引入了分兩階段實施的溫室氣體(GHG)燃料強度框架,要求到2028年將燃料強度在2008年基準值的基礎上降低4%至17%,到2035年降低30%至43%。在此框架下,配備高壓柴油迴圈引擎(甲烷洩漏率約為0.2%)的LNG運輸船在商業商業性比配備奧托循環中速引擎(甲烷洩漏率顯著更高)的LNG運輸船更具優勢。這已經開始影響市場上的船舶規格。例如,2026年1月,沃爾茲拉公司宣布其「NextDF」技術可以將四衝程雙燃料引擎的甲烷洩漏率降低到1%以下,使新設計更符合監管要求。
成本壓力在歐洲尤為顯著,歐盟排放交易體系(EU ETS)已擴大其範圍,自2026年起將甲烷和一氧化二氮納入其中。停靠歐盟港口的船舶業者必須在2026年前返還相當於其2025年船舶排放70%的排放權。這項監管變化正在浮體式液化天然氣發電廠市場造成兩極化。能夠維持租船獲利能力的新型船隊處於有利地位,而老舊的奧托循環船舶將在2020年代末面臨一個關鍵抉擇:要么進行大規模改裝,要么退役。儘早投資於甲烷排放措施的船東將在2026年至2031年間獲得續約機會。相反,推遲此類投資的船東可能會面臨船舶估值下降和定價權削弱的風險。
租船費率的波動會為整個價值鏈帶來資金籌措風險。
在浮體式液化天然氣(LNG)發電廠市場,租船費率的大幅波動構成資金籌措挑戰。這是因為船舶獲利能力、燃料成本轉嫁條款以及費用收取都與合約簽訂時的租船費率週期密切相關。 2022年之前,浮式儲存再氣化裝置(FSRU)的平均租船費率為每天8萬至12萬美元,但在歐洲能源危機後飆升至每天18萬至20萬美元,到2024年中期,改裝船舶的租船費率穩定在每天約13萬至15萬美元。根據草案中引用的分析,在LNG和租船市場低迷的情況下,建構長期購電協議(PPA)的難度是該市場面臨的一項重大挑戰。轉嫁條款將價格波動的風險轉移給購電方,而固定價格結構則會擠壓業者的利潤空間。例如,草案中列舉了巴西的案例。據估計,巴西8艘浮式儲存再氣化裝置(FSRU)的日租金接近100萬美元,四年總計15億美元,這些成本最終都轉嫁到了受監管的費率中。在2022-2023年高峰期獲得租船合約的營運商,如今在重新競標時處於劣勢,因為他們需要在疲軟的市場中與成本更低的船舶競爭。這並不意味著對浮體式液化天然氣(LNG)發電廠的需求將會消失,但確實增加了整個價值鏈在資金籌措、再融資和費率核准方面面臨的挑戰。
細分市場分析
到2025年,動力駁船將佔據浮體式液化天然氣(LNG)電站市場59.6%的佔有率,而動力船預計到2031年將以5.1%的複合年成長率成長。動力駁船之所以佔據市場主導地位,是因為其結構設計較為簡單。這降低了船體成本,並為渦輪機、餘熱回收系統和控制設備騰出了更多甲板空間。與同類動力船相比,這種設計優勢通常可使總資本支出(CAPEX)降低15-20%,使駁船成為對價格敏感的競標中更具成本效益的選擇。在浮體式LNG電站市場,駁船較低的建造成本使其非常適合對移動性要求不高、更注重安裝效率和穩定輸出的基本負載合約。
由於具備自航能力,發電船的市場佔有率正在迅速擴大,這使得它們能夠在簽訂合約後的幾週內重新部署。這一特性在緊急競標和短期容量競標中尤為有利。例如,新加坡科技工程公司(ST Engineering)於2025年10月簽署的「Estrella del Mar IV」契約,是一座145兆瓦的浮體式聯合循環發電廠,配備船上鋰離子電池儲能系統,這清晰地展現了移動性和混合動力發電容量整合方面的進步。這種柔軟性使船舶能夠在基本負載和峰值支援角色之間切換,在保持天然氣發電核心功能的同時,擴大了浮體式液化天然氣發電廠市場的商機。雖然預計在預測期內電力駁船仍將佔據主導地位,但在各國政府優先考慮快速響應、合約柔軟性以及在盡量減少民用基礎設施需求的情況下跨境重新部署發電容量的情況下,發電船可能會獲得發展動力。
2025年,51-200兆瓦功率範圍將佔浮體式液化天然氣發電廠市場規模的49.3%,顯示其適用於島嶼電網、偏遠工業負載和小規模城市系統。此功率範圍允許在浮體式平台上部署聯合循環燃氣渦輪機配置,其淨效率可達50-55%,而單循環開放式框架系統的淨效率僅為35-42%。此功率範圍在易於管理的船舶尺寸和更高的燃料效率之間實現了平衡,使其成為大型單體裝置不可行且需要穩定輸出的應用的關鍵領域。
預計401兆瓦及以上功率等級將成為成長最快的細分市場,到2031年年複合成長率(CAGR)將達到5.9%。這一成長主要得益於電力公司優先選擇單船解決方案,以最大限度地降低多機組運作帶來的協調風險。這一趨勢在南亞和非洲尤為顯著,在這些地區,大規模電力公司在採購時越來越傾向於選擇大型浮體式電站,而非模組化擴建方案。到2026年5月,Carpoship的船隊規模將超過8,500兆瓦,擁有45艘船舶,充分證明了大規模部署的商業性可行性。同時,50兆瓦以下功率等級的船舶在緊急備用和小規模島嶼地區的電力供應方面繼續發揮著至關重要的作用,而201-400兆瓦功率等級的船舶則繼續滿足採礦、海上油田供應和偏遠工業區的電力需求。在這些領域,中型船舶在燃料物流和併網發電能力方面具有優勢。
區域分析
到2025年,亞太地區將佔據浮體式液化天然氣(FSRU)電廠市場36.1%的佔有率,成為目前需求量最大的區域中心。該地區受益於印尼、馬來西亞、日本和韓國等國島嶼電氣化需求、沿海高密度負載中心以及成熟的液化天然氣供應鏈等多重因素。印尼仍然是關鍵市場,印尼國家電力公司(PLN EPI)於2025年3月啟動了一項15億美元的小規模液化天然氣項目,以支持41座島嶼電廠。同儕審查的分析表明,採用一體化的FSRUPP結構可以降低成本,因為它消除了供應鏈環節,而這些環節如果資產分散,可能會佔天然氣交付價格的30-40%。此外,正如越南海防FSRU計畫和JERA提案的夏威夷FSRU連結計畫所表明的那樣,該地區正在拓展現有市場之外的業務,這表明亞太地區的專業知識正在輸出到鄰近的島嶼電力走廊。
預計到2031年,中東和非洲地區的複合年成長率將達到4.6%,成為浮體式液化天然氣發電廠市場成長最快的地區。非洲能源商會預測,到2050年,非洲天然氣需求將成長60%,這項預測也印證了上述成長趨勢。塞內加爾的達喀爾計畫就是這一趨勢的典型例證。該項目包含一個335兆瓦的一體化液化天然氣發電廠系統,無需陸上天然氣基礎設施即可滿足高達25%的國內需求。埃及正進一步鞏固其作為浮體式天然氣樞紐的地位。 Hoegh Evi公司與埃及簽訂了一份為期10年的Hoegh Gandria號浮式再氣化裝置租賃協議,預計從2026年第四季度起,該裝置將使斯梅德港的尖峰時段再氣化能力提高至多10億立方英尺/天。同樣,約旦決定於2026年5月在亞喀巴港租賃一艘新的浮式再氣化裝置,也凸顯了該地區對浮體式再氣化作為天然氣供應鏈安全標準組成部分的依賴程度日益提高。
歐洲和美洲雖然市場規模相對小規模,但對於浮體式液化天然氣(LNG)發電廠而言,它們仍佔有重要的戰略地位。這些地區的特點是:既有備用電力需求,又存在對天然氣供應穩定性的擔憂,同時也大規模的採購項目。在巴西,2026年的備用電力容量競標中,約有8.5吉瓦的LNG火電裝機容量被簽訂契約,吸引了約480億巴西幣(約合96億美元)的投資,用於支持多個州新建或擴建的浮式儲存再氣化裝置(FSRU)基礎設施。在美洲,墨西哥尤卡坦半島的部署以及JERA在夏威夷的提案凸顯了在陸上基礎設施投入運作之前,無論是在新興地區還是在監管區域,都需要可調節電力供應,因此這些地區都存在著發展機會。在歐洲,供應穩定性仍是重中之重,預計剛果(金)的LNG年產量將在2026年初達到300萬噸。這將為尋求減少對俄羅斯天然氣依賴的電力營運商提供新的浮體式供應來源。
其他好處:
- Excel格式的市場預測(ME)表
- 3個月的分析師支持
目錄
第1章:引言
- 研究假設和市場定義
- 調查範圍
第2章:調查方法
第3章執行摘要
第4章 市場狀況
- 市場概覽
- 市場促進因素
- 在獨立電網中,主流液化天然氣相對於柴油燃料具有價格優勢。
- IMO 的 CII 和 EEXI 正在促進燃氣船舶資產的發展。
- 在非洲天然氣發電競標中,可移動式船舶是首選。
- 人工智慧驅動的負載容量平衡軟體拓展了混合動力駁船的應用可能性。
- 老舊的蒸氣渦輪LNG裝運船隻適合改造成發電廠。
- 模組化低溫防噴器組件使駁船的資本支出減少了 25%。
- 市場限制因素
- 由於液化天然氣供應過剩,租船費率持續波動。
- 嚴格的甲烷洩漏法規對雙燃料引擎構成威脅。
- 易受颶風損害的停泊設施的保險費
- 擁擠的煤炭碼頭泊位不足。
- 供應鏈分析
- 監理情勢
- 技術展望
- 波特五力分析
第5章 市場規模與成長預測
- 按類型
- 動力駁船
- 動力船
- 按發電能力
- 小於50兆瓦
- 51~200 MW
- 201~400 MW
- 超過401兆瓦
- 透過使用
- 峰值功率
- 基本負載供應
- 緊急/災害救援
- 最終用戶
- 公用事業和獨立電力生產商(IPP)
- 工業(採礦、石油和天然氣、海水淡化)
- 商業設施和資料中心
- 按地區
- 北美洲
- 美國
- 加拿大
- 墨西哥
- 歐洲
- 英國
- 德國
- 法國
- 西班牙
- 北歐國家
- 俄羅斯
- 其他歐洲國家
- 亞太地區
- 中國
- 印度
- 日本
- 韓國
- 馬來西亞
- 泰國
- 印尼
- 越南
- 澳洲
- 其他亞太國家
- 南美洲
- 巴西
- 阿根廷
- 哥倫比亞
- 其他南美國家
- 中東和非洲
- 阿拉伯聯合大公國
- 沙烏地阿拉伯
- 南非
- 埃及
- 其他中東和非洲國家
- 北美洲
第6章 競爭情勢
- 市場集中度
- 策略趨勢
- 市佔率分析
- 公司簡介
- Bumi Armada Berhad
- CMHI Haimen
- Damen Shipyards Group
- GE Vernova Inc.
- Golar Power
- Hanwha Ocean Co., Ltd.
- Karpowership
- Kawasaki Heavy Industries, Ltd.
- Seatrium Limited
- MAN Energy Solutions
- Mitsubishi Heavy Industries, Ltd.
- MODEC, Inc.
- Power Barge Corporation
- Samsung Heavy Industries Co., Ltd.
- Siemens Energy AG
- Tri-Yard Power Solutions
- TSUNEISHI Shipbuilding
- VARD
- Wartsila Oyj Abp
- Shanghai Zhenhua Heavy Industries Co., Ltd.
第7章 市場機會與未來展望
According to Mordor Intelligence, the floating LNG power vessel market is expected to grow from USD 628.56 million in 2025 to USD 656.40 million in the same year and is projected to reach USD 815.26 million by 2031, registering a CAGR of 4.43% during the forecast period of 2025-2031.
This report is Segmented by Type (Power Barge, Power Ship), Power Capacity (<= 50 MW and More), Application (Peak Power Supply, Base-Load Supply, Emergency/Disaster Relief), End-User (Utilities & IPPs, Industrial, Commercial & Data-Centres), and Geography (North America, Europe, Asia-Pacific, South America, and Middle East and Africa). The Market Forecasts are Provided in Terms of Value (USD).
Global Floating LNG Power Plant Market Trends and Insights
LNG Price Advantage Over Diesel Remains the Sharpest Commercial Driver
The floating LNG power vessel market continues to rely on a strong fuel-cost advantage, as evidenced in 2026 when UHERO reported delivered LNG prices at USD 17.9 per MMBtu compared to LSFO at USD 22.2 per MMBtu under Brent-linked conditions. A similar cost dynamic was observed in Indonesia, where peer-reviewed research published in April 2025 indicated natural gas delivered to island plants at USD 10.4-11.3 per MMBtu, significantly lower than high-speed diesel at USD 25.5 per MMBtu, maintaining a 55-60% cost advantage for natural gas. This price differential is driving project activity in the floating LNG power vessel market. For instance, PLN EPI announced a USD 1.5 billion small-scale LNG program in March 2025, targeting 41 island plants with a combined capacity of 2,148 MW and aiming for annual diesel savings of USD 300 million.
Integrated floating storage, regasification, and power vessels offer an additional cost advantage over separated assets. Research by Rahmanta and co-authors highlighted that hub-and-spoke supply-chain costs can account for 30-40% of the delivered gas price when FSRU and generation assets are procured separately. This underscores the benefits of a bundled vessel solution, which eliminates an intermediate cost node in the LNG-to-power supply chain. Consequently, the floating LNG power vessel market benefits not only from lower fuel costs but also from a streamlined delivery model. Procurement strategies that separate regasification and generation in tenders risk undervaluing the commercial benefits of an integrated solution, favoring operators capable of delivering fuel intake, storage, regasification, and power generation through a single platform.
IMO CII And EEXI Are Accelerating Fleet Transition Toward Gas-Fired Vessels
The floating LNG power vessel market is influenced by regulatory developments and fuel economics. The April 2025 IMO MEPC 83 outcome introduced a two-tier GHG fuel-intensity framework, requiring reductions of 4-17% by 2028 and 30-43% by 2035 compared to 2008 baselines. Within this framework, LNG vessels equipped with high-pressure diesel-cycle engines, which have a methane slip near 0.2%, are commercially better positioned than Otto medium-speed alternatives with significantly higher slip rates. This has already impacted vessel specifications in the market. For instance, Wartsila announced in January 2026 that its NextDF technology can reduce methane slip in four-stroke dual-fuel engines to below 1%, aligning newer designs more closely with compliance requirements.
Cost pressures are particularly pronounced in Europe, where the EU ETS expanded its scope to include methane and nitrous oxide starting in 2026. Operators calling at EU ports must surrender allowances for 70% of their 2025 vessel emissions in 2026. This regulatory shift is creating a divide within the floating LNG power vessel market. Newer fleets capable of maintaining charter economics are better positioned, while older Otto-cycle assets face significant retrofit or retirement decisions by the end of the decade. Vessel owners who invest early in methane-abatement measures can safeguard rechartering opportunities during the 2026-2031 period. Conversely, those who delay such investments are likely to encounter reduced vessel valuations and diminished pricing power.
Charter Rate Volatility Creates Financing Risk Across The Value Chain
The floating LNG power vessel market experiences financing challenges when charter pricing fluctuates significantly, as vessel economics, fuel pass-through terms, and tariff recovery are closely tied to the rate cycle at the time of contract signing. FSRU charter rates, which averaged USD 80,000-120,000 per day before 2022, surged to USD 180,000-200,000 per day following the European energy crisis and stabilized at approximately USD 130,000-150,000 per day for converted vessels by mid-2024, according to the analysis referenced in the draft. A key issue for the market is the difficulty in structuring long-term Power Purchase Agreements (PPAs) in a declining LNG and charter market. Pass-through clauses transfer volatility to off-takers, while fixed-price structures reduce operator margins. For instance, the draft highlights Brazil, where charter contracts for eight FSRUs were estimated at nearly USD 1 million per day, amounting to USD 1.5 billion over four years, with costs passed through regulated tariffs. Operators who secured charters during the 2022-2023 peak now face disadvantages in rebidding, competing against lower-cost vessels in a softer market. While this does not eliminate demand for floating LNG power vessels, it increases challenges related to financing, refinancing, and tariff approvals throughout the value chain.
Other drivers and restraints analyzed in the detailed report include:
- African Gas-To-Power Tenders Are a Structural Demand Catalyst
- AI-Driven Load-Balancing Software Is Redefining Barge Operational Economics
- Methane-Slip Regulation Is Narrowing The Operational Life Of Older Dual-Fuel Fleets
For complete list of drivers and restraints, kindly check the Table Of Contents.
Segment Analysis
Power barges accounted for 59.6% of the floating LNG power vessel market share in 2025, while power ships are projected to grow at a compound annual growth rate (CAGR) of 5.1% through 2031. The dominance of power barges is attributed to their simpler structural design, which reduces hull costs and provides additional deck space for turbines, heat recovery systems, and control equipment. This design advantage typically lowers total capital expenditure (CAPEX) by 15-20% compared to similar power ships, making barges a cost-effective option in price-sensitive tenders. In the floating LNG power vessel market, the lower construction costs of barges align well with base-load contracts where mobility is less critical, and installation efficiency and stable output are prioritized.
Power ships are gaining market share more rapidly due to their self-propulsion capabilities, which enable redeployment within weeks of a contract award. This feature is particularly advantageous in emergency tenders and short-notice capacity auctions. For instance, ST Engineering's October 2025 contract for Estrella del Mar IV, a 145 MW floating combined-cycle plant equipped with onboard lithium-ion battery storage, highlights the increasing integration of mobility with hybrid dispatch capabilities. This flexibility allows vessels to transition between base-load and peak support roles, expanding revenue opportunities while maintaining their core gas-to-power function within the floating LNG power vessel market. While power barges are expected to remain the dominant format over the forecast period, power ships are poised to gain traction in scenarios where governments prioritize rapid response times, contract flexibility, and the ability to relocate capacity across borders with minimal civil infrastructure requirements.
The 51-200 MW range represented 49.3% of the floating LNG power vessel market size in 2025, highlighting its suitability for island grids, remote industrial loads, and smaller urban systems. At this capacity, combined-cycle gas turbine configurations become feasible on floating platforms, achieving net efficiency levels of 50-55%, compared to 35-42% for simple-cycle open-frame systems. This range offers a balance between manageable vessel size and improved fuel efficiency, making it a key segment for applications requiring steady output without the capacity to accommodate large single-vessel installations.
The >= 401 MW category is projected to be the fastest-growing segment, with a compound annual growth rate (CAGR) of 5.9% through 2031. This growth is driven by utilities prioritizing single-vessel solutions to minimize coordination risks associated with multiple units. This trend is particularly evident in South Asia and Africa, where large-scale utility procurement increasingly favors larger floating plants over modular additions. By May 2026, Karpowership's fleet had surpassed 8,500 MW across 45 vessels, demonstrating the commercial viability of large-scale deployments. Meanwhile, the <= 50 MW range remains significant for emergency backup and small-island applications, while the 201-400 MW range continues to serve mining operations, offshore oil-field supply, and remote industrial power needs, where mid-sized vessels are advantageous due to fuel logistics and grid absorption considerations.
Complete Report Scope:
- By Type
- Power Barge
- Power Ship
- By Power Capacity
- less than 50 MW
- 51 - 200 MW
- 201 - 400 MW
- more than 401 MW
- By Application
- Peak Power Supply
- Base-Load Supply
- Emergency / Disaster Relief
- By End-user
- Utilities & IPPs
- Industrial (Mining, O&G, Desalination)
- Commercial & Data-Centres
- By Geography
- North America
- United States
- Canada
- Mexico
- Europe
- United Kingdom
- Germany
- France
- Spain
- Nordic Countries
- Russia
- Rest of Europe
- Asia-Pacific
- China
- India
- Japan
- South Korea
- Malaysia
- Thailand
- Indonesia
- Vietnam
- Australia
- Rest of Asia-Pacific
- South America
- Brazil
- Argentina
- Colombia
- Rest of South America
- Middle East and Africa
- United Arab Emirates
- Saudi Arabia
- South Africa
- Egypt
- Rest of Middle East and Africa
- North America
Geography Analysis
Asia-Pacific accounted for 36.1% of the floating LNG power vessel market share in 2025, making it the largest regional base for current demand. The region benefits from a combination of island electrification needs, dense coastal load centers, and a mature LNG supply chain across countries such as Indonesia, Malaysia, Japan, and South Korea. Indonesia remains a key market, with PLN EPI launching a USD 1.5 billion small-scale LNG program in March 2025 to support 41 island plants. A peer-reviewed analysis highlighted that integrated FSRPP structures reduce costs by eliminating a supply-chain link that can account for 30-40% of the delivered gas price when assets are separated. Additionally, the region is expanding beyond established markets, as evidenced by the Haiphong FSRU project in Vietnam and JERA's proposed Hawaii FSRU-linked program, demonstrating that Asia-Pacific expertise is being exported to adjacent island-power corridors.
The Middle East and Africa are projected to grow at a 4.6% CAGR through 2031, making it the fastest-expanding region in the floating LNG power vessel market. This growth is supported by the African Energy Chamber's projection that natural gas demand across Africa will increase by 60% by 2050. Senegal's Dakar project exemplifies this trend with a 335 MW integrated LNG-to-power system capable of meeting up to 25% of national demand without requiring onshore gas infrastructure. Egypt is further solidifying its role as a floating gas hub, with Hoegh Evi's 10-year charter for the Hoegh Gandria expected to add up to 1,000 mmscfd of peak regasification capacity at Port of Sumed starting in Q4 2026. Similarly, Jordan's decision in May 2026 to lease a new FSRU for Aqaba underscores the growing reliance on floating regasification as a standard component of grid gas supply security in the region.
While Europe and the Americas currently represent smaller markets in terms of scale, they remain strategically significant for the floating LNG power vessel market. These regions combine reserve-power needs, gas-security concerns, and selective large-capacity procurement. In Brazil, the 2026 reserve capacity auction contracted nearly 8.5 GW of LNG-fired thermal capacity, attracting an estimated BRL 48 billion (USD 9.6 billion) in investment to support new or expanded FSRU infrastructure across multiple states. In the Americas, Mexico's Yucatan deployment and JERA's Hawaii proposal highlight opportunities in both frontier and regulated systems where dispatchable power is required before onshore infrastructure becomes operational. In Europe, supply security remains a priority, with Congo LNG output reaching 3 million tonnes per year in early 2026, providing an additional floating supply source for utilities aiming to reduce reliance on Russian gas.
- Bumi Armada Berhad
- CMHI Haimen
- Damen Shipyards Group
- GE Vernova Inc.
- Golar Power
- Hanwha Ocean Co., Ltd.
- Karpowership
- Kawasaki Heavy Industries, Ltd.
- Seatrium Limited
- MAN Energy Solutions
- Mitsubishi Heavy Industries, Ltd.
- MODEC, Inc.
- Power Barge Corporation
- Samsung Heavy Industries Co., Ltd.
- Siemens Energy AG
- Tri-Yard Power Solutions
- TSUNEISHI Shipbuilding
- VARD
- Wartsila Oyj Abp
- Shanghai Zhenhua Heavy Industries Co., Ltd.
Additional Benefits:
- The market estimate (ME) sheet in Excel format
- 3 months of analyst support
TABLE OF CONTENTS
1 Introduction
- 1.1 Study Assumptions & Market Definition
- 1.2 Scope of the Study
2 Research Methodology
3 Executive Summary
4 Market Landscape
- 4.1 Market Overview
- 4.2 Market Drivers
- 4.2.1 Mainstream LNG-price advantage vs. diesel in island grids
- 4.2.2 IMO CII & EEXI pushing gas-fired marine assets
- 4.2.3 African gas-to-power tenders favour redeployable vessels
- 4.2.4 AI-driven load-balancing software unlocks hybrid barges
- 4.2.5 Ageing steam-turbine LNG carriers ripe for power-plant conversion
- 4.2.6 Modular cryogenic BOP packages cut barge CAPEX 25 %
- 4.3 Market Restraints
- 4.3.1 LNG shipping over-capacity keeps charter rates volatile
- 4.3.2 High methane-slip regulations threaten dual-fuel engines
- 4.3.3 Insurance premiums for cyclone-prone moorings
- 4.3.4 Limited berth availability at congested coal terminals
- 4.4 Supply-Chain Analysis
- 4.5 Regulatory Landscape
- 4.6 Technological Outlook
- 4.7 Porter's Five Forces Analysis
- 4.7.1 Threat of New Entrants
- 4.7.2 Bargaining Power of Buyers
- 4.7.3 Bargaining Power of Suppliers
- 4.7.4 Threat of Substitutes
- 4.7.5 Competitive Rivalry
5 Market Size & Growth Forecasts
- 5.1 By Type
- 5.1.1 Power Barge
- 5.1.2 Power Ship
- 5.2 By Power Capacity
- 5.2.1 less than 50 MW
- 5.2.2 51 - 200 MW
- 5.2.3 201 - 400 MW
- 5.2.4 more than 401 MW
- 5.3 By Application
- 5.3.1 Peak Power Supply
- 5.3.2 Base-Load Supply
- 5.3.3 Emergency / Disaster Relief
- 5.4 By End-user
- 5.4.1 Utilities & IPPs
- 5.4.2 Industrial (Mining, O&G, Desalination)
- 5.4.3 Commercial & Data-Centres
- 5.5 By Geography
- 5.5.1 North America
- 5.5.1.1 United States
- 5.5.1.2 Canada
- 5.5.1.3 Mexico
- 5.5.2 Europe
- 5.5.2.1 United Kingdom
- 5.5.2.2 Germany
- 5.5.2.3 France
- 5.5.2.4 Spain
- 5.5.2.5 Nordic Countries
- 5.5.2.6 Russia
- 5.5.2.7 Rest of Europe
- 5.5.3 Asia-Pacific
- 5.5.3.1 China
- 5.5.3.2 India
- 5.5.3.3 Japan
- 5.5.3.4 South Korea
- 5.5.3.5 Malaysia
- 5.5.3.6 Thailand
- 5.5.3.7 Indonesia
- 5.5.3.8 Vietnam
- 5.5.3.9 Australia
- 5.5.3.10 Rest of Asia-Pacific
- 5.5.4 South America
- 5.5.4.1 Brazil
- 5.5.4.2 Argentina
- 5.5.4.3 Colombia
- 5.5.4.4 Rest of South America
- 5.5.5 Middle East and Africa
- 5.5.5.1 United Arab Emirates
- 5.5.5.2 Saudi Arabia
- 5.5.5.3 South Africa
- 5.5.5.4 Egypt
- 5.5.5.5 Rest of Middle East and Africa
- 5.5.1 North America
6 Competitive Landscape
- 6.1 Market Concentration
- 6.2 Strategic Moves
- 6.3 Market Share Analysis
- 6.4 Company Profiles (includes Global level Overview, Market level overview, Core Segments, Financials as available, Strategic Information, Market Rank/Share for key companies, Products & Services, and Recent Developments)
- 6.4.1 Bumi Armada Berhad
- 6.4.2 CMHI Haimen
- 6.4.3 Damen Shipyards Group
- 6.4.4 GE Vernova Inc.
- 6.4.5 Golar Power
- 6.4.6 Hanwha Ocean Co., Ltd.
- 6.4.7 Karpowership
- 6.4.8 Kawasaki Heavy Industries, Ltd.
- 6.4.9 Seatrium Limited
- 6.4.10 MAN Energy Solutions
- 6.4.11 Mitsubishi Heavy Industries, Ltd.
- 6.4.12 MODEC, Inc.
- 6.4.13 Power Barge Corporation
- 6.4.14 Samsung Heavy Industries Co., Ltd.
- 6.4.15 Siemens Energy AG
- 6.4.16 Tri-Yard Power Solutions
- 6.4.17 TSUNEISHI Shipbuilding
- 6.4.18 VARD
- 6.4.19 Wartsila Oyj Abp
- 6.4.20 Shanghai Zhenhua Heavy Industries Co., Ltd.
7 Market Opportunities & Future Outlook
- 7.1 White-space & Unmet-Need Assessment

 浮體式儲存再氣化裝置(FSRU)市場規模、佔有率和成長分析:按類型、結構、儲存能力、再氣化能力、錨碇系統、應用、最終用戶和地區分類-2026-2033年產業預測
 浮體式液化天然氣:市場佔有率分析、產業趨勢與統計、成長預測(2026-2031)
 浮體式液化天然氣(LNG)接收站市場規模、佔有率和趨勢分析報告:按接收站類型、應用、地區和細分市場預測(2026-2033 年)
 2026-2030年全球浮體式儲存再氣化裝置(FSRU)市場
 浮體式儲存再氣化裝置市場:按組件、船舶類型、容量、設計類型、運作方式和最終用戶產業分類-2026-2032年全球市場預測浮體式液化天然氣(FLNG)市場:按儲存系統、船舶類型、技術、儲存容量、運作狀態、應用和最終用戶分類-2026-2032年全球市場預測
 浮體式液化天然氣(FLNG)市場-全球產業規模、佔有率、趨勢、機會、預測:按技術、最終用戶、地區和競爭對手分類,2021-2031年浮體式天然氣發電廠市場(按組件、船舶類型、額定功率、技術和最終用戶)—2025-2030 年全球預測液化天然氣站市場(按分銷類型、功能、類型、終端類型、儲存容量和最終用途)—2025-2030 年全球預測FSRU 市場 - 全球產業規模、佔有率、趨勢、機會及預測(按供熱、應用、地區和競爭細分,2020-2030 年)