


 |
市場調查報告書
商品編碼
2062467
浮體式液化天然氣:市場佔有率分析、產業趨勢與統計、成長預測(2026-2031)Floating Liquefied Natural Gas - Market Share Analysis, Industry Trends & Statistics, Growth Forecasts (2026 - 2031) |
||||||
※ 本網頁內容可能與最新版本有所差異。詳細情況請與我們聯繫。
根據 Mordor Intelligence 預測,浮體式液化天然氣 (FLNG) 市場規模預計在 2025 年達到 255.7 億美元,在 2026 年達到 282 億美元,在 2031 年達到 447.2 億美元。
預計從 2026 年到 2031 年,其複合年成長率將達到 9.66%。
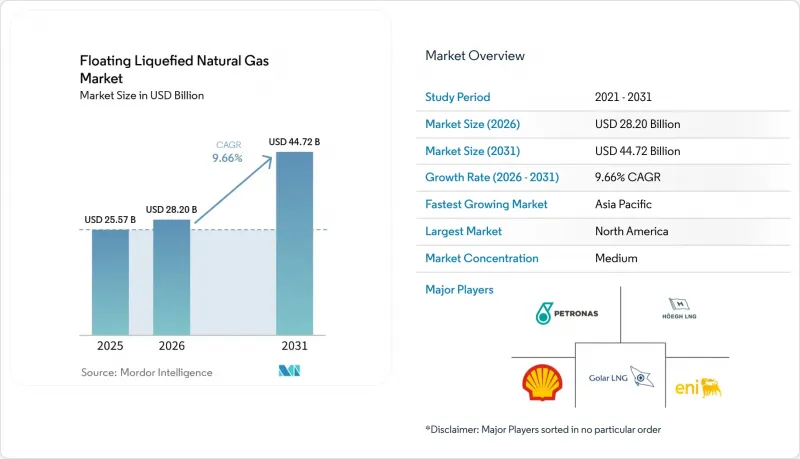
本報告按產能(小規模、中型和大型)、安裝類型(海上和沿海)、應用(液化、再氣化、儲存和運輸)以及地區(北美、歐洲、亞太、南美以及中東和非洲)進行細分。市場規模和預測均以美元計價。
全球浮體式液化天然氣(FLNG)市場趨勢與洞察
亞洲天然氣需求激增,原因是煤炭轉向天然氣。
預計到2030年,亞洲天然氣消費量將以每年5%的速度成長,這將對靈活的液化天然氣(LNG)供應產生極高的需求。浮式液化天然氣(FLNG)裝置為亞洲買家提供了管道和長途運輸之外的戰略多元化選擇,它無需大規模陸上終端即可直接從海上氣源向陸地輸送天然氣。隨著產業叢集向內陸遷移,FLNG裝置可以大規模地遷移到新的需求中心。當傳統進口終端面臨資金籌措障礙和土地使用的反對時,一些較小的亞洲國家也傾向於選擇FLNG,因為浮體式基礎設施是實現低排放能源目標的橋樑。除了在中國東部沿海地區小規模部署外,菲律賓和越南也正在引入模組化裝置,以滿足快速供應LNG以穩定電網的需求。預計2030年,該地區的進口國將吸收全球整體新增LNG供應量的70%,將增強亞洲對FLNG市場動態的影響力。
與俄羅斯衝突後歐洲為保障能源安全所做的努力
受歐盟再生能源計畫(REPowerEU)確保90天冬季供應的要求推動,預計到2025年,歐洲液化天然氣(LNG)進口量將達到1,430億立方公尺。德國已運作四艘浮動儲存再氣化裝置(FSRU),目前正在將剩餘液化天然氣進行液化和再出口,使波蘭和捷克共和國的買家無需新建管道即可利用浮體式設施。英國國家電網公司已為北海沿岸的三個浮式液化天然氣(FLNG)項目獲得了15年的供應配額,以降低其國內對進口的依賴。歐洲承購方接受目的地條款標誌著結構性轉變,有利於浮體式液化天然氣(FLNG)市場的長期發展。所有資產現在都必須獲得IEC 62443網路安全認證,從而消除了新進入者的技術障礙。
高額資本支出和資金籌措風險
由於腐蝕問題導致返工,Prelude計畫的最終成本達到170億美元,是最初預算的兩倍。由於莫三比克液化天然氣計畫在2021年停產,230億美元的投資資金被鎖定,因此,貸款機構對鄰近的、沒有政府擔保的浮式液化天然氣(FLNG)計畫持謹慎態度。商業銀行目前要求負債權益比為1.4,這只有透過與布蘭特原油價格高於每桶60美元的長期石油掛鉤合約才能實現。到了2025年,日本和韓國的出口信貸機構提供68億美元的擔保,但評級低於BB的主權國家被排除在外,導致40%的前沿項目不符合擔保條件。雖然收費合約可以降低業主的價格風險,但如果蘊藏量低於預期,業主將面臨生產風險,這將給浮體式液化天然氣(FLNG)市場的現金流帶來壓力。
細分市場分析
到2025年,年處理量超過300萬噸的大型平台將佔據浮體式浮體式天然氣(FLNG)市場56.2%的佔有率。其強大的處理能力使得船體折舊成本能夠分攤到更大的貨物運輸中,從而鞏固了大型公司在FLNG市場談判長期合約時所享有的規模經濟優勢。 Prelude、PFLNG Dua和Coral Sul這三座平台到2025年的總合吞吐量將達到1,170萬噸,在亞洲市場比亨利樞紐定價高出每百萬英熱單位0.80美元。然而,隨著天然氣田的枯竭,高昂的資本成本和長期租約的限制正促使人們對規模較小、更容易轉移的平台產生更大的興趣。 Gollar 的翻新機型透過改造中期船齡的裝運船隻來實現這種柔軟性,將建造時間縮短至 38 個月,並透過為營運商提供根據不斷變化的區域需求趨勢重新部署到新的天然氣樞紐的選擇,增強了浮體式液化天然氣 (FLNG) 市場的韌性。
年處理能力在100萬至300萬噸之間的中型設施正在不斷擴建,利用升降式鑽機可在200米水深進行維護,從而降低22%的海上人事費用。年處理量低於100萬噸的小規模設施則專注於新興的電子甲醇燃料庫和島嶼電網建設。現代重工的標準設計年處理量為60萬噸,造價4.8億美元,比客製化的巨型船舶每噸成本低40%。目前,船級社強制要求年處理能力超過250萬噸的設施採用雙燃料推進系統,這將額外增加1.8億美元的成本,但歐盟分類法允許資金籌措。隨著數位雙胞胎最佳化生產運作,浮體式液化天然氣 (FLNG) 市場中設施容量的選擇正從單純基於規模經濟的決策轉向考慮投資組合風險的計算,從而平衡運轉率、重新部署靈活性和合規成本。
區域分析
2025年,北美佔全球整體營收的33.9%。這主要得益於美國墨西哥灣沿岸的生產商利用亨利樞紐天然氣價格優勢,該價格比亞洲現貨價格指數低3.20美元,從而能夠以具有競爭力的成本向東京交付天然氣。新堡壘能源公司的「快速液化天然氣」計畫在運作的第一年裝載140萬噸天然氣,並計劃將該設計進一步推廣到墨西哥灣沿岸的三個平台上。不列顛哥倫比亞省於2026年1月提案的一項計劃旨在根據一份為期15年、與JKM指數掛鉤的契約,將Montney頁岩氣輸送至日本。墨西哥正在考慮在坎佩切灣引入一套近岸裝置來液化聯產氣,以減少天然氣燃燒(天然氣排放),2024年墨西哥的伴生氣排放量達到了180億立方米。
亞太地區是成長最快的浮體式液化天然氣(FLNG)市場,預計到2031年將以每年11.3%的速度成長。澳洲、印尼和馬來西亞已批准在2025年實現年產780萬噸的產能。伍德賽德公司的布勞斯FLNG計畫計畫在2029年前部署一個年產能350萬噸的平台。此前,由於當地反對,其最初的陸上計劃擱淺。印尼已在納土納和馬塞拉油田頒發了四張FLNG許可證,以滿足其群島分散的電力需求。馬來西亞正在建造其第三座浮式液化天然氣平台(PFLNG),預計透過模組化設計,每噸資本支出成本將降低18%。印度石油天然氣公司(ONGC)正在為克里希納-戈達瓦里盆地設計一艘年處理能力為180萬噸的船舶,旨在取代目前以每百萬英熱單位12美元價格交易的現貨進口天然氣。
儘管歐洲的佔有率仍然小規模,但浮體式再氣化樞紐具有重要的戰略意義,因為它們可以填補俄羅斯管道供應的缺口。英國國家電網公司已授予三個北海沿岸項目15年期契約,這些項目旨在液化英國國內天然氣,並於2029年前將其出口到歐洲大陸的買家。德國的四艘浮動再氣化裝置(FSRU)作為季節性雙向樞紐運行,並在淡季向波蘭和捷克共和國出口天然氣。小規模液化天然氣裝置(FLNG)正在北歐港口進行試點,用於電子甲醇燃料庫,挪威計劃建造一座年處理能力為80萬噸的設施。根據修訂後的歐盟天然氣指令,西班牙和法國在2025年3月實現了浮體式營運商平等接入互聯互通,從而擴大了套利機會。制裁導致俄羅斯計劃建造的兩座北極浮式液化天然氣裝置延期,每年660萬噸的天然氣供應將推遲到2028年或更晚。
其他好處:
- Excel格式的市場預測(ME)表
- 3個月的分析師支持
目錄
第1章:引言
- 研究假設和市場定義
- 調查範圍
第2章:調查方法
第3章執行摘要
第4章 市場狀況
- 市場概覽
- 市場促進因素
- 亞洲天然氣需求激增,原因是煤炭轉向天然氣。
- 與俄羅斯衝突後歐洲為保障能源安全所做的努力
- 浮動液化天然氣和陸上液化天然氣之間的成本競爭
- 縮短海上天然氣田的上市時間,這些天然氣田的開發已經停滯不前。
- 人工智慧和資料中心推動沿海液化天然氣發電需求
- 用於船用電甲醇燃料的小規模浮式液化天然氣
- 市場限制因素
- 高資本投資和資金籌措風險狀況
- 液化天然氣價格週期的波動導致最終投資決定(FID)推遲。
- 加強對浮體式資產甲烷外洩的監管
- 低溫模組製造業技術純熟勞工短缺
- 供應鏈分析
- 監理情勢
- 技術展望
- 波特五力模型
- 投資和項目分析
- 大型浮式液化天然氣計畫-運作中
- 大型浮式液化天然氣計畫 - 建設中
- 大型浮式液化天然氣專案-規劃中/已公佈
- 專案經濟性和可行性
- 合資企業和夥伴關係
第5章 市場規模與成長預測
- 按產能
- 小規模(小於100萬噸/年)
- 中等規模(1-3 百萬噸/年)
- 大型(300萬噸/年或以上)
- 按安裝類型
- 離岸
- 近岸
- 透過使用
- 液化
- 再氣化
- 倉儲和運輸
- 按地區
- 北美洲
- 美國
- 加拿大
- 墨西哥
- 歐洲
- 英國
- 德國
- 法國
- 西班牙
- 北歐國家
- 俄羅斯
- 其他歐洲國家
- 亞太地區
- 中國
- 印度
- 日本
- 韓國
- 東南亞國協
- 澳洲和紐西蘭
- 其他亞太國家
- 南美洲
- 巴西
- 阿根廷
- 哥倫比亞
- 其他南美國家
- 中東和非洲
- 阿拉伯聯合大公國
- 沙烏地阿拉伯
- 南非
- 埃及
- 其他中東和非洲國家
- 北美洲
第6章 競爭情勢
- 市場集中度
- 策略趨勢(併購、聯盟、購電協議)
- 市場佔有率分析(主要公司的市場排名和佔有率)
- 公司簡介
- Shell
- Petronas
- Golar LNG
- ExxonMobil
- Eni SpA
- Hoegh LNG
- Technip Energies
- Samsung Heavy Industries
- Hyundai Heavy Industries
- KBR
- JGC Corporation
- SBM Offshore
- BW Offshore
- MODEC
- TotalEnergies
- Chevron
- BP
- Mitsui OSK Lines
- New Fortress Energy
- Delfin Midstream
- Karoon Energy
- ENH Mozambique
第7章 市場機會與未來展望
According to Mordor Intelligence, the floating liquefied natural gas market size is projected to be USD 25.57 billion in 2025, USD 28.20 billion in 2026, and reach USD 44.72 billion by 2031, growing at a CAGR of 9.66% from 2026 to 2031.
This report is Segmented by Capacity (Small-Scale, Medium-Scale, and Large-Scale), Deployment Type (Offshore and Near-Shore), Application (Liquefaction, Regasification, and Storage and Transportation), and Geography (North America, Europe, Asia-Pacific, South America, and Middle East and Africa). The Market Sizes and Forecasts are Provided in Terms of Value (USD).
Global Floating Liquefied Natural Gas Market Trends and Insights
Gas-Demand Surge from Coal-to-Gas Switching in Asia
Natural-gas consumption in Asia is projected to rise 5% annually through 2030, creating an outsized call on flexible LNG supply. FLNG units offer Asian buyers strategic diversification beyond pipelines and long-haul cargoes by delivering gas directly from offshore sources to shore without extensive onshore terminals. Their mobility allows re-deployment to new demand nodes as industrial clusters migrate inland. Smaller Asian economies also favor FLNG when conventional import terminals face financing obstacles or land-use opposition, making floating infrastructure a bridge toward lower-emission energy targets. Large-scale deployments near China's eastern seaboard are complemented by modular units in the Philippines and Vietnam, where grid stability needs quick-turn LNG. The region's importers are set to absorb 70% of incremental global LNG by 2030, solidifying Asia's influence over FLNG market dynamics.
European Energy-Security Push Post-Russia Conflict
European LNG imports climbed to 143 bcm in 2025 on the REPowerEU requirement for 90 days of winter coverage. Germany commissioned four FSRUs that now liquefy and re-export excess volumes, letting buyers across Poland and the Czech Republic tap floating capacity without new pipelines. National Grid UK is locked in a fifteen-year capacity for three North Sea nearshore FLNG projects to reverse domestic import reliance. Destination-clause acceptance by European offtakers signals a structural shift that underpins the Floating Liquefied Natural Gas market's long-term visibility. All assets must now pass IEC 62443 cybersecurity certification, lifting technical barriers to entry for new contractors.
High CAPEX And Financing Risk Profile
Prelude's final bill reached USD 17 billion, double its sanction estimate, after corrosion issues forced re-work. Mozambique LNG's 2021 suspension stranded USD 23 billion, making lenders wary of adjacent FLNG without sovereign guarantees. Commercial banks now demand 1.4X debt-service coverage, achievable only with long-term oil-linked contracts above USD 60 Brent. Japanese and Korean export-credit agencies supplied USD 6.8 billion of guarantees in 2025, but sub-BB-sovereigns were ineligible, excluding 40% of frontier prospects. Tolling agreements curb price risk for owners yet expose them to volume risk if reservoirs underperform, pressuring cash flows in the Floating Liquefied Natural Gas market.
Other drivers and restraints analyzed in the detailed report include:
- Cost Competitiveness of FLNG versus On-Shore LNG
- Faster Time-to-Market for Stranded Offshore Gas Fields
- LNG Price-Cycle Volatility Delaying FIDs
For complete list of drivers and restraints, kindly check the Table Of Contents.
Segment Analysis
Large-scale platforms above 3 million tpa secured 56.2% of the Floating Liquefied Natural Gas market share in 2025. High throughput spreads hull amortization across more cargoes, anchoring the Floating Liquefied Natural Gas market size advantage that majors wield when negotiating long-term contracts. Prelude, PFLNG Dua, and Coral Sul together loaded 11.7 million tonnes in 2025, capturing Asian premiums of USD 0.80 /MMBtu over Henry Hub-linked supply. Yet the steep capital bill and charter lock-ins spur interest in medium-scale units that can relocate as reservoirs deplete. Golar's conversion model delivers such flexibility by repurposing mid-life carriers, slicing build time to 38 months, and offering operators an option to redeploy toward fresh gas hubs as regional demand pivots, strengthening the resilience of the Floating Liquefied Natural Gas market.
Medium-scale assets between 1 and 3 million tpa are expanding, where 200-meter depths let jack-up rigs perform maintenance, trimming offshore labor by 22%. Small-scale units under 1 million tpa cater to emerging e-methanol bunkering and island grids. Hyundai's 0.6-million-tpa standard design costs USD 480 million, 40% cheaper per tonne than custom mega-hulls. Classification societies now require dual-fuel propulsion on units above 2.5 million tpa, adding USD 180 million but unlocking EU Taxonomy financing. As digital twins optimize production uptime, capacity choice is shifting from a pure economies-of-scale decision toward a portfolio-risk calculus that balances utilization, redeployment agility, and compliance costs within the Floating Liquefied Natural Gas market.
Geography Analysis
North America anchored 33.9% of global revenue in 2025 as U.S. Gulf Coast producers leveraged Henry Hub feedgas priced USD 3.20 below Asian spot benchmarks, underpinning competitive delivered costs to Tokyo. New Fortress Energy's Fast LNG loaded 1.4 million t in its first full year and aims to replicate the design for three more Gulf platforms. A January 2026 British Columbia proposal seeks to ship Montney shale gas to Japan under 15-year JKM-indexed deals. Mexico is weighing nearshore units to liquefy associated gas in the Bay of Campeche, cutting flaring that hit 18 bcm in 2024.
Asia-Pacific is the fastest-growing Floating Liquefied Natural Gas market, expanding at 11.3% through 2031, with Australia, Indonesia, and Malaysia sanctioning 7.8 million tpa in 2025. Woodside's Browse FLNG will deploy a 3.5-million-tpa platform by 2029 after land opposition stalled the original onshore plan. Indonesia granted four FLNG licenses across the Natuna and Masela fields to serve its archipelago's dispersed power demand. Malaysia is constructing a third PFLNG that expects an 18% capex-per-tonne saving through modularization. India's ONGC is engineering a 1.8-million-tpa vessel for the Krishna-Godavari Basin to displace spot cargo imports priced at USD 12 /MMBtu.
Europe's share remains modest yet strategically important as floating regas hubs backfill Russian pipeline deficits. National Grid UK awarded 15-year contracts to three North Sea nearshore projects that will liquefy domestic gas for export to continental buyers by 2029. Germany's quartet of FSRUs functions as seasonal bidirectional hubs, exporting to Poland and the Czech Republic during shoulder months. Nordic ports are piloting small-scale FLNG for e-methanol bunkering, with a 0.8-million-tpa unit slated for Norway. Spain and France unlocked interconnector access parity for floating operators in March 2025 under the revised EU Gas Directive, widening arbitrage prospects. Sanctions continue to delay Russia's two planned Arctic FLNG units, deferring 6.6 million tpa until after 2028.
- Shell
- Petronas
- Golar LNG
- ExxonMobil
- Eni SpA
- Hoegh LNG
- Technip Energies
- Samsung Heavy Industries
- Hyundai Heavy Industries
- KBR
- JGC Corporation
- SBM Offshore
- BW Offshore
- MODEC
- TotalEnergies
- Chevron
- BP
- Mitsui OSK Lines
- New Fortress Energy
- Delfin Midstream
- Karoon Energy
- ENH Mozambique
Additional Benefits:
- The market estimate (ME) sheet in Excel format
- 3 months of analyst support
TABLE OF CONTENTS
1 Introduction
- 1.1 Study Assumptions & Market Definition
- 1.2 Scope of the Study
2 Research Methodology
3 Executive Summary
4 Market Landscape
- 4.1 Market Overview
- 4.2 Market Drivers
- 4.2.1 Gas-demand surge from coal-to-gas switching in Asia
- 4.2.2 European energy-security push post-Russia conflict
- 4.2.3 Cost competitiveness of FLNG versus on-shore LNG
- 4.2.4 Faster time-to-market for stranded offshore gas fields
- 4.2.5 AI & data-center induced coastal LNG power demand
- 4.2.6 Small-scale FLNG for e-methanol shipping fuels
- 4.3 Market Restraints
- 4.3.1 High CAPEX & financing risk profile
- 4.3.2 LNG price-cycle volatility delaying FIDs
- 4.3.3 Tightening methane-slip regulation on floating assets
- 4.3.4 Skilled-labour shortages in cryogenic module yards
- 4.4 Supply-Chain Analysis
- 4.5 Regulatory Landscape
- 4.6 Technological Outlook
- 4.7 Porters Five Forces
- 4.7.1 Threat of New Entrants
- 4.7.2 Bargaining Power of Suppliers
- 4.7.3 Bargaining Power of Buyers
- 4.7.4 Threat of Substitutes
- 4.7.5 Competitive Rivalry
- 4.8 Investment & Project Analysis
- 4.8.1 Key FLNG Projects - Operational
- 4.8.2 Key FLNG Projects - Under Construction
- 4.8.3 Key FLNG Projects - Planned / Announced
- 4.8.4 Project Economics & Feasibility
- 4.8.5 Joint-Ventures & Partnerships
5 Market Size & Growth Forecasts
- 5.1 By Capacity
- 5.1.1 Small-Scale (Below 1 MTPA)
- 5.1.2 Medium-Scale (1 to 3 MTPA)
- 5.1.3 Large-Scale (Above 3 MTPA)
- 5.2 By Deployment Type
- 5.2.1 Offshore
- 5.2.2 Near-shore
- 5.3 By Application
- 5.3.1 Liquefaction
- 5.3.2 Regasification
- 5.3.3 Storage and Transportation
- 5.4 By Geography
- 5.4.1 North America
- 5.4.1.1 United States
- 5.4.1.2 Canada
- 5.4.1.3 Mexico
- 5.4.2 Europe
- 5.4.2.1 United Kingdom
- 5.4.2.2 Germany
- 5.4.2.3 France
- 5.4.2.4 Spain
- 5.4.2.5 Nordic Countries
- 5.4.2.6 Russia
- 5.4.2.7 Rest of Europe
- 5.4.3 Asia-Pacific
- 5.4.3.1 China
- 5.4.3.2 India
- 5.4.3.3 Japan
- 5.4.3.4 South Korea
- 5.4.3.5 ASEAN Countries
- 5.4.3.6 Australia and New Zealand
- 5.4.3.7 Rest of Asia-Pacific
- 5.4.4 South America
- 5.4.4.1 Brazil
- 5.4.4.2 Argentina
- 5.4.4.3 Colombia
- 5.4.4.4 Rest of South America
- 5.4.5 Middle East and Africa
- 5.4.5.1 United Arab Emirates
- 5.4.5.2 Saudi Arabia
- 5.4.5.3 South Africa
- 5.4.5.4 Egypt
- 5.4.5.5 Rest of Middle East and Africa
- 5.4.1 North America
6 Competitive Landscape
- 6.1 Market Concentration
- 6.2 Strategic Moves (M&A, Partnerships, PPAs)
- 6.3 Market Share Analysis (Market Rank/Share for key companies)
- 6.4 Company Profiles (includes Global level Overview, Market level overview, Core Segments, Financials as available, Strategic Information, Products & Services, and Recent Developments)
- 6.4.1 Shell
- 6.4.2 Petronas
- 6.4.3 Golar LNG
- 6.4.4 ExxonMobil
- 6.4.5 Eni SpA
- 6.4.6 Hoegh LNG
- 6.4.7 Technip Energies
- 6.4.8 Samsung Heavy Industries
- 6.4.9 Hyundai Heavy Industries
- 6.4.10 KBR
- 6.4.11 JGC Corporation
- 6.4.12 SBM Offshore
- 6.4.13 BW Offshore
- 6.4.14 MODEC
- 6.4.15 TotalEnergies
- 6.4.16 Chevron
- 6.4.17 BP
- 6.4.18 Mitsui OSK Lines
- 6.4.19 New Fortress Energy
- 6.4.20 Delfin Midstream
- 6.4.21 Karoon Energy
- 6.4.22 ENH Mozambique
7 Market Opportunities & Future Outlook
- 7.1 White-space & Unmet-Need Assessment
 浮體式儲存再氣化裝置(FSRU)市場規模、佔有率和成長分析:按類型、結構、儲存能力、再氣化能力、錨碇系統、應用、最終用戶和地區分類-2026-2033年產業預測
 浮體式液化天然氣(LNG)接收站市場規模、佔有率和趨勢分析報告:按接收站類型、應用、地區和細分市場預測(2026-2033 年)
 2026-2030年全球浮體式儲存再氣化裝置(FSRU)市場
 浮體式儲存再氣化裝置市場:按組件、船舶類型、容量、設計類型、運作方式和最終用戶產業分類-2026-2032年全球市場預測浮體式液化天然氣(FLNG)市場:按儲存系統、船舶類型、技術、儲存容量、運作狀態、應用和最終用戶分類-2026-2032年全球市場預測
 浮體式液化天然氣(FLNG)市場-全球產業規模、佔有率、趨勢、機會、預測:按技術、最終用戶、地區和競爭對手分類,2021-2031年浮體式天然氣發電廠市場(按組件、船舶類型、額定功率、技術和最終用戶)—2025-2030 年全球預測液化天然氣站市場(按分銷類型、功能、類型、終端類型、儲存容量和最終用途)—2025-2030 年全球預測FSRU 市場 - 全球產業規模、佔有率、趨勢、機會及預測(按供熱、應用、地區和競爭細分,2020-2030 年)
 全球液化天然氣站市場(至2030年):按解決方案、站類型、應用、容量和地區分類