


 |
市場調查報告書
商品編碼
2073515
行動裝置用MEMS:市佔率分析、產業趨勢與統計及成長預測(2026-2031年)MEMS For Mobile Devices - Market Share Analysis, Industry Trends & Statistics, Growth Forecasts (2026 - 2031) |
||||||

※ 本網頁內容可能與最新版本有所差異。詳細情況請與我們聯繫。
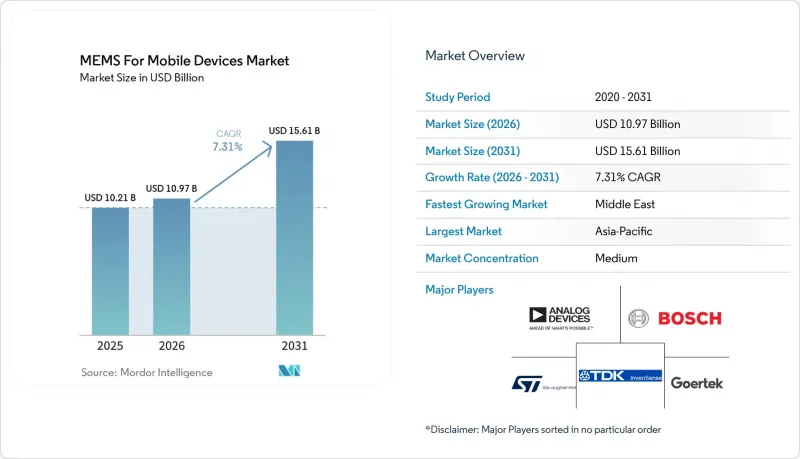
根據 Mordor Intelligence 預測,行動裝置用 MEMS 的市場規模預計將從 2025 年的 102.1 億美元和 2026 年的 109.7 億美元成長到 2031 年的 156.1 億美元,2026 年至 2031 年的年複合成長率(CAGR)率為 7.3%。
本報告按感測器類型(指紋感測器、加速計、陀螺儀、壓力感測器、體聲波感測器、麥克風等)、行動裝置類型(智慧型手機、平板電腦、穿戴式裝置、遊戲機等)、製造技術(表面封裝、體矽封裝、SOI封裝、CMOS-MEMS封裝等)、整合式方法(SiP3封裝、SoC、D端封裝、D端元件、D端元件、SoC)細分。市場預測以美元(USD)為單位。
全球行動裝置MEMS技術趨勢與洞察
5G和超寬頻(UWB)連接的廣泛應用
毫米波無線電需要插入損耗小於1.5 dB、溫度係數小於25 ppm/ 度C的體聲波(BAW)濾波器,而壓電薄膜共振器在大規模生產中即可滿足這些閾值。高通驍龍8 Elite整合了超寬頻協處理器,可將功耗降低40%,從而實現厘米級室內定位,為擴增實境(AR)服務提供支援。這些架構依賴MEMS時序基準,可提供低於-160 dBc/Hz(1 MHz偏移)的相位雜訊基底,這是同等尺寸的石英元件無法達到的指標。近期歐洲3.4-3.8 GHz頻段的頻率競標引發了行動電話更換潮,因為傳統的4G濾波器無法抑制高密度小區的鄰道干擾。 5G和超寬頻技術的整合也催生了跨平台應用,例如基於智慧型手機的汽車免鑰出入控管系統。因此,行動裝置的 MEMS 市場直接受益於全球新推出的中波和毫米波服務。
MEMS技術在折疊式和可捲曲顯示器中的應用正在不斷推進。
這種軟性外形規格能夠承受半徑小於 5 毫米的 10 萬次以上彎曲,因此需要將感測器放置在顯示器內部,而不是剛性基板上。三星的「感測器 OLED」在每個像素下方嵌入有機光電二極體,用於擷取指紋和心率數據,從而將螢幕佔比提升至 95% 以上。京東方 (BOE) 於 2024 年第三季交付了首款內建壓力感測器的捲繞式 OLED 面板,實現了能夠區分點擊和手掌接觸的互動介面。此類設計需要採用與聚醯亞胺相容的 MEMS 工藝,且工藝溫度低於 250 度C,且薄膜壓電材料優於絕緣體上矽 (SOI) 材料,從而拓展了移動設備 MEMS 市場的材料選擇範圍。面板製造商正在獲取原本屬於獨立感測器供應商的附加價值,迫使傳統供應商專注於超薄晶片鍵合和雷射剝離服務。
晶圓層次電子構裝。
晶圓級封裝雖然降低了單位成本,但會導致空腔洩漏、顆粒污染和應力誘導裂紋等問題,這些問題在測試前難以篩檢。在大批量行動產品專案中,現場退貨率可能超過 500 ppm。根據 ECTC 2024 的一篇論文,60% 的故障是由於穿透矽通孔(TSV) 曝光過程中產生的微裂紋造成的。博世報告稱,由於氣密性問題,其陀螺儀晶圓中有 8% 被報廢,導致 2025 年毛利率下降了 300 個基點。新型測量工具可以檢測亞表面空隙,但每條線會增加 200 萬至 500 萬美元的成本,並使檢測速度降低 30%。扇出型封裝可以降低應力,但其在 MEMS 產量中的應用率仍低於 10%,預計其對行動裝置 MEMS 市場的負面影響將持續存在。
細分市場分析
到2025年,指紋辨識單元將佔總收入的35.21%,憑藉第二代超音波解決方案(即使在手指潮濕的情況下也能在0.3秒內完成識別),佔據行動裝置MEMS市場的最大佔有率。體聲波(BAW)感測器雖然規模較小,但正以每年9.32%的速度成長,因為目前的5G旗艦設備整合了多達60個頻率範圍從600 MHz到41 GHz的濾波器。加速計和陀螺儀合計約佔總出貨量的四分之一,主要得益於遊戲、光學防防手震和室內導航等應用。壓力感測器約佔8%,而隨著空間音訊和降噪功能成為高階設備的標配,MEMS麥克風的市佔率已成長至18%。環境感測器、磁力計、濕度感測器和氣體探測器佔據了剩餘的市場佔有率,在空氣污染敏感地區,這些感測器的需求正在不斷成長。
體聲共振器也在精密計時領域取得進展,支援高品質因數和低於-160 dBc/Hz相位雜訊的振盪器,取代了Wi-Fi 7路由器中的石英共振器。指紋認證供應商正在試驗血流檢測技術,該技術無需額外光學裝置即可實現連續心率追蹤,這表明感測方法正在進一步融合。這種互通性正在提升行動裝置MEMS市場的出貨量成長前景,並維持其價格穩定。
預計到2025年,智慧型手機將佔總需求的66.41%,這反映了其無可比擬的規模。同時,穿戴式裝置預計將以7.52%的複合年成長率成長,這主要得益於獲得FDA批准的健康功能以及能夠以256赫茲採樣率採集運動數據用於房顫篩檢的智慧型手錶。平板電腦佔出貨量的12%,其壓感筆功能拓展了創新應用場景。行動遊戲設備約佔5%,其餘部分則由其他電子產品、電子閱讀器和AR眼鏡構成。
歌爾科技的常開式語音拾音器功耗低於200µA,可應用於智慧眼鏡和耳機,充分展現了微型化如何提升不同應用領域的設計彈性。平板電腦繼續配備4096級壓力感測器,而手持終端機遊戲機則整合了4000°/s陀螺儀。隨著智慧型手機整合穿戴級健康監測功能,穿戴式裝置也具備蜂巢式網路連線能力,平台邊界日漸模糊,行動裝置MEMS市場跨品類協同效應不斷增強。
區域分析
受中國薄膜沉積規模、韓國CMOS-MEMS共整合以及台灣代工廠對全球無晶圓廠供應的支援等因素驅動,亞太地區預計到2025年將佔全球MEMS銷售額的46.82%。北京市政府計畫投入30億美元補貼,旨在2027年將國內MEMS晶圓產能提高40%。同時,日本村田製作所和TDK憑藉其陶瓷封裝技術,佔據了全球MEMS麥克風出貨量的30%以上。三星馬達正在進行厚度小於0.6毫米的扇出型晶圓級封裝試驗計畫。印度塔塔電子正在建造一座300毫米晶圓廠,並計劃從2026年第四季起將其五分之一的產能用於MEMS產品,從而增強該地區的MEMS自主性。
預計到2025年,北美市場將佔全球MEMS銷售額的約24%。美國在無晶圓廠設計領域處於領先地位,穿戴式裝置相繼獲得FDA批准,推動了醫療MEMS的應用。加拿大已累計5000萬加元用於培訓500名MEMS工程師,而墨西哥新興的封裝技術正服務汽車和工業客戶。歐洲市佔率為18%。英飛凌和博世在本地生產方面處於主導,《人工智慧法案》正在將設備端處理技術確立為歐洲的標準。因此,在行動裝置MEMS市場,歐洲和美國有監管方面的需求,而亞洲則有大規模生產的需求。
中東地區目前成長處於個位數中段,但隨著海灣國家主權財富基金資助本地化供應鏈的組裝線,該地區正經歷8.36%的年成長率。土耳其正在吸引對測試和封裝領域的投資,以連接歐洲和亞洲。非洲和南美洲合計市佔率仍不足10%,但受智慧型手機普及率上升的推動,其成長率已達兩位數。巴西和奈及利亞的組裝製造商正在整合多感測器陣列,以透過攝影機防手震和生物識別安全等功能來提升產品差異化。因此,區域分散化正在降低地緣政治供應鏈風險,並擴大行動裝置MEMS市場的整體規模。
其他好處:
- Excel格式的市場預測(ME)表
- 3個月的分析師支持
目錄
第1章:引言
- 研究假設和市場定義
- 調查範圍
第2章:調查方法
第3章執行摘要
第4章 市場狀況
- 市場概覽
- 市場促進因素
- 5G和超寬頻通訊的廣泛應用
- 將MEMS技術更廣泛地整合到折疊式和可捲曲顯示器中
- 人工智慧邊緣處理領域對低功耗、始終運作感測器的需求
- 智慧型手機聲學變焦和空間音訊標準化
- 行動醫療和環境感測應用的激增
- CMOS相容於MEMS代工生態系的擴展
- 市場限制因素
- 晶圓層次電子構裝。
- 缺乏合格的MEMS設計工程師
- 知識產權細分領域包括運動、壓力和聲學微機電系統(MEMS)。
- 特種壓電材料供應鏈的集中化
- 產業價值鏈分析
- 監理情勢
- 技術展望
- 波特五力分析
第5章 市場規模與成長預測
- 依感測器類型
- 指紋感應器
- 加速計
- 陀螺儀
- 壓力感測器
- 體聲波(BAW)感測器
- 麥克風
- 其他感測器類型
- 依行動裝置類型
- 智慧型手機
- 藥片
- 穿戴式裝置
- 行動遊戲裝置
- 其他行動裝置類型
- 透過製造技術
- 表面微機械加工
- 體微加工
- 高長寬比SOI
- CMOS-MEMS整合
- 其他製造技術
- 透過積分法
- 系統級封裝 (SiP)
- 晶片系統(SoC)
- 混合式和3D堆疊
- 分離式微機電系統
- 其他整合方法
- 按地區
- 北美洲
- 美國
- 加拿大
- 墨西哥
- 南美洲
- 巴西
- 阿根廷
- 其他南美國家
- 歐洲
- 德國
- 英國
- 法國
- 義大利
- 西班牙
- 其他歐洲國家
- 亞太地區
- 中國
- 日本
- 韓國
- 印度
- 澳洲
- 紐西蘭
- 其他亞太國家
- 中東和非洲
- 中東
- 阿拉伯聯合大公國
- 沙烏地阿拉伯
- 土耳其
- 其他中東國家
- 非洲
- 南非
- 奈及利亞
- 肯亞
- 其他非洲國家
- 中東
- 北美洲
第6章 競爭情勢
- 市場集中度
- 策略趨勢
- 市佔率分析
- 公司簡介
- STMicroelectronics NV
- Bosch Sensortec GmbH
- TDK Corporation(InvenSense)
- Goertek Inc.
- Analog Devices Inc.
- Knowles Corporation
- Murata Manufacturing Co., Ltd.
- AAC Technologies Holdings Inc.
- MEMSIC Inc.
- BSE Co., Ltd.
- Alps Alpine Co., Ltd.
- Infineon Technologies AG
- Qorvo, Inc.
- Qualcomm Technologies, Inc.
- Cirrus Logic, Inc.
- Omron Corporation
- ROHM Co., Ltd.
- SiTime Corporation
- TE Connectivity Ltd.
- Robert Bosch GmbH
第7章 市場機會與未來展望
According to Mordor Intelligence, the MEMS for mobile devices market size is projected to expand from USD 10.21 billion in 2025 and USD 10.97 billion in 2026 to USD 15.61 billion by 2031, registering a CAGR of 7.31% between 2026 to 2031.
This report is Segmented by Type of Sensor (Fingerprint, Accelerometer, Gyroscope, Pressure, BAW, Microphones, and More), Mobile Device Type (Smartphones, Tablets, Wearables, Gaming, and More), Fabrication Technology (Surface, Bulk, SOI, CMOS-MEMS, and More), Integration Method (SiP, Soc, 3D-Stacked, Discrete, and More), and Geography. The Market Forecasts are Provided in Terms of Value (USD).
Global MEMS For Mobile Devices Market Trends and Insights
Growing Adoption of 5G and Ultra-Wideband Connectivity
Millimeter-wave radios need BAW filters with insertion loss below 1.5 dB and temperature coefficients under 25 ppm/°C, thresholds that piezoelectric thin-film resonators meet at high volume. Qualcomm's Snapdragon 8 Elite integrates ultra-wideband co-processors that trim power by 40%, enabling centimeter-level indoor positioning for augmented-reality services. These architectures depend on MEMS timing references providing phase-noise floors below -160 dBc/Hz at a 1 MHz offset, a metric unattainable by similarly sized quartz parts. Europe's recent spectrum auctions in the 3.4-3.8 GHz range triggered handset replacement cycles because legacy 4G filters cannot contain adjacent-channel interference in dense cells. The convergence of 5G and ultra-wideband is also enabling cross-platform applications, such as smartphone-driven keyless entry systems for vehicles. The MEMS for mobile devices market, therefore, benefits directly from every new mid-band or millimeter-wave launch worldwide.
Rising Integration of MEMS in Foldable and Rollable Displays
Flexible form factors endure more than 100,000 bends at radii below 5 mm, forcing sensor placement inside the display stack instead of on rigid boards. Samsung's Sensor OLED embeds organic photodiodes beneath each pixel to collect fingerprint and heart-rate data, pushing screen-to-body ratios beyond 95%. BOE shipped its first rollable OLED panels with integrated pressure sensors in Q3 2024, allowing interfaces that differentiate taps from palm contact. Such designs demand polyimide-compatible MEMS processes operating below 250 °C and favor thin-film piezoelectric materials over silicon-on-insulator, widening the material toolkit used in the MEMS for mobile devices market. Panel makers are capturing value that once flowed to discrete sensor vendors, compelling traditional suppliers to specialize in ultrathin die bonding and laser lift-off services.
Yield Losses from Wafer-Level Packaging Defects
Wafer-level encapsulation lowers unit cost but introduces cavity leaks, particle contamination, and stress-induced cracks that are hard to screen prior to test; field returns can exceed 500 ppm in high-volume mobile programs. ECTC 2024 papers attribute 60% of failures to microcracks created during through-silicon-via reveal steps. Bosch reported scrapping 8% of gyroscope wafers for hermeticity issues, cutting 2025 gross margin by 300 bps. New metrology tools detect subsurface voids but add USD 2-5 million per line and slow inspection by 30%. Although fan-out packages reduce stress, adoption still covers <10% of MEMS volume, prolonging the drag on the MEMS for mobile devices market.
Other drivers and restraints analyzed in the detailed report include:
- Demand for Low-Power Always-On Sensors in AI Edge Processing
- Standardization of Acoustic Zoom and Spatial Audio in Smartphones
- Limited Availability of Qualified MEMS Design Engineers
For complete list of drivers and restraints, kindly check the Table Of Contents.
Segment Analysis
Fingerprint units accounted for 35.21% of 2025 income, securing the largest MEMS for mobile devices market share thanks to second-generation ultrasonic solutions that authenticate through wet fingers in 0.3 seconds. The bulk acoustic wave category, although smaller, is advancing at 9.32% annually because each 5G flagship now embeds up to 60 filters spanning 600 MHz to 41 GHz. Accelerometers and gyroscopes together supplied roughly one-quarter of shipments, underpinned by gaming, optical-image stabilization, and indoor navigation. Pressure sensors contributed close to 8%, while MEMS microphones captured 18% as spatial-audio and noise-cancellation became standard in premium devices. Environmental sensing, magnetometers, humidity, gas detectors. made up the remainder and is climbing in pollution-sensitive regions.
Bulk acoustic wave resonators are crossing into precision timing, where their high Q supports oscillators with phase noise below -160 dBc/Hz, displacing quartz in Wi-Fi 7 routers. Fingerprint vendors are experimenting with blood-flow detection that may add continuous heart-rate tracking without extra optics, signaling further overlap among sensing modalities. Such cross-pollination amplifies shipment growth prospects and sustains pricing discipline inside the MEMS for mobile devices market.
Smartphones absorbed 66.41% of 2025 unit demand, reflecting their unrivaled scale. Wearables, however, are forecast to post a 7.52% CAGR, buoyed by FDA-cleared health functions and by smartwatches that now sample motion at 256 Hz for atrial-fibrillation screening. Tablets represented 12% of volume as stylus-pressure sensing broadened creative use cases. Mobile gaming devices comprised roughly 5%, and other gadgets, e-readers, AR glasses filled the balance.
Goertek's sub-200 µA always-on voice pickup straddles smart-glasses and earbud categories, illustrating how miniaturization unlocks design freedom across applications. Tablets continue to adopt force sensors offering 4,096 pressure levels, while gaming handhelds specify gyroscopes rated to 4,000 °/s. As smartphones import wearable-grade health metrics and wearables inherit cellular connectivity, platform boundaries blur, amplifying cross-category leverage within the MEMS for mobile devices market.
Complete Report Scope:
- By Type of Sensor
- Fingerprint Sensor
- Accelerometer
- Gyroscope
- Pressure Sensor
- Bulk Acoustic Wave (BAW) Sensor
- Microphones
- Other Types of Sensors
- By Mobile Device Type
- Smartphones
- Tablets
- Wearable Devices
- Mobile Gaming Devices
- Other Mobile Device Types
- By Fabrication Technology
- Surface Micromachining
- Bulk Micromachining
- High Aspect Ratio SOI
- CMOS-MEMS Integration
- Other Fabrication Technologies
- By Integration Method
- System-in-Package (SiP)
- System-on-Chip (SoC)
- Hybrids and 3D-Stacked
- Discrete MEMS
- Other Integration Methods
- By Geography
- North America
- United States
- Canada
- Mexico
- South America
- Brazil
- Argentina
- Rest of South America
- Europe
- Germany
- United Kingdom
- France
- Italy
- Spain
- Rest of Europe
- Asia-Pacific
- China
- Japan
- South Korea
- India
- Australia
- New Zealand
- Rest of Asia-Pacific
- Middle East and Africa
- Middle East
- United Arab Emirates
- Saudi Arabia
- Turkey
- Rest of Middle East
- Africa
- South Africa
- Nigeria
- Kenya
- Rest of Africa
- Middle East
- North America
Geography Analysis
Asia-Pacific captured 46.82% of 2025 revenue, driven by China's thin-film deposition scale, South Korea's CMOS-MEMS co-integration, and Taiwan's foundries that anchor global fabless supply. Beijing's USD 3 billion subsidy aims to lift domestic MEMS wafer capacity 40% by 2027, and Japan's Murata plus TDK delivered over 30% of global MEMS microphone volume by exploiting ceramic-packaging prowess. Samsung Electro-Mechanics is piloting fan-out wafer-level packaging at thicknesses below 0.6 mm, while India's Tata Electronics is building a 300 mm fab that will allocate one-fifth of capacity to MEMS from Q4 2026, reinforcing regional self-sufficiency.
North America produced roughly 24% of 2025 revenue. The United States leads fabless design, and the FDA's string of wearable clearances validates medical MEMS use cases. Canada earmarked CAD 50 million to train 500 MEMS engineers, and Mexico's emerging packaging nodes serve automotive and industrial customers. Europe held 18%; Infineon and Bosch dominate local production, and the AI Act cements on-device processing as a continental norm. The MEMS for mobile devices market therefore sees regulatory pull in the West and volume pull in Asia.
The Middle East, while only mid-single digit today, is growing 8.36% annually as Gulf sovereign funds finance assembly lines that localize supply. Turkey courts test and packaging investment to act as a Europe-Asia bridge. Africa and South America collectively remain below 10% but score double-digit growth tied to rising smartphone penetration: Brazilian and Nigerian assemblers integrate multi-sensor arrays to differentiate camera stabilization and biometric security. Regional diversification thus tempers geopolitical supply-chain risks and enlarges the aggregate MEMS for mobile devices market size.
- STMicroelectronics N.V.
- Bosch Sensortec GmbH
- TDK Corporation (InvenSense)
- Goertek Inc.
- Analog Devices Inc.
- Knowles Corporation
- Murata Manufacturing Co., Ltd.
- AAC Technologies Holdings Inc.
- MEMSIC Inc.
- BSE Co., Ltd.
- Alps Alpine Co., Ltd.
- Infineon Technologies AG
- Qorvo, Inc.
- Qualcomm Technologies, Inc.
- Cirrus Logic, Inc.
- Omron Corporation
- ROHM Co., Ltd.
- SITime Corporation
- TE Connectivity Ltd.
- Robert Bosch GmbH
Additional Benefits:
- The market estimate (ME) sheet in Excel format
- 3 months of analyst support
TABLE OF CONTENTS
1 INTRODUCTION
- 1.1 Study Assumptions and Market Definition
- 1.2 Scope of the Study
2 RESEARCH METHODOLOGY
3 EXECUTIVE SUMMARY
4 MARKET LANDSCAPE
- 4.1 Market Overview
- 4.2 Market Drivers
- 4.2.1 Growing Adoption of 5G and Ultra-Wideband Connectivity
- 4.2.2 Rising Integration of MEMS in Foldable and Rollable Displays
- 4.2.3 Demand for Low-Power Always-On Sensors in AI Edge Processing
- 4.2.4 Standardization of Acoustic Zoom and Spatial Audio in Smartphones
- 4.2.5 Surge in Mobile Health and Environmental Sensing Applications
- 4.2.6 Expansion of CMOS-Compatible MEMS Foundry Ecosystem
- 4.3 Market Restraints
- 4.3.1 Yield Losses from Wafer-Level Packaging Defects
- 4.3.2 Limited Availability of Qualified MEMS Design Engineers
- 4.3.3 IP Fragmentation Across Motion, Pressure and Acoustic MEMS
- 4.3.4 Supply-Chain Concentration in Specialty Piezoelectric Materials
- 4.4 Industry Value Chain Analysis
- 4.5 Regulatory Landscape
- 4.6 Technological Outlook
- 4.7 Porter's Five Forces Analysis
- 4.7.1 Bargaining Power of Buyers
- 4.7.2 Bargaining Power of Suppliers
- 4.7.3 Threat of New Entrants
- 4.7.4 Threat of Substitutes
- 4.7.5 Competitive Rivalry
5 MARKET SIZE AND GROWTH FORECASTS (VALUE)
- 5.1 By Type of Sensor
- 5.1.1 Fingerprint Sensor
- 5.1.2 Accelerometer
- 5.1.3 Gyroscope
- 5.1.4 Pressure Sensor
- 5.1.5 Bulk Acoustic Wave (BAW) Sensor
- 5.1.6 Microphones
- 5.1.7 Other Types of Sensors
- 5.2 By Mobile Device Type
- 5.2.1 Smartphones
- 5.2.2 Tablets
- 5.2.3 Wearable Devices
- 5.2.4 Mobile Gaming Devices
- 5.2.5 Other Mobile Device Types
- 5.3 By Fabrication Technology
- 5.3.1 Surface Micromachining
- 5.3.2 Bulk Micromachining
- 5.3.3 High Aspect Ratio SOI
- 5.3.4 CMOS-MEMS Integration
- 5.3.5 Other Fabrication Technologies
- 5.4 By Integration Method
- 5.4.1 System-in-Package (SiP)
- 5.4.2 System-on-Chip (SoC)
- 5.4.3 Hybrids and 3D-Stacked
- 5.4.4 Discrete MEMS
- 5.4.5 Other Integration Methods
- 5.5 By Geography
- 5.5.1 North America
- 5.5.1.1 United States
- 5.5.1.2 Canada
- 5.5.1.3 Mexico
- 5.5.2 South America
- 5.5.2.1 Brazil
- 5.5.2.2 Argentina
- 5.5.2.3 Rest of South America
- 5.5.3 Europe
- 5.5.3.1 Germany
- 5.5.3.2 United Kingdom
- 5.5.3.3 France
- 5.5.3.4 Italy
- 5.5.3.5 Spain
- 5.5.3.6 Rest of Europe
- 5.5.4 Asia-Pacific
- 5.5.4.1 China
- 5.5.4.2 Japan
- 5.5.4.3 South Korea
- 5.5.4.4 India
- 5.5.4.5 Australia
- 5.5.4.6 New Zealand
- 5.5.4.7 Rest of Asia-Pacific
- 5.5.5 Middle East and Africa
- 5.5.5.1 Middle East
- 5.5.5.1.1 United Arab Emirates
- 5.5.5.1.2 Saudi Arabia
- 5.5.5.1.3 Turkey
- 5.5.5.1.4 Rest of Middle East
- 5.5.5.2 Africa
- 5.5.5.2.1 South Africa
- 5.5.5.2.2 Nigeria
- 5.5.5.2.3 Kenya
- 5.5.5.2.4 Rest of Africa
- 5.5.5.1 Middle East
- 5.5.1 North America
6 COMPETITIVE LANDSCAPE
- 6.1 Market Concentration
- 6.2 Strategic Moves
- 6.3 Market Share Analysis
- 6.4 Company Profiles (includes Global Level Overview, Market Level Overview, Core Segments, Financials as available, Strategic Information, Market Rank/Share, Products and Services, Recent Developments)
- 6.4.1 STMicroelectronics N.V.
- 6.4.2 Bosch Sensortec GmbH
- 6.4.3 TDK Corporation (InvenSense)
- 6.4.4 Goertek Inc.
- 6.4.5 Analog Devices Inc.
- 6.4.6 Knowles Corporation
- 6.4.7 Murata Manufacturing Co., Ltd.
- 6.4.8 AAC Technologies Holdings Inc.
- 6.4.9 MEMSIC Inc.
- 6.4.10 BSE Co., Ltd.
- 6.4.11 Alps Alpine Co., Ltd.
- 6.4.12 Infineon Technologies AG
- 6.4.13 Qorvo, Inc.
- 6.4.14 Qualcomm Technologies, Inc.
- 6.4.15 Cirrus Logic, Inc.
- 6.4.16 Omron Corporation
- 6.4.17 ROHM Co., Ltd.
- 6.4.18 SiTime Corporation
- 6.4.19 TE Connectivity Ltd.
- 6.4.20 Robert Bosch GmbH
7 MARKET OPPORTUNITIES AND FUTURE OUTLOOK
- 7.1 White-Space and Unmet-Need Assessment

 2026年全球高速光開關市場報告
 MEMS市場報告:趨勢、預測與競爭分析(至2035年)
 MEMS:市場佔有率分析、產業趨勢和統計數據、成長預測(2026-2031)
 電子機械系統(MEMS)市場:按元件類型、製造材料、最終用戶和分銷管道分類-2026-2032年全球市場預測
 微機電系統(MEMS)市場:按類型、應用和地區分類
 微機電系統 (MEMS) 市場預測至 2034 年—按裝置類型、感測器類型、材料、製造技術、應用和地區分類的全球分析
 微加工設備市場規模、佔有率、成長率、全球產業分析、區域分析及未來預測(2026-2034)微機電系統 (MEMS) 市場預測至 2034 年—按感測器類型、執行器類型、製造方法、材料、最終用戶和地區分類的全球分析MEMS矽晶圓市場報告:趨勢、預測及競爭分析(至2035年)
 MEMS冷卻系統-2026年至2034年全球市佔率及排名、總收入及需求預測