

 |
市場調查報告書
商品編碼
2073422
服務機器人:市場佔有率分析、產業趨勢與統計、成長預測(2026-2031)Service Robotics - Market Share Analysis, Industry Trends & Statistics, Growth Forecasts (2026 - 2031) |
||||||
※ 本網頁內容可能與最新版本有所差異。詳細情況請與我們聯繫。
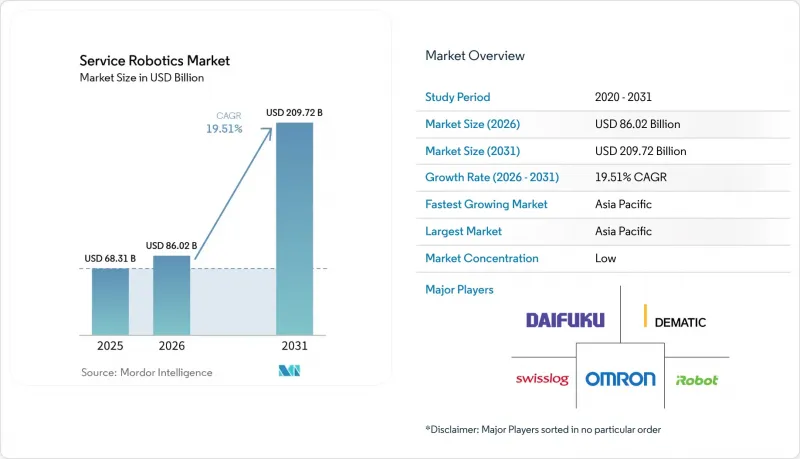
據 Mordor Intelligence 稱,2025 年服務機器人市場價值為 683.1 億美元,預計到 2031 年將達到 2097.2 億美元,而 2026 年為 860.2 億美元,預測期(2026-2031 年)的複合年成長率為 19.51%。
本報告按應用領域(商用和個人/消費)、組件(硬體、軟體、服務)、運行環境(地面、空中/無人機、其他)、移動方式(行動/自主、固定/基座)、終端用戶行業(農業、國防與安全、酒店與零售、其他)以及地區進行細分。市場預測以美元計價。
全球服務機器人市場趨勢及洞察
醫療保健、物流和農業領域對自動化的需求日益成長
到2025年,「達文西」和「雨果」系統適應症的擴展將推動醫院機器人手術量超過200萬例,從而縮短手術室週轉時間並提高手術效率。旺季期間電子商務交易量的成長將使亞馬遜的機器人數量超過75萬台,並將揀貨時間縮短至30秒以內,樹立新的生產力標竿。在農業領域,配備即時動態GPS的自動駕駛曳引機將運作時間延長至24小時,並將土地利用效率提高40%。供應商目前正在跨產業重複利用感測器,從而實現規模經濟,降低單位成本,並將引進週期從數年縮短至數月。這三大領域的綜合需求正進一步鞏固服務機器人市場的成長動能。
勞動力短缺加劇和人口老化
經合組織國家預計在2025年至2030年間將失去1,500萬個工作崗位,這將加劇對倉庫工人和護理人員的競爭。在日本,預計2030年將出現69萬名護理人員的缺口,由於政府目前承擔高達90%的輔助機器人費用,轉移和沐浴輔助設備的銷售量正在加速成長。德國公共衛生機構為每台設備提供5,000歐元(5,650美元)的補貼,從而擴大了面向普通家庭的目標市場。在美國,由於面臨190萬個工作機會的缺口,飯店正在引入送貨機器人,使員工能夠騰出精力專注於創造收入的客戶服務。因此,人口壓力是服務機器人市場持續發展的驅動力。
高資本支出(CAPEX)及維護成本
手術機器人的售價仍在150萬美元至250萬美元之間,加上每年15萬至20萬美元的維護合約費用,使得它們只能在患者數量較多的都市區醫院中使用。倉庫需要部署20至50台設備,這意味著在系統整合之前需要投入100萬至250萬美元。儘管投資回報期可能在24個月內結束,但40%的業者表示預算上限是最大的障礙。鋰離子電池需要每3至4年更換一次,每次更換成本為5000至8000美元,而且在主要城市以外的地區,熟練的技術人員仍然短缺。這些成本正在減緩價格敏感型顧客的採用速度。
細分市場分析
到2025年,商用服務機器人將佔據服務機器人市場52.44%的佔有率,反映出物流自動化和手術室領域的持續投資。物流平台仍然是最大的收入來源,因為自主移動機器人可將揀貨和包裝週期縮短50%至70%,而手術系統透過提供高利潤的一次性耗材提高了設備的生命週期價值。隨著自動曳引機延長播種季節,無人機偵察將產量預測準確率提高到90%以上,農業領域機器人正蓬勃發展。用於石油、天然氣和通訊塔的偵測設備降低了在密閉空間作業的風險,從而有助於降低保險費用。這些應用案例共同支撐著商用需求,並擴大了整個服務機器人市場。
到2025年,消費者對家用平台的接受度將持續提高,機器人吸塵器和割草機的出貨量將達到1,500萬台,儘管其收入基數仍小於商用產品。在日本和德國,保險涵蓋的老年輔助機器人的銷售量超過了休閒娛樂型機器人,因為保險最高可支付每台5,650美元。隨著承包商面臨美國職業安全與健康管理局(OSHA)對空氣污染物排放日益嚴格的監管,用於自動化拆除和混凝土澆築的建築機器人發展迅速。保安救援機器人和水下巡檢車進一步豐富了日益多元化但仍在不斷發展的消費產品系列。
2025年,硬體銷售額佔總銷售額的66.89%。這主要得益於雷射雷達和視覺晶片價格的下降,從而促進了對成本敏感的行業對這些產品的採用。多模態感測器套件和無刷直流驅動器將能源效率提高了30%,而磷酸鋰鐵鋰電池則降低了熱失控的風險。以開放原始碼ROS 2為中心的標準化將整合前置作業時間從數年縮短至數月,使供應商無需重寫客製化韌體即可擴大交付規模。儘管硬體仍然佔據主導地位,但這些進步正在逐步削弱其競爭優勢。
包括軟體、車隊管理和預測性維護在內的服務堆疊預計到2031年將以20.29%的複合年成長率成長,是所有組成部分中成長最快的。 「機器人即服務 (RaaS)」套餐使中小企業能夠以每月1500美元起的價格避免大量資本投資,訂閱模式佔Seegrid新契約的70%以上。最佳化路線規劃和電池管理的AI分析可將吞吐量提高10-15%,鞏固了軟體作為主要差異化因素的地位。在五年生命週期內,業務收益通常是初始硬體購買價格的三倍,未來的利潤來源正轉向軟體和雲端平台。
區域分析
預計到2025年,亞太地區將佔全球服務機器人銷售額的38.28%,並在2031年之前以20.57%的複合年成長率成長,成為服務機器人市場規模最大、成長最快的地區。在中國,2025年服務機器人的產量將超過50萬台,政府補貼目前正支持醫療和物流業採用這些機器人。在日本,長期照護保險可報銷老年人認證輔助設備高達90%的費用,促進了Panasonic和Softbank Corporation機器人等公司在國內的生產。韓國已啟動一項1兆韓元(約7.5億美元)的計劃,目標是在2028年前部署5萬台服務機器人。同時,在印度,電子商務履約中心正在對自主機器人車隊進行試點測試,以應對二線城市日益成長的需求。澳洲的大型農場已經開始使用無人機進行田間調查和使用自動駕駛曳引機,其中三分之一的農場已經採用了精密農業。
到2025年,北美地區的銷售額將佔全球總銷售額的約30%。美國在外科手術機器人和倉庫自動化領域的應用方面處於主導地位,國防部已在其2026會計年度預算中申請了25億美元用於無人系統。到2025年,美國聯邦航空管理局(FAA)批准的超視距飛行(BVLOS)豁免數量增加至12,000架次,這將促進基於無人機的巡檢服務的發展。在加拿大草原地區,自動收割機正被部署用於應對季節性勞動力短缺問題;在墨西哥的工廠裡,隨著近岸外包的加速發展,協作機器人也開始被引入。
到2025年,歐洲將佔據全球約25%的市場。一家德國保險公司為輔助機器人提供高達5,000歐元的補貼,汽車業正在部署移動機器人以填補120萬個工作機會的缺口。英國國家醫療服務體系(NHS)已撥款5億英鎊用於外科手術機器人,以縮短特定手術的等待時間;法國則為用於修剪葡萄和採摘水果的農業機器人提供補貼。在俄羅斯,由於制裁限制了感測器進口,市場成長正在放緩。在中東和非洲,阿拉伯聯合大公國和沙烏地阿拉伯的酒店、醫院和港口項目正在推動需求成長,而南非的礦場正在引入自動駕駛運輸車輛。在南美洲,巴西的甘蔗和大豆農場正在測試無人機和曳引機,但關稅和外匯波動限制了它們的廣泛應用。
其他好處:
- Excel格式的市場預測(ME)表
- 3個月的分析師支持
目錄
第1章:引言
- 研究假設和市場定義
- 調查範圍
第2章:調查方法
第3章執行摘要
第4章 市場狀況
- 市場概覽
- 市場促進因素
- 醫療、物流和農業領域對自動化的需求日益成長。
- 勞動力短缺加劇和人口老化
- 人工智慧和感測器的快速整合將降低機器人的總擁有成本 (TCO)。
- 機器人即服務 (RaaS) 訂閱將加速中小企業對機器人即服務 (RaaS) 的採用。
- 老年護理保險為護理機器人帶來的益處
- 暗店微型倉配的蓬勃發展需要抗菌責任 (AMR)。
- 市場限制因素
- 高昂的資本投資和維護成本
- 安全和網路安全合規方面的負擔
- 鋰電池運輸的限制限制了移動機器人的普及。
- 協調消費機器人新創企業的創業投資(VC)資金籌措
- 產業價值鏈分析
- 監理情勢
- 技術展望
- 宏觀經濟因素對市場的影響
- 波特五力分析
第5章 市場規模與成長預測
- 透過使用
- 專業的
- 野外機器人
- 商用清潔
- 檢查和維護
- 建設與拆除
- 在物流系統中
- 醫療機器人
- 救援與安保
- 防禦機器人
- 水下系統
- 動力人類體外骨骼
- 公關機器人
- 個人/家庭用途
- 家庭任務機器人
- 娛樂機器人
- 為老年人和身心障礙者提供支持
- 專業的
- 按組件
- 硬體
- 感應器
- 執行器
- 控制器和驅動器
- 電力系統
- 軟體
- 作業系統和中介軟體
- 人工智慧和分析演算法
- 服務
- 硬體
- 透過操作環境
- 地面以上
- 航空/無人機
- 水面/水下
- 透過移動性
- 移動/自動駕駛
- 獨立式/固定式
- 按最終用戶行業分類
- 醫療保健
- 物流和倉儲
- 農業
- 建設與拆除
- 國防與安全
- 飯店和零售業
- 教育與娛樂
- 按地區
- 北美洲
- 美國
- 加拿大
- 墨西哥
- 歐洲
- 德國
- 英國
- 法國
- 俄羅斯
- 其他歐洲國家
- 亞太地區
- 中國
- 日本
- 印度
- 韓國
- 澳洲
- 其他亞太國家
- 中東和非洲
- 中東
- 沙烏地阿拉伯
- 阿拉伯聯合大公國
- 其他中東國家
- 非洲
- 南非
- 埃及
- 其他非洲國家
- 中東
- 南美洲
- 巴西
- 阿根廷
- 其他南美國家
- 北美洲
第6章 競爭情勢
- 市場集中度
- 策略趨勢
- 市佔率分析
- 公司簡介
- iRobot Corporation
- Dematic Corp.
- Daifuku Co. Ltd.
- Swisslog Holding AG
- Omron Corporation
- SoftBank Robotics Group Corp.
- Pudu Robotics
- Boston Dynamics Inc.
- DJI Technology Co. Ltd.
- ABB Ltd.
- Seegrid Corporation
- Intuitive Surgical Inc.
- JBT Corporation
- SSI Schaefer AG
- Grenzebach GmbH
- Smith and Nephew plc
- Stryker Corporation
- Knightscope Inc.
- Kollmorgen Corporation
- Brokk AB
- Husqvarna AB
- Construction Robotics LLC
- Ecovacs Robotics
- Neato Robotics
- Transbotics Corporation
- Medtronic plc
- Northrop Grumman Corp.
- BAE Systems plc
- UBTECH Robotics Inc.
- SMP Robotics Systems
- Vision Robotics Corporation
- Naio Technologies SAS
第7章 市場機會與未來展望
According to Mordor Intelligence, the service robotics market size was valued at USD 68.31 billion in 2025 and is estimated to grow from USD 86.02 billion in 2026 to reach USD 209.72 billion by 2031, at a CAGR of 19.51% during the forecast period (2026-2031).
This report is Segmented by Field of Application (Professional, and Personal/Domestic), Component (Hardware, Software, Services), Operating Environment (Ground, Aerial/UAV, and More), Mobility (Mobile/Autonomous, and Stationary/Fixed-Base), End-User Industry (Agriculture, Defense and Security, Hospitality and Retail, and More), and Geography. The Market Forecasts are Provided in Terms of Value (USD).
Global Service Robotics Market Trends and Insights
Growing Demand for Automation in Healthcare, Logistics, and Agriculture
Hospitals performed more than 2 million robotic procedures in 2025 as da Vinci and Hugo systems expanded their indications, shortening operating room turnover and increasing surgical throughput. Peak-season e-commerce volumes pushed Amazon's robot fleet past 750,000 units, trimming pick times below 30 seconds and setting a new productivity benchmark. On farms, autonomous tractors equipped with real-time kinematic GPS extended operating windows to 24 hours, improving land utilization by 40%. Component vendors now reuse sensors across sectors, driving scale economies that depress unit prices and compress deployment cycles from years to months. This tri-sector pull reinforces the service robotics market's growth trajectory.
Rising Labor Shortages and Ageing Population
OECD members will lose 15 million workers between 2025 and 2030, intensifying competition for warehouse and caregiving staff. Japan projects a 690,000-worker elder-care gap by 2030 and now reimburses up to 90% of assistive robot costs, accelerating sales of transfer and bathing devices. Germany's statutory insurers offer EUR 5,000 (USD 5,650) per unit, broadening the addressable household market. In U.S. hospitality, 1.9 million vacancies prompted hotels to deploy delivery robots, freeing staff for revenue-generating guest services. Demographic pressure, therefore, acts as a durable catalyst for the service robotics market.
High CAPEX and Maintenance Costs
Surgical robots still cost USD 1.5-2.5 million, plus USD 150,000-200,000 yearly service contracts, constraining uptake to high-volume urban hospitals. Warehouses need fleets of 20-50 units, implying USD 1-2.5 million outlays before integration. 40% of operators cite budget ceilings as their top barrier, despite 24-month ROI models. Lithium-ion batteries require USD 5,000-8,000 in replacement costs every 3-4 years, and specialized technicians remain scarce outside major hubs. These costs slow diffusion in price-sensitive segments.
Other drivers and restraints analyzed in the detailed report include:
- Rapid AI-Sensor Convergence Lowers Robot TCO
- Robot-as-a-Service (RaaS) Subscriptions Unlock SME Adoption
- Safety-Cybersecurity Compliance Burden
For complete list of drivers and restraints, kindly check the Table Of Contents.
Segment Analysis
Professional service robots captured 52.44% of the service robotics market share in 2025, reflecting sustained investment in logistics automation and surgical suites. Logistics platforms remain the largest revenue pool because autonomous mobile robots cut pick-and-pack cycle times by 50-70%, while surgical systems add high-margin disposables, thereby increasing lifetime value. Field agriculture robots are gaining ground as autonomous tractors extend planting windows and drone scouts push yield-forecast accuracy past 90%. Inspection units for oil, gas, and telecom towers reduce confined-space exposure, keeping insurance premiums in check. Together, these use cases anchor professional demand and expand the overall service robotics market.
Consumer acceptance of domestic platforms also rose in 2025, as robotic vacuums and lawn mowers shipped 15 million units, yet their revenue base remains smaller than that of professional peers. Insurance-backed elder-assist robots outsell entertainment models in Japan and Germany because reimbursement covers up to USD 5,650 per device. Construction robots that automate demolition and concrete finishing grew briskly after contractors faced stricter OSHA limits on airborne contaminants. Security and rescue robots, along with underwater inspection vehicles, round out a diversified yet still emerging personal portfolio.
Hardware represented 66.89% of 2025 revenue, driven by falling lidar and vision-chip prices that widened adoption in budget-sensitive industries. Multi-modal sensor suites and brushless DC drives improved energy efficiency by up to 30%, while lithium-iron-phosphate batteries reduced the risk of thermal runaway. Standardization around open-source ROS 2 trimmed integration lead times from years to months, helping vendors scale deliveries without custom firmware rewrites. These advances keep hardware dominant but steadily less differentiated.
The services stack, including software, fleet management, and predictive maintenance, is projected to expand at a 20.29% CAGR through 2031, the fastest rate across components. Robot-as-a-service bundles let small and medium enterprises avoid large capital outlays with monthly fees starting at USD 1,500, pushing subscription penetration past 70% of Seegrid's new contracts. AI analytics that optimize path-planning and battery scheduling deliver 10-15% throughput gains, cementing software's role as the top differentiator. Over a five-year life, service revenues often triple the original hardware invoice, tilting future profit pools toward code and cloud platforms.
Complete Report Scope:
- By Field of Application
- Professional
- Field Robots
- Professional Cleaning
- Inspection and Maintenance
- Construction and Demolition
- Logistics Systems
- Medical Robots
- Rescue and Security
- Defense Robots
- Underwater Systems
- Powered Human Exoskeletons
- Public-Relation Robots
- Personal / Domestic
- Domestic Task Robots
- Entertainment Robots
- Elderly and Handicap Assistance
- Professional
- By Component
- Hardware
- Sensors
- Actuators
- Controllers and Drives
- Power Systems
- Software
- Operating Systems and Middleware
- AI and Analytics Algorithms
- Services
- Hardware
- By Operating Environment
- Ground
- Aerial / UAV
- Marine / Underwater
- By Mobility
- Mobile / Autonomous
- Stationary / Fixed-Base
- By End-User Industry
- Healthcare and Medical
- Logistics and Warehousing
- Agriculture
- Construction and Demolition
- Defense and Security
- Hospitality and Retail
- Education and Entertainment
- By Geography
- North America
- United States
- Canada
- Mexico
- Europe
- Germany
- United Kingdom
- France
- Russia
- Rest of Europe
- Asia-Pacific
- China
- Japan
- India
- South Korea
- Australia
- Rest of Asia-Pacific
- Middle East and Africa
- Middle East
- Saudi Arabia
- United Arab Emirates
- Rest of Middle East
- Africa
- South Africa
- Egypt
- Rest of Africa
- Middle East
- South America
- Brazil
- Argentina
- Rest of South America
- North America
Geography Analysis
Asia-Pacific captured 38.28% of 2025 revenue and is projected to grow at a 20.57% CAGR through 2031, making it the largest and fastest region for the service robotics market. China produced over 500,000 service robots in 2025, and government subsidies now underwrite installations in healthcare and logistics. Japan's Long-Term Care Insurance covers up to 90% of certified elder-assist devices, stimulating domestic production by Panasonic and SoftBank Robotics. South Korea launched a KRW 1 trillion (USD 750 million) program to seed 50,000 service robot deployments by 2028, while India's e-commerce fulfillment centers experiment with autonomous mobile fleets amid growing demand in tier-2 cities. Australia's broadacre farms adopt drone scouting and autonomous tractors, with one-third already using precision agriculture.
North America held roughly 30% of revenue in 2025. The United States leads surgical robot installations and warehouse automation, and the Department of Defense requested USD 2.5 billion for unmanned systems in its 2026 budget. FAA waivers for beyond-visual-line-of-sight grew to 12,000 in 2025, energizing drone inspection services. Canada's Prairie provinces deploy autonomous harvesters to counter seasonal labor gaps, and Mexican factories integrate collaborative robots as near-shoring accelerates.
Europe accounted for about 25% of the market value in 2025. Germany's insurers reimburse assistive robots up to EUR 5,000, and the automotive sector introduces mobile fleets to offset 1.2 million vacancies. The United Kingdom's NHS earmarked GBP 500 million for surgical robots to cut elective wait lists, while France subsidizes agricultural robots that prune vines and pick fruit. Russia's market growth lags due to sanctions that restrict the import of sensors. The Middle East and Africa see hotel, hospital, and port projects in the United Arab Emirates and Saudi Arabia anchoring demand, whereas South Africa's mines adopt autonomous haulage. In South America, Brazilian sugarcane and soybean farms are piloting drones and tractors, though tariffs and currency swings temper rollouts.
- iRobot Corporation
- Dematic Corp.
- Daifuku Co. Ltd.
- Swisslog Holding AG
- Omron Corporation
- SoftBank Robotics Group Corp.
- Pudu Robotics
- Boston Dynamics Inc.
- DJI Technology Co. Ltd.
- ABB Ltd.
- Seegrid Corporation
- Intuitive Surgical Inc.
- JBT Corporation
- SSI Schaefer AG
- Grenzebach GmbH
- Smith and Nephew plc
- Stryker Corporation
- Knightscope Inc.
- Kollmorgen Corporation
- Brokk AB
- Husqvarna AB
- Construction Robotics LLC
- Ecovacs Robotics
- Neato Robotics
- Transbotics Corporation
- Medtronic plc
- Northrop Grumman Corp.
- BAE Systems plc
- UBTECH Robotics Inc.
- SMP Robotics Systems
- Vision Robotics Corporation
- Naio Technologies SAS
Additional Benefits:
- The market estimate (ME) sheet in Excel format
- 3 months of analyst support
TABLE OF CONTENTS
1 INTRODUCTION
- 1.1 Study Assumptions and Market Definition
- 1.2 Scope of the Study
2 RESEARCH METHODOLOGY
3 EXECUTIVE SUMMARY
4 MARKET LANDSCAPE
- 4.1 Market Overview
- 4.2 Market Drivers
- 4.2.1 Growing Demand for Automation in Healthcare, Logistics and Agriculture
- 4.2.2 Rising Labour Shortages and Ageing Population
- 4.2.3 Rapid AI-Sensor Convergence Lowers Robot TCO
- 4.2.4 Robot-as-a-Service (RaaS) Subscriptions Unlock SME Adoption
- 4.2.5 Eldercare Insurance Reimbursements for Assistive Robots
- 4.2.6 Dark-Store Micro-Fulfilment Boom Needs AMRs
- 4.3 Market Restraints
- 4.3.1 High CAPEX and Maintenance Costs
- 4.3.2 Safety-Cybersecurity Compliance Burden
- 4.3.3 Lithium-Battery Shipping Rules Limit Mobile Robots
- 4.3.4 VC Funding Correction for Consumer-Robotics Start-ups
- 4.4 Industry Value Chain Analysis
- 4.5 Regulatory Landscape
- 4.6 Technological Outlook
- 4.7 Impact of Macroeconomic Factors on the Market
- 4.8 Porter's Five Forces Analysis
- 4.8.1 Bargaining Power of Suppliers
- 4.8.2 Bargaining Power of Consumers
- 4.8.3 Threat of New Entrants
- 4.8.4 Intensity of Competitive Rivalry
- 4.8.5 Threat of Substitutes
5 MARKET SIZE AND GROWTH FORECASTS (VALUE)
- 5.1 By Field of Application
- 5.1.1 Professional
- 5.1.1.1 Field Robots
- 5.1.1.2 Professional Cleaning
- 5.1.1.3 Inspection and Maintenance
- 5.1.1.4 Construction and Demolition
- 5.1.1.5 Logistics Systems
- 5.1.1.6 Medical Robots
- 5.1.1.7 Rescue and Security
- 5.1.1.8 Defense Robots
- 5.1.1.9 Underwater Systems
- 5.1.1.10 Powered Human Exoskeletons
- 5.1.1.11 Public-Relation Robots
- 5.1.2 Personal / Domestic
- 5.1.2.1 Domestic Task Robots
- 5.1.2.2 Entertainment Robots
- 5.1.2.3 Elderly and Handicap Assistance
- 5.1.1 Professional
- 5.2 By Component
- 5.2.1 Hardware
- 5.2.1.1 Sensors
- 5.2.1.2 Actuators
- 5.2.1.3 Controllers and Drives
- 5.2.1.4 Power Systems
- 5.2.2 Software
- 5.2.2.1 Operating Systems and Middleware
- 5.2.2.2 AI and Analytics Algorithms
- 5.2.3 Services
- 5.2.1 Hardware
- 5.3 By Operating Environment
- 5.3.1 Ground
- 5.3.2 Aerial / UAV
- 5.3.3 Marine / Underwater
- 5.4 By Mobility
- 5.4.1 Mobile / Autonomous
- 5.4.2 Stationary / Fixed-Base
- 5.5 By End-User Industry
- 5.5.1 Healthcare and Medical
- 5.5.2 Logistics and Warehousing
- 5.5.3 Agriculture
- 5.5.4 Construction and Demolition
- 5.5.5 Defense and Security
- 5.5.6 Hospitality and Retail
- 5.5.7 Education and Entertainment
- 5.6 By Geography
- 5.6.1 North America
- 5.6.1.1 United States
- 5.6.1.2 Canada
- 5.6.1.3 Mexico
- 5.6.2 Europe
- 5.6.2.1 Germany
- 5.6.2.2 United Kingdom
- 5.6.2.3 France
- 5.6.2.4 Russia
- 5.6.2.5 Rest of Europe
- 5.6.3 Asia-Pacific
- 5.6.3.1 China
- 5.6.3.2 Japan
- 5.6.3.3 India
- 5.6.3.4 South Korea
- 5.6.3.5 Australia
- 5.6.3.6 Rest of Asia-Pacific
- 5.6.4 Middle East and Africa
- 5.6.4.1 Middle East
- 5.6.4.1.1 Saudi Arabia
- 5.6.4.1.2 United Arab Emirates
- 5.6.4.1.3 Rest of Middle East
- 5.6.4.2 Africa
- 5.6.4.2.1 South Africa
- 5.6.4.2.2 Egypt
- 5.6.4.2.3 Rest of Africa
- 5.6.4.1 Middle East
- 5.6.5 South America
- 5.6.5.1 Brazil
- 5.6.5.2 Argentina
- 5.6.5.3 Rest of South America
- 5.6.1 North America
6 COMPETITIVE LANDSCAPE
- 6.1 Market Concentration
- 6.2 Strategic Moves
- 6.3 Market Share Analysis
- 6.4 Company Profiles (includes Global Level Overview, Market Level Overview, Core Segments, Financials as Available, Strategic Information, Market Rank/Share for Key Companies, Products and Services, and Recent Developments)
- 6.4.1 iRobot Corporation
- 6.4.2 Dematic Corp.
- 6.4.3 Daifuku Co. Ltd.
- 6.4.4 Swisslog Holding AG
- 6.4.5 Omron Corporation
- 6.4.6 SoftBank Robotics Group Corp.
- 6.4.7 Pudu Robotics
- 6.4.8 Boston Dynamics Inc.
- 6.4.9 DJI Technology Co. Ltd.
- 6.4.10 ABB Ltd.
- 6.4.11 Seegrid Corporation
- 6.4.12 Intuitive Surgical Inc.
- 6.4.13 JBT Corporation
- 6.4.14 SSI Schaefer AG
- 6.4.15 Grenzebach GmbH
- 6.4.16 Smith and Nephew plc
- 6.4.17 Stryker Corporation
- 6.4.18 Knightscope Inc.
- 6.4.19 Kollmorgen Corporation
- 6.4.20 Brokk AB
- 6.4.21 Husqvarna AB
- 6.4.22 Construction Robotics LLC
- 6.4.23 Ecovacs Robotics
- 6.4.24 Neato Robotics
- 6.4.25 Transbotics Corporation
- 6.4.26 Medtronic plc
- 6.4.27 Northrop Grumman Corp.
- 6.4.28 BAE Systems plc
- 6.4.29 UBTECH Robotics Inc.
- 6.4.30 SMP Robotics Systems
- 6.4.31 Vision Robotics Corporation
- 6.4.32 Naio Technologies SAS
7 MARKET OPPORTUNITIES AND FUTURE OUTLOOK
- 7.1 White-Space and Unmet-Need Assessment
 家用服務機器人:市佔率分析、產業趨勢與統計、成長預測(2026-2031)
 家用服務機器人市場預測至2034年—按產品類型、組件、技術、應用、最終用戶和地區分類的全球分析
 服務機器人市場-全球產業規模、佔有率、趨勢、機會和預測:按運行環境、應用、最終用戶、地區和競爭對手分類,2021-2031年
 服務機器人市場:按產品類型、組件類型、運輸方式和最終用戶分類 - 全球市場預測 2026–2032
 2026-2034年全球家用機器人市場規模、佔有率、趨勢和成長分析報告
 2026年航太服務機器人市場報告全球服務機器人市場規模、佔有率、趨勢和成長分析報告(2026-2034年)
 服務機器人市場分析及預測(至2035年):類型、產品類型、服務、技術、組件、應用、形式、部署形式、最終用戶、功能2026年全球服務機器人市場報告購物指南機器人市場:依產品類型、支付方式、經營模式、通路和最終用戶分類-2026-2032年全球預測