


 |
市場調查報告書
商品編碼
2073388
亞太地區人工智慧(AI)最佳化資料中心:市場佔有率分析、產業趨勢與統計及成長預測(2025-2030 年)Asia-Pacific Artificial Intelligence (AI) Optimised Data Center - Market Share Analysis, Industry Trends & Statistics, Growth Forecasts (2025 - 2030) |
||||||

※ 本網頁內容可能與最新版本有所差異。詳細情況請與我們聯繫。
根據 Mordor Intelligence 預測,亞太地區人工智慧 (AI) 最佳化資料中心市場預計到 2025 年將達到 95.9 億美元,年複合成長率為 22.69%,到 2030 年將達到 266.7 億美元。
這是該地區迄今為止五年內數位基礎設施投資規模最大的擴張。
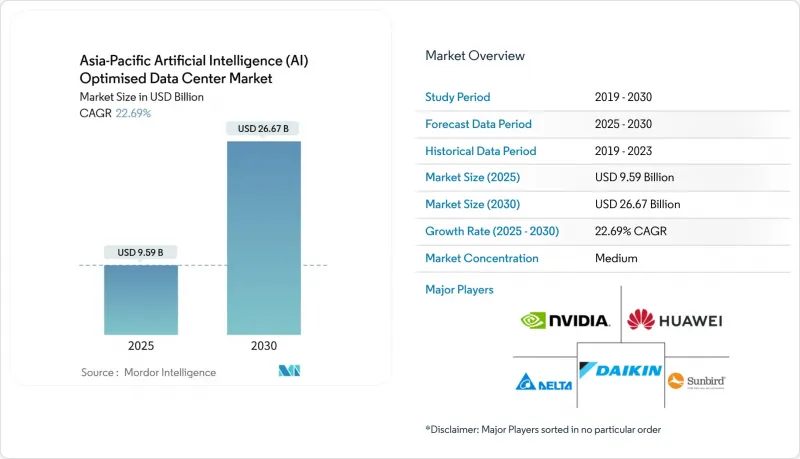
本報告按資料中心類型(雲端服務供應商、託管資料中心等)、元件(硬體、軟體技術、服務)、層級(Tier III 和 Tier IV)、最終用戶產業(IT 和 IT 服務、網際網路和數位媒體等)以及國家/地區進行細分。市場預測以美元 (USD) 為單位。
亞太地區人工智慧最佳化資料中心市場的趨勢和洞察。
政府主導的人工智慧運算補貼正在加速基礎設施建設。
韓國斥資70億美元打造人工智慧(AI)項目,旨在強化AI最佳化資料中心生態系統,其預算超出傳統基礎設施預算的4倍,其中60%的資金用於國內容量擴張,並將建設週期縮短至18個月以內。中國要求到2026年將80%的AI訓練工作負載保留在國內,這導致該地區託管預租價格居高不下,並促使企業囤積GPU庫存以規避出口限制風險。在東協地區,類似的法規已使主權雲端溢價上漲25%至30%,其中新加坡的認證設施空置率在亞洲已達到最低水準。
超大規模雲的擴張正在重塑東南亞的基礎設施。
谷歌在泰國和馬來西亞投資30億美元的計畫凸顯了這些市場相對於傳統中心城市在電網方面的優勢。同時,微軟在印尼投資17億美元建置的主權雲端區域,將在雅加達即將於2025年實施資料在地化政策之前確立其優勢。每個超大規模資料中心業者需要100兆瓦或以上的變電站容量,並且需要以分區方式使用,這使得它們能夠位置在工業園區,從而避開都市區電網的擁塞。
電力基礎設施不足限制了向二線城市的擴張。
在普納、海得拉巴和清奈,電網配額比資料中心需求低40%,導致併網等待時間超過18個月,迫使開發商採用成本高昂的可再生能源購電協議(PPA)。雖然綠色電力可以減少排放,但額外的資本投資會使專案的內部收益率(IRR)門檻提高多達300個基點。
細分市場分析
託管設施佔總支出的28.35%,但預計將以24.23%的複合年成長率成長,超過超大規模資料中心的成長速度。這主要歸功於各國政府主導的人工智慧監管政策,這些政策強制要求銀行、保險公司和政府部門進行國內機架管理。超大規模資料中心業者資料中心仍維持著55.82%的領先優勢,但隨著本地部署和邊緣節點的日益普及,其在亞太地區人工智慧資料中心市場的佔有率正在趨於穩定。擁有預配置液冷和20MW或以上變壓器模組的託管服務供應商正在獲得大規模預租協議,尤其是在新加坡和吉隆坡,因為這些地區的土地使用限制使得待開發區的規模受到限制。受日本企業集團青睞的企業級和邊緣部署透過保留GPU的實體儲存來規避出口管制風險。預計到2030年,亞太地區企業級本地部署人工智慧資料中心市場規模將超過30億美元,反映了公共雲端持續分散化的趨勢。在整個預測期內,超大規模資料中心業者的擴張預計將集中在五個電力資源豐富的走廊周圍,鞏固其在訓練工作負載中的作用,而對延遲要求較高的推理處理將卸載到邊緣託管節點。
2025年至2030年間,超大規模資料中心業者資料中心營運商的擴張計畫(微軟在日本投資29億美元,Google在東南亞當地30億美元)預計將推動該細分市場的複合年成長率(CAGR)從18.4%提升至21.8%。將海底光纜登陸權與直接GPU容量相結合的營運商將建立起相對於國內競爭對手的強大競爭優勢。同時,在亞太地區人工智慧(AI)最佳化資料中心市場,已獲得AI管治認證並提供低延遲互連架構的託管營運商繼續佔據主導地位。一旦出口限制放寬,這將使租戶能夠將私有叢集連接到超大規模GPU。
到2024年,軟體仍將佔支出的45.83%,因為模型框架、編配層和可觀測性叢集,從而推動了機架密度的極限提升。目前,營運商已將超過一半的資本支出用於冷卻迴路、母線槽和中壓開關設備,這些設備能夠處理到2025年每個機架超過40千瓦的熱負荷。
電力和冷卻在硬體支出中佔比最大。單一GPU機架的耗電量可達CPU機架的10倍,因此許多資料中心機房需要30兆伏安的電力。在日本,光是液冷系統的採購量就以每年35%的速度成長,這提升了日本在亞太地區人工智慧資料中心硬體市場的佔有率。在佔支出31.52%的服務領域,隨著客戶擴大將副本調優、梯度查核點和節能調度等工作外包,託管服務的需求正在不斷成長。同時,由於超大規模資料中心業者資料中心企業開始自主研發設計能力,而規模較小的服務供應商則依賴Schneider Electric等廠商提供的參考架構,專業服務的成長速度正在放緩。在全部區域,GPU和網路架構的供應鏈限制迫使營運商維持三個月的庫存緩衝,以確保部署的連續性,但也佔用了大量的營運資金。
其他好處:
- Excel格式的市場預測(ME)表
- 3個月的分析師支持
目錄
第1章:引言
- 研究假設和市場定義
- 調查範圍
第2章:調查方法
第3章執行摘要
第4章 市場狀況
- 市場概覽
- 市場促進因素
- 在東南亞建構超大規模雲
- 中國和韓國政府主導的人工智慧運算補貼
- 利用人工智慧對現有設施進行液冷維修
- 通訊邊緣節點產生的AI推理流量激增
- 日本大型廠商的本地部署GPU叢集
- 政府主導的人工智慧應用政策正在加速東協地區資料中心託管設施的預租協議簽訂。
- 市場限制因素
- 印度二線城市變壓器嚴重缺電
- ASIC/GPU出口限制對供應前置作業時間的影響
- 加強沿海大型設施海水取水管理條例
- 缺乏具備人工智慧最佳化能力的資料中心整合管理(DC-IM)軟體工程師
- 對永續性和碳中和能源目標的影響
- 永續能源及管理
- 可再生與不可可再生能源(綠色資料中心與人工智慧創新)
- 減少碳足跡(熱泵、區域供暖和冷氣等)
- 永續冷卻解決方案與管理
- 面向人工智慧最佳化資料中心的高效冷卻解決方案
- PUE比率、WUE比率-分析
- 永續能源及管理
- 產業生態系分析
- 監管和技術展望
- 波特五力分析
第5章 市場規模與成長預測
- 依資料中心類型
- 雲端服務供應商
- 託管設施
- 企業級/本地部署/邊緣運算
- 按組件
- 硬體
- 電力基礎設施
- 冷卻基礎設施
- 資訊科技設備
- 機架和其他硬體
- 軟體技術
- 機器學習
- 深度學習
- 自然語言處理
- 電腦視覺
- 服務
- 託管服務
- 專業服務
- 硬體
- 基於層級的標準
- Tier III
- Tier IV
- 按最終用戶行業分類
- 資訊科技與資訊科技服務
- 網路與數位媒體
- 通訊業者
- BFSI
- 醫療保健和生命科學
- 製造和工業IoT
- 政府/國防
- 國家
- 中國
- 日本
- 印度
- 馬來西亞
- 韓國
- 新加坡
- 其他亞太國家
第6章 競爭情勢
- 市場集中度
- 策略趨勢
- 市佔率分析
- 公司簡介
- Alibaba Cloud(Alibaba Group)
- Tencent Cloud
- Amazon Web Services
- Microsoft Azure
- Google Cloud
- Huawei Technologies
- NVIDIA Corp.
- Advanced Micro Devices
- Baidu Inc.
- NTT Global Data Centers
- Equinix Inc.
- Digital Realty
- STT GDC
- GDS Holdings
- Yotta Infrastructure
- AirTrunk
- OneAsia Network
- Sunbird Software
- Nlyte Software
- Schneider Electric
- Delta Electronics
- Vertiv Group
- Fuji Electric
- Daikin Industries
第7章 市場機會與未來展望
According to Mordor Intelligence, the asia-Pacific artificial intelligence data center market is valued at USD 9.59 billion in 2025 and, at a 22.69% CAGR, is forecast to reach USD 26.67 billion by 2030, underscoring the strongest five-year expansion yet seen in regional digital infrastructure spending.
This report is Segmented by Data Center Type (Cloud Service Providers, Colocation Data Centers, and More), Component (Hardware, Software Technology, and Services), Tier Standard (Tier III and Tier IV), End-User Industry (IT and IT Services, Internet and Digital Media, and More), and Country. The Market Forecasts are Provided in Terms of Value (USD).
Asia-Pacific Artificial Intelligence (AI) Optimised Data Center Market Trends and Insights
Government-backed AI compute subsidies drive infrastructure acceleration
South Korea's USD 7 billion AI program, aimed at strengthening the artificial intelligence-optimised data center ecosysyem, 400% above prior infrastructure budgets, directs 60% of funds to domestic capacity additions, compressing build timelines to less than 18 months. China's requirement that 80% of AI-training workloads remain onshore by 2026 has produced the region's highest colocation pre-lease rates and propelled GPU inventory stockpiling to hedge export-control risk. Across ASEAN, similar mandates lift sovereign-cloud premiums by 25-30%, especially in Singapore, where certified facilities already command the lowest vacancy in Asia.
Hyperscale cloud build-outs reshape Southeast Asian infrastructure
Google's USD 3 billion plan for Thailand and Malaysia confirms the power-grid advantage these markets hold over legacy hubs, while Microsoft's USD 1.7 billion Indonesian sovereign-cloud region positions the company ahead of Jakarta's 2025 data-localization deadline. Each hyperscaler requires parcel-level transformer blocks of 100 MW or more, incentivizing industrial-park locations that can bypass urban grid queues.
Power-infrastructure shortages constrain Tier-2 city expansion
In Pune, Hyderabad, and Chennai, grid allocations trail data-center demand by up to 40%, pushing connection waits beyond 18 months and forcing developers into higher-cost renewable PPA structures. Although green power softens emissions profiles, added capex inflates project IRR hurdles by as much as 300 basis points.
Other drivers and restraints analyzed in the detailed report include:
- AI-led retrofit of brownfield facilities to liquid cooling
- Surging generative-AI inference traffic at telecom edge nodes
- ASIC/GPU export controls impact supply lead-times
For complete list of drivers and restraints, kindly check the Table Of Contents.
Segment Analysis
Colocation facilities captured 28.35% of spend yet will expand at 24.23% CAGR, eclipsing hyperscale's growth as sovereign-AI rules make domestic rack control mandatory for banks, insurers, and government ministries. Hyperscalers retain a 55.82% lead, but their Asia-Pacific artificial intelligence data center market share has plateaued as on-prem and edge nodes proliferate. Colocation operators that pre-provision liquid cooling and 20+ MW transformer blocks win outsized pre-leases, particularly in Singapore and Kuala Lumpur where land caps limit greenfield scale. Enterprise and edge deployments, favored by Japanese keiretsu, absorb export-control risk by retaining physical GPU custody. The Asia-Pacific artificial intelligence data center market size tied to enterprise on-prem nodes will cross USD 3 billion by 2030, reflecting a sustained diversification away from public cloud. Over the forecast horizon, hyperscaler build-outs are expected to consolidate around five power-rich corridors, cementing their role in training workloads while offloading latency-critical inference to edge colo pods.
Across 2025-2030, hyperscaler expansion pledges, Microsoft's USD 2.9 billion in Japan and Google's USD 3 billion in mainland Southeast Asia, lift the segment's historic 18.4% CAGR to 21.8%. Providers that integrate submarine-cable landing rights with direct GPU capacity create a defensible moat against domestic competitors. Meanwhile, the Asia-Pacific artificial intelligence data center market continues to reward colocation groups that obtain AI-governance stamps and bundle low-latency interconnect fabrics, allowing tenants to stitch private clusters to hyperscale GPUs when export limits relax.
Software still commands 45.83% of 2024 spend because model frameworks, orchestration layers, and observability platforms remain foundational for AI buildout. Yet hardware, the fastest rising slice at 23.67% CAGR, is forecast to top USD 10 billion of Asia-Pacific artificial intelligence data center market size by 2030, propelled by the pivot from cloud-based experimentation to at-scale inference clusters that stress rack density thresholds. Operators now reserve more than half of 2025-capex for cooling loops, busways, and medium-voltage switchgear that can sustain thermals above 40 kW per rack.
Power and cooling swallows the largest hardware outlay; each GPU rack draws up to 10X the current of a CPU rack, pushing many halls to 30 MVA utility feeds. Liquid-cooling procurement alone is growing at 35% annually in Japan, raising the country's Asia-Pacific artificial intelligence data center market share inside the hardware category. Services, representing 31.52% of spend, are skewing toward managed offerings as customers outsource tuning of replicas, gradient checkpoints, and energy-aware scheduling. Professional-services growth lags as hyperscalers internalize design skills and smaller providers rely on reference architectures from vendors like Schneider Electric. Across the region, supply-chain constraints in GPUs and network fabric cause operators to hold three-month inventory buffers, tying up working capital but ensuring deployment continuity.
Complete Report Scope:
- By Data Center Type
- Cloud Service Providers
- Colocation Facilities
- Enterprise / On-Prem / Edge
- By Component
- Hardware
- Power Infrastructure
- Cooling Infrastructure
- IT Equipment
- Racks and Other Hardware
- Software Technology
- Machine Learning
- Deep Learning
- Natural Language Processing
- Computer Vision
- Services
- Managed Services
- Professional Services
- Hardware
- By Tier Standard
- Tier III
- Tier IV
- By End-user Industry
- IT and ITES
- Internet and Digital Media
- Telecom Operators
- BFSI
- Healthcare and Life Sciences
- Manufacturing and Industrial IoT
- Government and Defense
- By Country
- China
- Japan
- India
- Malaysia
- South Korea
- Singapore
- Rest of Asia-Pacific
List of Companies Covered in this Report:
- Alibaba Cloud (Alibaba Group)
- Tencent Cloud
- Amazon Web Services
- Microsoft Azure
- Google Cloud
- Huawei Technologies
- NVIDIA Corp.
- Advanced Micro Devices
- Baidu Inc.
- NTT Global Data Centers
- Equinix Inc.
- Digital Realty
- STT GDC
- GDS Holdings
- Yotta Infrastructure
- AirTrunk
- OneAsia Network
- Sunbird Software
- Nlyte Software
- Schneider Electric
- Delta Electronics
- Vertiv Group
- Fuji Electric
- Daikin Industries
Additional Benefits:
- The market estimate (ME) sheet in Excel format
- 3 months of analyst support
TABLE OF CONTENTS
1 INTRODUCTION
- 1.1 Study Assumptions and Market Definition
- 1.2 Scope of the Study
2 RESEARCH METHODOLOGY
3 EXECUTIVE SUMMARY
4 MARKET LANDSCAPE
- 4.1 Market Overview
- 4.2 Market Drivers
- 4.2.1 Hyperscale cloud build-outs in Southeast Asia
- 4.2.2 Government-backed AI compute subsidies in China and South Korea
- 4.2.3 AI-led retrofit of brownfield facilities to liquid cooling
- 4.2.4 Surging generative-AI inference traffic at telecom edge nodes
- 4.2.5 On-prem GPU clusters by Japanese keiretsu manufacturers
- 4.2.6 Sovereign-AI mandates accelerating ASEAN colo pre-leasing
- 4.3 Market Restraints
- 4.3.1 Acute transformer-grade power shortages in Tier-2 Indian cities
- 4.3.2 ASIC/GPU export controls impacting supply lead-times
- 4.3.3 Rising seawater-intake restrictions on coastal mega-sites
- 4.3.4 Talent crunch for AI-optimized DC-IM software engineers
- 4.4 Impact on Sustainability and Carbon-Neutral Energy Goals
- 4.4.1 Sustainable Power Source and Management
- 4.4.1.1 Renewable vs Non-Renewable Sources of Power (Green DCs and AI Innovations)
- 4.4.1.2 Carbon-Footprint Reduction (Heat Pumps, District Cooling and Heating, others)
- 4.4.2 Sustainable Cooling Solutions and Management
- 4.4.2.1 Efficient Cooling Solutions for AI-Optimised DCs
- 4.4.2.2 PUE Ratio, WUE Ratio - Analysis
- 4.4.1 Sustainable Power Source and Management
- 4.5 Industry Ecosystem Analysis
- 4.6 Regulatory or Technological Outlook
- 4.7 Porter's Five Forces Analysis
- 4.7.1 Threat of New Entrants
- 4.7.2 Bargaining Power of Suppliers
- 4.7.3 Bargaining Power of Buyers
- 4.7.4 Threat of Substitutes
- 4.7.5 Intensity of Competitive Rivalry
5 MARKET SIZE AND GROWTH FORECASTS (VALUE)
- 5.1 By Data Center Type
- 5.1.1 Cloud Service Providers
- 5.1.2 Colocation Facilities
- 5.1.3 Enterprise / On-Prem / Edge
- 5.2 By Component
- 5.2.1 Hardware
- 5.2.1.1 Power Infrastructure
- 5.2.1.2 Cooling Infrastructure
- 5.2.1.3 IT Equipment
- 5.2.1.4 Racks and Other Hardware
- 5.2.2 Software Technology
- 5.2.2.1 Machine Learning
- 5.2.2.2 Deep Learning
- 5.2.2.3 Natural Language Processing
- 5.2.2.4 Computer Vision
- 5.2.3 Services
- 5.2.3.1 Managed Services
- 5.2.3.2 Professional Services
- 5.2.1 Hardware
- 5.3 By Tier Standard
- 5.3.1 Tier III
- 5.3.2 Tier IV
- 5.4 By End-user Industry
- 5.4.1 IT and ITES
- 5.4.2 Internet and Digital Media
- 5.4.3 Telecom Operators
- 5.4.4 BFSI
- 5.4.5 Healthcare and Life Sciences
- 5.4.6 Manufacturing and Industrial IoT
- 5.4.7 Government and Defense
- 5.5 By Country
- 5.5.1 China
- 5.5.2 Japan
- 5.5.3 India
- 5.5.4 Malaysia
- 5.5.5 South Korea
- 5.5.6 Singapore
- 5.5.7 Rest of Asia-Pacific
6 COMPETITIVE LANDSCAPE
- 6.1 Market Concentration
- 6.2 Strategic Moves
- 6.3 Market Share Analysis
- 6.4 Company Profiles (includes Global-level Overview, Market-level Overview, Core Segments, Financials as available, Strategic Information, Market Rank/Share, Products and Services, Recent Developments)
- 6.4.1 Alibaba Cloud (Alibaba Group)
- 6.4.2 Tencent Cloud
- 6.4.3 Amazon Web Services
- 6.4.4 Microsoft Azure
- 6.4.5 Google Cloud
- 6.4.6 Huawei Technologies
- 6.4.7 NVIDIA Corp.
- 6.4.8 Advanced Micro Devices
- 6.4.9 Baidu Inc.
- 6.4.10 NTT Global Data Centers
- 6.4.11 Equinix Inc.
- 6.4.12 Digital Realty
- 6.4.13 STT GDC
- 6.4.14 GDS Holdings
- 6.4.15 Yotta Infrastructure
- 6.4.16 AirTrunk
- 6.4.17 OneAsia Network
- 6.4.18 Sunbird Software
- 6.4.19 Nlyte Software
- 6.4.20 Schneider Electric
- 6.4.21 Delta Electronics
- 6.4.22 Vertiv Group
- 6.4.23 Fuji Electric
- 6.4.24 Daikin Industries
7 MARKET OPPORTUNITIES AND FUTURE OUTLOOK
- 7.1 White-space and Unmet-need Assessment

 2026-2034年全球人工智慧資料中心市場規模、佔有率、趨勢和成長分析報告
 人工智慧驅動的資料中心營運市場:全球產業分析、市場規模及佔有率以及未來預測(2026-2033 年),按服務產品、應用、資料中心類型、部署方式、最終用戶、國家和地區分類。AI資料中心市場規模、佔有率、成長、全球產業分析、區域趨勢及2026-2034年預測。
 人工智慧資料中心市場預測至2034年-全球分析(按組件、資料中心類型、部署模式、處理器類型、工作負載、最終用戶和地區分類)
 全球人工智慧資料中心市場分析與預測(2026-2032):技術、基礎設施、部署與營運趨勢
 零售和電子商務領域的IT永續發展軟體:市場佔有率分析、產業趨勢和統計數據以及成長預測(2026-2031年)
 資料中心銅纜市場規模、佔有率和趨勢分析報告:按應用、類型、地區和細分市場分類(2026-2033 年)資料中心基礎設施最佳化:市場規模、溫度控管與能源消耗 - 市場數據概覽(2026 年第二季)人工智慧資料中心市場:全球產業分析、市場規模、市場佔有率及2026年至2033年預測(按服務產品、資料中心類型、部署模式、應用、最終用戶、國家和地區分類)
 2026年全球網路基礎設施即代碼(IaC)市場報告