

 |
市場調查報告書
商品編碼
2073291
歐洲人工智慧能源管理軟體:市場佔有率分析、行業趨勢和統計數據以及成長預測(2026-2031 年)Europe AI-Powered Energy Management Software - Market Share Analysis, Industry Trends & Statistics, Growth Forecasts (2026 - 2031) |
||||||

※ 本網頁內容可能與最新版本有所差異。詳細情況請與我們聯繫。
據 Mordor Intelligence 稱,2025 年歐洲人工智慧能源管理軟體市場價值 11.9 億美元,預計到 2031 年將達到 32.3 億美元,2026 年至 2031 年的複合年成長率為 18.37%。
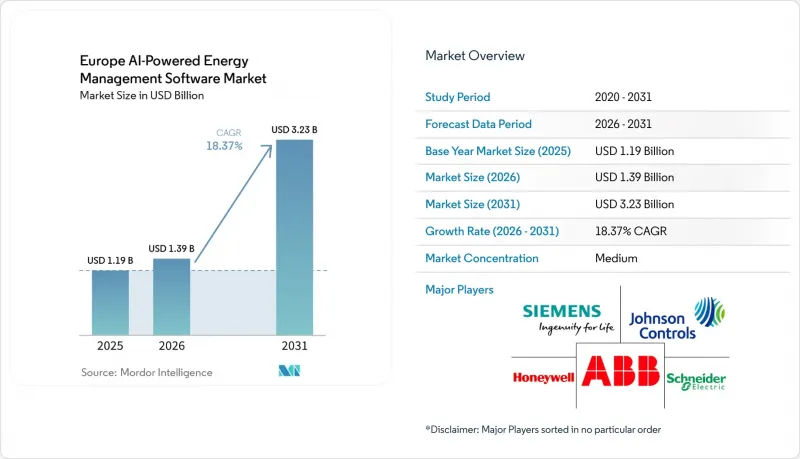
本報告按元件(軟體和服務)、部署模式(雲端、本地部署、混合部署)、應用(例如,能源消耗和需求最佳化、資產性能和預測性維護)、最終用戶(例如,商業建築、工業設施)和地區進行細分。市場預測以價值(美元)表示。
歐洲人工智慧能源管理軟體市場趨勢與洞察
歐洲各地電力成本上漲和負載波動
飆升且波動劇烈的電價進一步凸顯了人工智慧驅動的能源管理軟體在歐洲的商業優勢。預計到2025年,歐洲隔日平均批發電價將達到88歐元/兆瓦時(95美元/兆瓦時),且9.3%的交易時段電價將超過150歐元/兆瓦時(162美元/兆瓦時),因此,對於大規模電力組合而言,繼續採用人工調度變得越來越困難。買家不再只是追求降低能源成本;他們還需要能夠應對快速價格波動的工具,而人工營運團隊根本無法做到這一點。這種轉變意義重大,因為價格波動為歐洲人工智慧驅動的能源管理軟體市場的所有核心功能創造了價值:預測、自動調度和高峰規避。能夠支援更短決策週期和更頻繁控制操作的供應商,正在超越簡單的報告功能,轉而與營運工作流程緊密整合。因此,能源最佳化軟體正日益被視為營運基礎設施,而不僅僅是一個可選的分析層。
智慧電錶普及率和詳細用電量數據的可用性
歐洲人工智慧能源管理軟體市場也受惠於更詳細的用電數據取得管道的增加。預計到2024年底,歐盟27國及3國的智慧電錶普及率將達到58%,並繼續朝著歐盟80%的目標邁進,這將穩步擴大能夠為人工智慧模型提供詳細用電訊號的部署基礎。歐盟委員會也指出,基於智慧電錶的能源管理平均每個計量點可降低270歐元(292美元)的電費,這為更廣泛地部署該軟體提供了強力的經濟基礎。在義大利和法國等第一代智慧電錶部署率已經很高的市場,瓶頸正從資料收集轉向資料解讀和控制邏輯。預計到2025年第一季,德國的智慧電錶普及率僅2.8%,這意味著每新增一台智慧電錶,長期來看,都會擴大歐洲人工智慧能源管理軟體市場的潛在基本客群。這一趨勢既推動了成熟電錶市場的短期應用,也推動了普及速度較慢的國家的長期成長。
與傳統建築和工業控制系統整合的複雜性。
整合的複雜性仍然是限制歐洲人工智慧能源管理軟體市場快速擴展至大規模專案組合的最主要阻礙因素之一。許多商業和工業設施仍然依賴過時的建築控制系統、製程系統以及資料交換不良的分散感測器網路。這導致部署時間延長、測試要求增加,如果輸入資料不完整或不一致,也可能導致模型品質下降。此外,買家還必須額外投入資金用於配置、中間件和支持,才能在現場層級實現價值。一些供應商正在提案協同控制與邊緣和雲端處理相結合的模組化平台,試圖透過更靈活的系統設計來緩解這個問題。然而,整合仍然是部署速度的主要瓶頸,尤其是在專案組合所有者希望使用單一平台覆蓋多種設施類型時。
細分市場分析
2025年歐洲人工智慧能源管理軟體市場中,軟體佔比高達69.21%,這印證了買家仍然更傾向於可擴展的軟體訂閱模式,而非基於硬體的部署方案。這項優勢體現在軟體更新頻率更高、可跨多個地點部署,且無需重新引進週期裝置即可適應新的報告和最佳化任務。在歐洲人工智慧能源管理軟體市場,軟體層仍然是採購決策的核心,因為它整合了預測、異常檢測、負載平衡和排放報告等功能。此外,軟體領域的買家群體也更為廣泛,因為公共產業、商業建築和工業設施都可以部署相同的核心平台,同時採用不同的控制邏輯和報告顯示方式。對許多客戶而言,其吸引力不僅在於成本管理,還在於能夠實現地理位置分散的資產的能源視覺化標準化。
預計到2031年,服務業將以18.44%的複合年成長率成長,顯示歐洲人工智慧能源管理軟體產業並未偏離軟體本身,而是圍繞軟體增加了更多部署和最佳化服務。對於大規模客戶而言,系統整合、模型調優、訓練和託管分析通常是其內部團隊大規模、高效利用平台所必需的。這一點在工業設施和多站點建築群中尤其明顯,因為這些場所的運作條件因地點而異,能源工作流程無法直接應用,必須進行調整。供應商正透過將訂閱模式與高價值服務層結合來解決這個問題,這些服務層支援部署協助和長期效能管理。因此,歐洲人工智慧能源管理軟體市場呈現出以收入為主導的構成比:軟體本身帶來收入,而服務則有助於提高客戶留存率、持續使用率和客戶價值。
到2025年,基於雲端的部署將佔歐洲人工智慧能源管理軟體市場60.17%的佔有率,成為建築和公共產業應用場景中的主導部署模式。集中式資料存取、便利的遠端更新以及跨多個站點的快速擴充性,使得雲端模式成為即時控制要求適中的應用程式場景的首選。這一趨勢與企業的採購模式相符,因為許多企業都希望在初期階段降低IT複雜性,並促進跨站點報告的整合。在歐洲人工智慧能源管理軟體市場,雲端部署對於需要全面投資組合視角的永續性報告、成本基準分析和能耗分析尤其具有吸引力。此外,雲端部署也符合訂閱定價模式以及更頻繁的功能發布需求。
預計到2031年,混合部署將以18.53%的複合年成長率成長,這表明市場正在雲經濟效益與現場營運實際情況之間尋求平衡。關鍵基礎設施營運商和能源密集型製造商通常需要將部分控制系統保留在靠近其資產的位置。這是因為某些操作必須以低延遲執行,並確保更嚴格的系統隔離。混合模式允許將預測、基準測試和投資組合分析遷移到更廣泛的雲端環境,同時在現場保持確定性的控制迴路。因此,在歐洲人工智慧驅動的能源管理軟體市場中,混合架構正成為傳統現場環境與新型企業軟體策略之間的實用橋樑。具有邊緣和雲處理層的模組化平台直接支援這種混合部署邏輯。在監管嚴格或連接受限的領域,本地部署系統仍然很重要,但隨著混合配置成為更複雜應用中的首選折衷方案,其相對作用正在減弱。
其他好處:
- Excel格式的市場預測(ME)表
- 3個月的分析師支持
目錄
第1章:引言
- 研究假設和市場定義
- 調查範圍
第2章:調查方法
第3章執行摘要
第4章 市場狀況
- 市場概覽
- 市場促進因素
- 歐洲各地電力成本上漲和負載波動
- 智慧電錶普及率和詳細用電量數據的可用性
- 商業不動產投資組合面臨遵守歐盟建築能源效率法規的壓力。
- 利用人工智慧進行需求預測,以實現需量反應和尖峰用電調節
- 透過雲端原生能源最佳化縮短投資回收期
- 大型企業碳排放報告及脫碳努力
- 市場限制因素
- 與傳統建築管理系統和工業控制系統整合的複雜性。
- 資料隱私、網路安全和人工智慧管治方面的合規負擔
- 設施所有權的多元化正在減緩投資組合的擴張。
- 能源人工智慧實施和調整缺乏熟練人員
- 宏觀經濟因素對市場的影響
- 產業價值鏈分析
- 監理情勢
- 技術展望
- 波特五力分析
第5章 市場規模與成長預測
- 按組件
- 軟體
- 服務
- 部署模式
- 基於雲端的
- 現場
- 混合
- 透過使用
- 最佳化能源消耗和需求
- 資產性能和預測性維護
- 智慧電網與分散式能源(DER)的管理
- 可再生能源預測與整合
- 能源交易、定價和市場訊息
- 最終用戶
- 公用事業
- 商業建築
- 工業設施
- 住宅大樓
- 按地區
- 德國
- 英國
- 法國
- 義大利
- 西班牙
- 俄羅斯
- 其他歐洲國家
第6章 競爭情勢
- 市場集中度
- 策略趨勢
- 市佔率分析
- 公司簡介
- ABB Ltd.
- Schneider Electric SE
- Siemens AG
- Honeywell International Inc.
- Johnson Controls International plc
- IBM Corporation
- SAP SE
- Schneider Electric SE
- Cisco Systems, Inc.
- Carrier Global Corporation
- Emerson Electric Co.
- GridPoint, Inc.
- EnergyCAP, LLC
- Enel X Srl
- Dexma Sensors, SLU
- C3.ai, Inc.
- METRON
- enercast GmbH
- Spacewell International NV
- Kaluza Limited
- BrainBox AI Inc.
- GridBeyond Limited
- Energyworx BV
- Power Factors, LLC
- Verdigris Technologies, Inc.
第7章 市場機會與未來展望
According to Mordor Intelligence, the europe AI-powered energy management software market size was valued at USD 1.19 billion in 2025 and is projected to reach USD 3.23 billion by 2031, growing at a CAGR of 18.37% during 2026-2031.
This report is Segmented by Component (Software, and Services), Deployment Mode (Cloud-Based, On-Premises, and Hybrid), Application (Energy Consumption and Demand Optimization, Asset Performance and Predictive Maintenance, and More), End User (Commercial Buildings, Industrial Facilities, and More), and Geography. The Market Forecasts are Provided in Terms of Value (USD).
Europe AI-Powered Energy Management Software Market Trends and Insights
Rising Electricity Costs and Load Volatility Across Europe
High and unstable electricity prices have strengthened the commercial case for the Europe AI-powered energy management software market. European wholesale day-ahead electricity averaged EUR 88/MWh (USD 95/MWh) in 2025, and prices exceeded EUR 150/MWh (USD 162/MWh) in 9.3% of trading hours, making manual scheduling harder to justify for large portfolios. Buyers are no longer looking only for lower energy bills; they also need tools that can respond to rapid price swings with the discipline manual teams cannot. This shift matters because volatility creates value for forecasting, automated dispatch, and peak avoidance, which are all core functions of the Europe AI-powered energy management software market. Vendors that can support shorter decision cycles and more frequent control actions are moving closer to operational workflows rather than staying in reporting-only roles. The result is that energy optimization software is being treated more like operating infrastructure than an optional analytics layer.
Smart Meter Penetration and Granular Consumption Data Availability
The Europe AI-powered energy management software market is also benefiting from broader access to granular consumption data. Smart meter penetration across the EU27+3 region reached 58% by the end of 2024 and continued to move toward the EU target of 80%, which is steadily enlarging the installed base that can feed AI models with detailed usage signals. The European Commission has also stated that smart meter-enabled energy management can deliver average electricity savings of EUR 270 (USD 292) per metering point, which supports the financial case for wider software adoption. In markets such as Italy and France, where first-generation rollout has already reached high penetration, the bottleneck has shifted from data collection to data interpretation and control logic. In Germany, smart meter penetration was only 2.8% in Q1 2025, meaning each new installation expands the addressable base for the Europe AI-powered energy management software market over the long term. This pattern supports both near-term adoption in mature meter markets and longer runway growth in late-moving countries.
Integration Complexity With Legacy Building and Industrial Control Systems
Integration complexity remains one of the clearest limits on how fast the Europe AI-powered energy management software market can scale across large portfolios. Many commercial and industrial sites still rely on older building controls, process systems, and fragmented sensor networks that do not exchange data smoothly. This raises implementation time, increases testing needs, and can weaken model quality if the incoming data is incomplete or inconsistent. It also pushes buyers to spend more on configuration, middleware, and support before they see value at the site level. Some vendors are positioning modular platforms that combine coordinated control with both edge and cloud processing, demonstrating how they aim to reduce this problem through more flexible system design. Even so, integration work remains a significant drag on rollout speed, especially when portfolio owners want a single platform to cover multiple facility types.
Other drivers and restraints analyzed in the detailed report include:
- EU Building Efficiency Compliance Pressure on Commercial Portfolios
- AI-Enabled Forecasting for Demand Response and Peak Shaving
- Data Privacy, Cybersecurity, and AI Governance Compliance Burden
For complete list of drivers and restraints, kindly check the Table Of Contents.
Segment Analysis
Software accounted for 69.21% of the Europe AI-powered energy management software market in 2025, confirming that buyers still prefer scalable software subscriptions over hardware-based deployments. This lead reflects the fact that software can be updated more often, rolled out across multiple sites, and adapted to new reporting or optimization tasks without a new equipment cycle. The software layer is where forecasting, anomaly detection, load shaping, and emissions reporting come together, so it remains the center of the buying decision in the Europe AI-powered energy management software market. The software segment also benefits from a broader buyer base, as utilities, commercial buildings, and industrial facilities can all deploy the same core platform with different control logic and reporting views. For many customers, the appeal is not only cost control, but also the ability to standardize energy visibility across geographically dispersed assets.
Services are projected to expand at a 18.44% CAGR through 2031, indicating that the Europe AI-powered energy management software industry is not moving away from software but is adding more implementation and optimization work around it. Large accounts often need system integration, model tuning, training, and managed analytics before internal teams can use the platform effectively at scale. This is especially true in industrial and multi-site building portfolios where operating conditions differ by site, and energy workflows cannot be copied without adjustment. Vendors are responding by combining subscription models with higher-value service layers that support onboarding and long-term performance management. The result is a component mix where software leads revenue and services deepen stickiness, retention, and realized customer value within the Europe AI-powered energy management software market.
Cloud-based deployment held a 60.17% share of the European AI-powered energy management software market in 2025, making it the dominant deployment model across buildings and utility analytics use cases. Centralized data access, easier remote updates, and faster scaling across multiple facilities have made cloud models the default choice for moderate real-time control requirements. This preference also aligns with enterprise buying patterns, as many organizations seek lower upfront IT complexity and easier reporting consolidation across sites. In the European AI-powered energy management software market, cloud deployment is particularly attractive for sustainability reporting, cost benchmarking, and consumption analytics that need a broad portfolio view. It also aligns with the push toward subscription pricing and more frequent feature releases.
Hybrid deployment is expected to expand at a 18.53% CAGR through 2031, indicating that the market is balancing cloud economics with site-level operational realities. Critical infrastructure operators and energy-intensive manufacturers often need parts of the control stack to stay closer to the asset because some actions must occur with low latency and with tighter system separation. Hybrid models let them keep deterministic control loops on site while moving forecasting, benchmarking, and portfolio analytics into broader cloud environments. This makes hybrid architecture a practical bridge between legacy site conditions and newer enterprise software strategies in the Europe AI-powered energy management software market. Modular platforms with both edge and cloud processing layers directly support this blended deployment logic. On-premises systems still matter in regulated or connectivity-constrained sites, but their relative role is narrowing as hybrid setups become the preferred compromise for more complex accounts.
Complete Report Scope:
- By Component
- Software
- Services
- By Deployment Mode
- Cloud-Based
- On-Premises
- Hybrid
- By Application
- Energy Consumption and Demand Optimization
- Asset Performance and Predictive Maintenance
- Smart Grid and Distributed Energy Resource (DER) Management
- Renewable Energy Forecasting and Integration
- Energy Trading, Pricing and Market Intelligence
- By End User
- Utilities
- Commercial Buildings
- Industrial Facilities
- Residential Buildings
- By Geography
- Germany
- United Kingdom
- France
- Italy
- Spain
- Russia
- Rest of Europe
List of Companies Covered in this Report:
- ABB Ltd.
- Schneider Electric SE
- Siemens AG
- Honeywell International Inc.
- Johnson Controls International plc
- IBM Corporation
- SAP SE
- Schneider Electric S.E.
- Cisco Systems, Inc.
- Carrier Global Corporation
- Emerson Electric Co.
- GridPoint, Inc.
- EnergyCAP, LLC
- Enel X S.r.l.
- Dexma Sensors, S.L.U.
- C3.ai, Inc.
- METRON
- enercast GmbH
- Spacewell International N.V.
- Kaluza Limited
- BrainBox AI Inc.
- GridBeyond Limited
- Energyworx B.V.
- Power Factors, LLC
- Verdigris Technologies, Inc.
Additional Benefits:
- The market estimate (ME) sheet in Excel format
- 3 months of analyst support
TABLE OF CONTENTS
1 INTRODUCTION
- 1.1 Study Assumptions and Market Definition
- 1.2 Scope of the Study
2 RESEARCH METHODOLOGY
3 EXECUTIVE SUMMARY
4 MARKET LANDSCAPE
- 4.1 Market Overview
- 4.2 Market Drivers
- 4.2.1 Rising Electricity Costs and Load Volatility Across Europe
- 4.2.2 Smart Meter Penetration and Granular Consumption Data Availability
- 4.2.3 EU Building Efficiency Compliance Pressure on Commercial Portfolios
- 4.2.4 AI Enabled Forecasting for Demand Response and Peak Shaving
- 4.2.5 Faster Return on Investment from Cloud Native Energy Optimization
- 4.2.6 Carbon Reporting and Decarbonization Commitments from Large Enterprises
- 4.3 Market Restraints
- 4.3.1 Integration Complexity With Legacy Building and Industrial Control Systems
- 4.3.2 Data Privacy, Cybersecurity, and AI Governance Compliance Burden
- 4.3.3 Fragmented Facility Ownership Slowing Portfolio Scale-Up
- 4.3.4 Skilled Implementation Shortage for Energy AI Deployment and Tuning
- 4.4 Impact of Macroeconomic Factors on The Market
- 4.5 Industry Value-Chain Analysis
- 4.6 Regulatory Landscape
- 4.7 Technological Outlook
- 4.8 Porter's Five Forces Analysis
- 4.8.1 Bargaining Power of Buyers
- 4.8.2 Bargaining Power of Suppliers
- 4.8.3 Threat of New Entrants
- 4.8.4 Threat of Substitutes
- 4.8.5 Intensity of Competitive Rivalry
5 MARKET SIZE AND GROWTH FORECASTS (VALUE)
- 5.1 By Component
- 5.1.1 Software
- 5.1.2 Services
- 5.2 By Deployment Mode
- 5.2.1 Cloud-Based
- 5.2.2 On-Premises
- 5.2.3 Hybrid
- 5.3 By Application
- 5.3.1 Energy Consumption and Demand Optimization
- 5.3.2 Asset Performance and Predictive Maintenance
- 5.3.3 Smart Grid and Distributed Energy Resource (DER) Management
- 5.3.4 Renewable Energy Forecasting and Integration
- 5.3.5 Energy Trading, Pricing and Market Intelligence
- 5.4 By End User
- 5.4.1 Utilities
- 5.4.2 Commercial Buildings
- 5.4.3 Industrial Facilities
- 5.4.4 Residential Buildings
- 5.5 By Geography
- 5.5.1 Germany
- 5.5.2 United Kingdom
- 5.5.3 France
- 5.5.4 Italy
- 5.5.5 Spain
- 5.5.6 Russia
- 5.5.7 Rest of Europe
6 COMPETITIVE LANDSCAPE
- 6.1 Market Concentration
- 6.2 Strategic Moves
- 6.3 Market Share Analysis
- 6.4 Company Profiles (includes Global Level Overview, Market Level Overview, Core Segments, Financials as available, Strategic Information, Market Rank/Share, Products and Services, Recent Developments)
- 6.4.1 ABB Ltd.
- 6.4.2 Schneider Electric SE
- 6.4.3 Siemens AG
- 6.4.4 Honeywell International Inc.
- 6.4.5 Johnson Controls International plc
- 6.4.6 IBM Corporation
- 6.4.7 SAP SE
- 6.4.8 Schneider Electric S.E.
- 6.4.9 Cisco Systems, Inc.
- 6.4.10 Carrier Global Corporation
- 6.4.11 Emerson Electric Co.
- 6.4.12 GridPoint, Inc.
- 6.4.13 EnergyCAP, LLC
- 6.4.14 Enel X S.r.l.
- 6.4.15 Dexma Sensors, S.L.U.
- 6.4.16 C3.ai, Inc.
- 6.4.17 METRON
- 6.4.18 enercast GmbH
- 6.4.19 Spacewell International N.V.
- 6.4.20 Kaluza Limited
- 6.4.21 BrainBox AI Inc.
- 6.4.22 GridBeyond Limited
- 6.4.23 Energyworx B.V.
- 6.4.24 Power Factors, LLC
- 6.4.25 Verdigris Technologies, Inc.
7 MARKET OPPORTUNITIES AND FUTURE OUTLOOK
- 7.1 White-Space and Unmet-Need Assessment

 2026-2030年全球環境情報市場
 北美人工智慧能源管理軟體:市場佔有率分析、行業趨勢和統計數據以及成長預測(2026-2031 年)非洲人工智慧能源管理軟體:市場佔有率分析、行業趨勢和統計數據以及成長預測(2026-2031 年)
 2026-2030年全球人工智慧能源效率工具市場
 能源管理自動化系統市場預測至2034年—按系統類型、組件、技術、應用、最終用戶和地區分類的全球分析
 2026年全球核能人工智慧(AI)市場報告
 人工智慧在能源領域的市場規模、佔有率和趨勢分析報告:按類型、應用、地區和細分市場分類(2026-2033 年)熱電網人工智慧管理市場預測至2034年——全球解決方案類型、組件、部署模式、技術、應用、最終用戶和區域分析2026年全球能源分配人工智慧(AI)市場報告2026年全球能源領域人工智慧市場報告