


 |
市場調查報告書
商品編碼
2073248
美國綠色物流:市場佔有率分析、產業趨勢與統計及成長預測(2026-2031)United States Green Logistics - Market Share Analysis, Industry Trends & Statistics, Growth Forecasts (2026 - 2031) |
||||||

※ 本網頁內容可能與最新版本有所差異。詳細情況請與我們聯繫。
據 Mordor Intelligence 稱,2025 年美國綠色物流市場價值為 3595.5 億美元,預計到 2031 年將達到 5209.1 億美元,而 2026 年為 3834.1 億美元,預測期(2026-2031 年)的複合成長率為 6.32%。
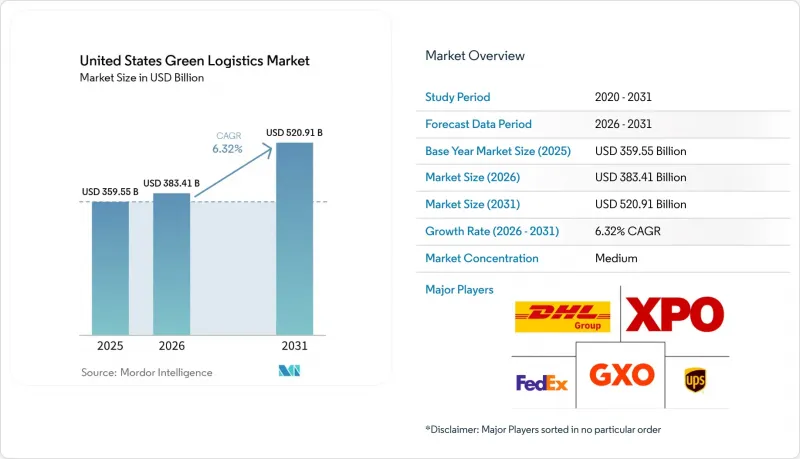
美國綠色物流市場的成長主要由大型托運人推動,他們日益將運輸脫碳視為採購要求,而不僅僅是形式上的報告,這導致整個貨運網路在承運商選擇和合約設計方面發生改變。本報告按物流功能(綠色運輸、綠色倉儲、附加價值服務)、燃料/能源類型(電動物流、生質燃料物流等)、終端用戶產業(零售/電商、製造/工業等)和地區(東北部、東南部、中西部、西南部、西部)進行細分。市場預測以美元計價。
美國綠色物流市場趨勢與洞察
托運人採購中脫碳化的興起
企業採購團隊不再將低排放運輸視為可選項。這一轉變正在改變美國綠色物流市場貨運路線合約的訂單。以採購主導的網路重組如今包含直接的排放目標,因此,檢驗的運輸排放數據和可靠的減排計畫在承運商評估標準中越來越受到重視。 RMI 的研究表明,將以採購主導的供應鏈重組納入承運商選擇和網路規劃,可以將範圍 3 的運輸排放減少 30% 至 60%。這種轉變在大規模採購模式中已顯而易見。例如,亞馬遜、eBay 和 Meta 於 2026 年 1 月啟動的「綠色市場激活」卡車運輸採購項目,旨在支持 Nevoya 運營的休斯頓至達拉斯之間由 40 輛純電動卡車組成的運輸路線。事實上,採用數位化報告工具的大型承運商更容易獲得高價值契約,而小規模承運商則面臨著被排除在高價值路線指導之外的風險。這正是美國綠色物流市場從單純升級設備轉向根據可衡量的排放績效來區分服務的最明顯原因之一。
來自美國環保署和各州的壓力,要求對零排放進行監管。
美國綠色物流市場的合規壓力正同時源自於兩個政策方向,迫使承運商在製定路線和州級營運計畫時更加謹慎。 2026年,美國環保署(EPA)提案在拜登政府時期延後車輛標準的實施,表示此舉將減少17億美元的合規成本。通常情況下,這會緩解聯邦層級的過渡壓力。然而,各州,尤其是加州和其他「綠色運輸聯盟」(ACT)成員州的電氣化法規依然嚴格,並持續影響著跨多個地理區域運營的承運商的車輛採購決策。這種政策碎片化造成了實際營運上的差距:一方面,車隊可以根據區域制定個性化的合規方案;另一方面,車隊則需要在其所有資產中採用單一的、廣泛的全國性標準。實際上,在港口、人口密集的零售區和監管嚴格的城市市場運營的承運商仍然被迫根據最嚴格的法規而非最寬鬆的法規來調整投資規模。即使在聯邦政策存在明顯不確定性的情況下,這種現實仍然支撐著美國綠色物流市場的發展。
車輛和設施搬遷的前期成本很高。
美國綠色物流市場面臨的最大障礙仍然是更換柴油車輛和維修設施以適應新型動力傳動系統的成本。 2025 年發表在《自然通訊》上的一項研究預測,到 2025 年,重型純電動車的私人成本將為每英里 0.71 美元,比柴油車高出 46%,但隨著電池經濟性的提高,預計到 2035 年,這一差距將縮小至 33%。對於缺乏大型綜合網路議價能力、資金籌措或線路密度的小型運輸業者而言,這項成本負擔更為沉重。因此,一種「兩極化的轉型」正在出現:大規模車輛所有者可以將資本成本分攤到更多線路上,而小型營運商則推遲投資,繼續依賴現有的柴油車輛。 Penske 發布的 2026 年市場報告指出,透過多種動力傳動系統而非單一的線性路徑實現全面電氣化,可以增強韌性,這表明營運商正在即時管理成本風險。在資金籌措結構、獎勵和殘值假設進一步改善之前,美國綠色物流市場的採用情況可能仍將不平衡。
細分市場分析
綠色運輸正在推動這一細分市場的發展,預計到2025年將成為最大的功能板塊,占美國綠色物流市場佔有率的56.11%。在這一類別中,道路運輸仍然是主要的子模式。這是因為車輛電氣化首先應用於最後一公里配送、本地配送和其他短程路線等應用場景,這些場景的資產調度和管理相對容易。此外,由於運輸是托運人最直覺的貨運相關排放源,因此往往是採購團隊和合規計畫的首要關注點,這也有利於該細分市場的發展。鐵路運輸仍然十分重要,尤其是當客戶尋求無需即時更換卡車的低排放方案時。
綠色附加價值服務是成長最快的領域,預計到2031年將以10.91%的複合年成長率成長。這反映出美國綠色物流業對永續性作為可銷售服務的接受度日益提高。該領域的需求主要來自排放測量、逆向物流、永續包裝支援以及可與實際貨物運輸關聯的可審計整合產品。美國綠色物流市場中該領域的快速成長源於托運人日益要求提供運輸能力證明、文件和報告系統,並且要求在運輸過程中(而非出貨後)也需提供這些資訊。
其他好處:
- Excel格式的市場預測(ME)表
- 3個月的分析師支持
目錄
第1章:引言
- 研究假設和市場定義
- 調查範圍
第2章:調查方法
第3章執行摘要
第4章 市場狀況
- 市場概況及綠色物流在物流中的作用
- ESG相關支出趨勢
- 市場促進因素
- 托運人採購中脫碳化的興起
- 來自美國環保署和各州的壓力,迫使企業遵守零排放法規。
- 電動車充電和走廊基礎設施的開發
- 利用人工智慧進行路線最佳化和貨物整合的優勢
- 港口和倉庫電氣設備的引進
- 對排放報告和可審計性的需求
- 市場限制因素
- 車輛和設施搬遷的前期成本很高。
- 電網容量和互通性的瓶頸
- 剩餘柴油資產的鎖定風險和折舊免稅額風險
- 熟練的綠色物流人員短缺
- 法律規範
- 價值鍊與通路結構分析
- 技術創新的前景
- 波特五力模型
- 綠色物流需求的演變
- 地緣政治事件對供應鏈轉型的影響
第5章 市場規模及成長預測(價值,2026-2031 年)
- 透過物流功能
- 環保交通
- 路
- 航空
- 海路和內河航道
- 鐵路
- 環保倉儲物流
- 綠色附加價值服務及其他
- 環保交通
- 燃料/能源分類
- 電動物流
- 利用生質燃料的物流
- 動力來源物流
- 其他
- 按最終用戶行業分類
- 零售與電子商務
- 製造業和工業
- 車
- 醫療和藥品
- 食品/飲料
- 化學品和危險材料
- 其他
- 按地區
- 東北
- 東南
- 中西部
- 西南
- 西方
第6章 競爭情勢
- 市場集中度
- 關鍵策略趨勢
- 市佔率分析
- 公司簡介
- United Parcel Service(UPS)
- FedEx
- DHL Group
- XPO, Inc.
- GXO Logistics, Inc.
- JB Hunt Transport Services, Inc.
- Schneider National, Inc.
- Ryder System, Inc.
- CH Robinson Worldwide, Inc.
- Amazon Freight
- Lineage Logistics, LLC
- Penske Logistics
- Kuehne+Nagel
- DSV(including DB Schenker)
- Maersk
- GEODIS
- CEVA Logistics(CMA CGM)
- Hub Group, Inc.
- ArcBest Corporation
- Old Dominion Freight Line, Inc.
- Knight-Swift Transportation Holdings Inc.
- Werner Enterprises, Inc.
第7章 市場機會與未來展望
According to Mordor Intelligence, the united states green logistics market size was valued at USD 359.55 billion in 2025 and estimated to grow from USD 383.41 billion in 2026 to reach USD 520.91 billion by 2031, at a CAGR of 6.32% during the forecast period (2026-2031).
Growth in the United States green logistics market is being supported by large shippers that now treat transport decarbonization as a purchasing requirement, not only a reporting exercise, which is changing carrier selection and contract design across freight networks. This report is Segmented by Logistics Function (Green Transportation, Green Warehousing, Value-Added Services), by Fuel/Energy Type (Electric-Powered Logistics, Biofuel-Based Logistics, and More), by End-User Industry (Retail and E-Commerce, Manufacturing & Industrial, and More), and by Region (Northeast, Southeast, Midwest, Southwest, West). The Market Forecasts are Provided in Terms of Value (USD).
United States Green Logistics Market Trends and Insights
Rising Shipper Decarbonization Procurement
Corporate buying teams are no longer treating low-emission transport as an optional service layer. That change is altering how freight lanes are awarded in the United States green logistics market. Procurement-led network redesign now carries a direct emissions target, which is why carrier scorecards increasingly ask for verified transport emissions data and credible reduction pathways. RMI documented that procurement-led supply chain redesign can yield 30% to 60% reductions in Scope 3 transportation when built into carrier selection and network planning. That shift is already visible in large-scale buying models, including the January 2026 Green Market Activation trucking procurement, which brought Amazon, eBay, and Meta together to support Nevoya's 40-truck all-electric Houston-to-Dallas corridor. The practical effect is that larger carriers with digital reporting tools are winning better access to premium contracts, while smaller fleets risk being pushed out of high-value routing guides. This is one of the clearest reasons the United States green logistics market is moving beyond equipment replacement and toward service differentiation based on measurable emissions performance.
EPA And State Zero-Emission Compliance Pressure
Compliance pressure in the United States green logistics market is coming from two policy directions at the same time, forcing fleets to plan more carefully by route and state. In 2026, the EPA proposed delaying Biden-era vehicle standards, saying they could save USD 1.7 billion in compliance costs, which would normally soften transition pressure at the federal level. Yet state-level electrification rules remain firm, especially in California and other ACT coalition states, and continue to shape vehicle purchasing decisions for carriers that cross multiple regions. The policy split creates a real operational divide between fleets that can localize compliance by geography and those that need a single, broader national standard across their asset base. In practice, carriers serving ports, dense retail corridors, and regulated urban markets still have to size investments to the strictest rulebook rather than the loosest one. That reality continues to support the United States green logistics market even when the federal direction looks less certain.
High Upfront Cost Of Fleet And Facility Transition
The largest brake on the United States green logistics market remains the cost of replacing diesel fleets and upgrading sites to support new powertrains. A 2025 Nature Communications study found that battery-electric heavy-duty vehicles had 46% higher private costs in 2025 at USD 0.71 per mile compared with diesel, with the gap narrowing to 33% by 2035 as battery economics improve. That cost burden is heavier for smaller carriers because they lack the same bargaining power, financing options, or route density as large integrated networks. The result is a two-speed transition, where larger fleets can spread capital costs across more lanes while smaller operators postpone investment and remain tied to existing diesel assets. Penske's 2026 market brief still pointed to multi-powertrain resilience rather than a single straight path to full electrification, which shows how operators are managing cost risk in real time. Until financing structures, incentives, and residual value assumptions improve further, adoption across the United States green logistics market will remain uneven.
Other drivers and restraints analyzed in the detailed report include:
- EV Charging And Corridor Infrastructure Buildout
- AI-Based Routing And Load Consolidation Gains
- Grid Capacity And Interoperability Bottlenecks
For complete list of drivers and restraints, kindly check the Table Of Contents.
Segment Analysis
Green transportation led this segment, accounting for 56.11% of the United States green logistics market share in 2025, making it the largest functional block. Road transport remains the main sub-mode within that category, because fleet electrification is spreading first through last-mile, regional distribution, and other shorter-route applications where asset scheduling is easier to control. The segment also benefits from the fact that transport is the most visible source of freight emissions for shippers, so it is often the first area targeted by procurement teams and compliance programs. Rail still plays a meaningful role, especially when customers want a lower-emission option that does not require immediate truck replacement.
The fastest-growing function is green value-added services and others, which is projected to rise at a 10.91% CAGR through 2031 and reflects how sustainability is becoming a sellable service within the United States green logistics industry. Demand in this segment is being driven by emissions measurement, reverse logistics, support for sustainable packaging, and auditable insetting products that can be attached to physical freight movements. This part of the United States green logistics market is growing faster because shippers increasingly want proof, documentation, and reporting discipline alongside transport capacity, not after the shipment is complete.
Complete Report Scope:
- By Logistics Function
- Green Transportation
- Road
- Air
- Sea and Inland Waterways
- Rail
- Green Warehousing & Distribution
- Green Value-added Services and Others
- Green Transportation
- By Fuel / Energy Type
- Electric-Powered Logistics
- Biofuel-Based Logistics
- Hydrogen-Powered Logistics
- Others
- By End-user Industry
- Retail & E-commerce
- Manufacturing & Industrial
- Automotive
- Healthcare & Pharmaceuticals
- Food & Beverages
- Chemicals & Hazardous Materials
- Others
- By Region
- Northeast
- Southeast
- Midwest
- Southwest
- West
List of Companies Covered in this Report:
- United Parcel Service (UPS)
- FedEx
- DHL Group
- XPO, Inc.
- GXO Logistics, Inc.
- J.B. Hunt Transport Services, Inc.
- Schneider National, Inc.
- Ryder System, Inc.
- C.H. Robinson Worldwide, Inc.
- Amazon Freight
- Lineage Logistics, LLC
- Penske Logistics
- Kuehne+Nagel
- DSV (including DB Schenker)
- Maersk
- GEODIS
- CEVA Logistics (CMA CGM)
- Hub Group, Inc.
- ArcBest Corporation
- Old Dominion Freight Line, Inc.
- Knight-Swift Transportation Holdings Inc.
- Werner Enterprises, Inc.
Additional Benefits:
- The market estimate (ME) sheet in Excel format
- 3 months of analyst support
TABLE OF CONTENTS
1 Introduction
- 1.1 Study Assumptions & Market Definition
- 1.2 Scope of the Study
2 Research Methodology
3 Executive Summary
4 Market Landscape
- 4.1 Market Overview and Role of Green Logistics in Logistics
- 4.2 ESG Spending Trends
- 4.3 Market Drivers
- 4.3.1 Rising Shipper Decarbonization Procurement
- 4.3.2 EPA and State Zero-Emission Compliance Pressure
- 4.3.3 EV Charging and Corridor Infrastructure Buildout
- 4.3.4 AI-Based Routing and Load Consolidation Gains
- 4.3.5 Electrified Port and Warehouse Equipment Adoption
- 4.3.6 Emissions Reporting and Auditability Demand
- 4.4 Market Restraints
- 4.4.1 High Upfront Cost of Fleet and Facility Transition
- 4.4.2 Grid Capacity and Interoperability Bottlenecks
- 4.4.3 Residual Diesel Asset Lock-In and Depreciation Risk
- 4.4.4 Shortage of Skilled Green Logistics Operators
- 4.5 Regulatory Framework
- 4.6 Value Chain and Distribution Channel Architecture Analysis
- 4.7 Technology Innovations Outlook
- 4.8 Porter's Five Forces
- 4.8.1 Threat of New Entrants
- 4.8.2 Bargaining Power of Suppliers
- 4.8.3 Bargaining Power of Buyers
- 4.8.4 Threat of Substitutes
- 4.8.5 Rivalry Among Competitors
- 4.9 Evolution of Green Logistics Requirements
- 4.10 Impact of Geo-Political Events on Supply Chain Shifts
5 Market Size & Growth Forecasts (Value, 2026-2031)
- 5.1 By Logistics Function
- 5.1.1 Green Transportation
- 5.1.1.1 Road
- 5.1.1.2 Air
- 5.1.1.3 Sea and Inland Waterways
- 5.1.1.4 Rail
- 5.1.2 Green Warehousing & Distribution
- 5.1.3 Green Value-added Services and Others
- 5.1.1 Green Transportation
- 5.2 By Fuel / Energy Type
- 5.2.1 Electric-Powered Logistics
- 5.2.2 Biofuel-Based Logistics
- 5.2.3 Hydrogen-Powered Logistics
- 5.2.4 Others
- 5.3 By End-user Industry
- 5.3.1 Retail & E-commerce
- 5.3.2 Manufacturing & Industrial
- 5.3.3 Automotive
- 5.3.4 Healthcare & Pharmaceuticals
- 5.3.5 Food & Beverages
- 5.3.6 Chemicals & Hazardous Materials
- 5.3.7 Others
- 5.4 By Region
- 5.4.1 Northeast
- 5.4.2 Southeast
- 5.4.3 Midwest
- 5.4.4 Southwest
- 5.4.5 West
6 Competitive Landscape
- 6.1 Market Concentration
- 6.2 Key Strategic Moves
- 6.3 Market Share Analysis
- 6.4 Company Profiles (includes Global level Overview, Market level overview, Core Segments, Financials as available, Strategic Information, Market Rank/Share for key companies, Products & Services, and Recent Developments)
- 6.4.1 United Parcel Service (UPS)
- 6.4.2 FedEx
- 6.4.3 DHL Group
- 6.4.4 XPO, Inc.
- 6.4.5 GXO Logistics, Inc.
- 6.4.6 J.B. Hunt Transport Services, Inc.
- 6.4.7 Schneider National, Inc.
- 6.4.8 Ryder System, Inc.
- 6.4.9 C.H. Robinson Worldwide, Inc.
- 6.4.10 Amazon Freight
- 6.4.11 Lineage Logistics, LLC
- 6.4.12 Penske Logistics
- 6.4.13 Kuehne+Nagel
- 6.4.14 DSV (including DB Schenker)
- 6.4.15 Maersk
- 6.4.16 GEODIS
- 6.4.17 CEVA Logistics (CMA CGM)
- 6.4.18 Hub Group, Inc.
- 6.4.19 ArcBest Corporation
- 6.4.20 Old Dominion Freight Line, Inc.
- 6.4.21 Knight-Swift Transportation Holdings Inc.
- 6.4.22 Werner Enterprises, Inc.
7 Market Opportunities & Future Outlook
- 7.1 White-space & Unmet-Need Assessment

 印度綠色物流:市場佔有率分析、產業趨勢與統計及成長預測(2026-2031)德國綠色物流:市場佔有率分析、產業趨勢與統計及成長預測(2026-2031)綠色物流:市場佔有率分析、產業趨勢與統計、成長預測(2026-2031)
 綠色物流市場分析及預測(至2035年):依類型、產品、服務、技術、組件、應用、部署、最終用戶及解決方案分類
 2026年全球綠色物流市場報告
 2034年全球電動貨運和綠色物流走廊市場預測-按商業模式、運輸方式、走廊基礎設施、技術、最終用戶和區域分類的全球分析
 綠色物流市場:按車隊遠端資訊處理、電動車充電基礎設施、類型和最終用途分類-全球預測,2026-2032年
 2026-2030年全球綠色物流認證服務市場綠色物流市場預測至2032年:按組件、運輸方式、業務類型、最終用戶和地區分類的全球分析
 全球綠色物流市場