


 |
市場調查報告書
商品編碼
2073019
永續IT採購軟體:市場佔有率分析、產業趨勢與統計及成長預測(2026-2031年)Sustainable IT Procurement Software - Market Share Analysis, Industry Trends & Statistics, Growth Forecasts (2026 - 2031) |
||||||

※ 本網頁內容可能與最新版本有所差異。詳細情況請與我們聯繫。
據 Mordor Intelligence 稱,2025 年永續IT 採購軟體市值為 10.4 億美元,預計到 2031 年將從 2026 年的 12.2 億美元成長至 28.4 億美元,預測期(2026-2031 年)複合年成長率為 18.41%。
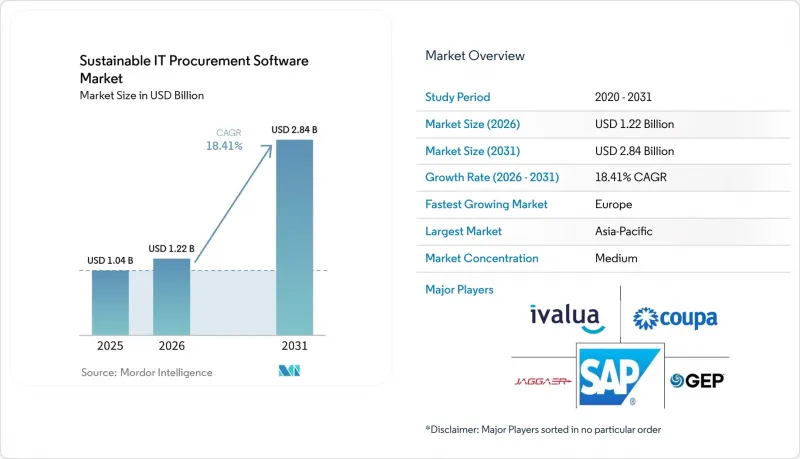
本報告按元件(軟體和服務)、部署模式(雲端、本地部署、混合部署)、企業規模(大型企業和中小企業)、應用程式(供應商ESG評級和評分等)、IT採購類別(終端用戶運算設備等)以及地區終端用戶計算設備等)以及地區終端進行細分。市場預測以美元計價。
全球永續IT採購軟體市場趨勢與洞察
IT採購中範圍3資料可追溯性的監理壓力
永續IT採購軟體市場的發展受到範圍3報告揭露規定的推動,該規定要求更清晰地區分供應商測量的原始資料和模型估計值。這項要求無法透過多層IT供應鏈中的人工採購流程來滿足。此外,2026年3月發布的《溫室氣體會計系統》第一階段進度報告引入了覆蓋95%報告範圍的要求,縮小了最低限度豁免的範圍,並增加了直接從供應商收集數據的需求。世界永續工商理事會(WBCSD)於2025年4月發布了PACT調查方法v3.0,進一步推動了這項變革,為貿易夥伴跨系統交換產品碳足跡資料提供了更清晰的框架。價值鏈受到的影響仍在持續,因為即使在2025年4月CSRD簡化方案縮小了受此義務約束的公司數量之後,大規模買家仍然需要從認證的IT供應商處獲得結構化的ESG數據。這些因素——法規、數據標準以及對供應商的報告壓力——共同確保了「永續IT 採購軟體市場」與合規主導的企業支出緊密相連。
企業對可審計的供應商ESG數據的需求日益成長
此外,「永續IT採購軟體市場」正獲得越來越多買家的支持,他們不再接受供應商在沒有審計、提交和外部檢驗等證據支持的情況下提出的永續性聲明。 2026年5月,EcoVadis報告稱,其網路中超過2.5兆美元的支出透過其永續性風險洞察進行管理。這顯示該技術的應用滲透率極高,而除網路最密集的供應商群體之外,供應商覆蓋範圍仍不足。企業現在尋求能夠根據審計記錄和即時風險指標檢驗調查回應的平台,從而將供應商評估從週期性調查活動轉變為採購管理中更持久的層面。 EcoVadis與Ivalua的夥伴關係於2025年6月續簽,正是為了滿足這些需求,在採購團隊開始與供應商接洽之前,將預測性ESG風險分析整合到Ivalua的「風險中心」。因此,永續IT採購軟體市場的範圍正在從供應商入駐擴展到品類規劃、風險篩檢和供應商發展計畫。
二級和三級供應商網路中的排放資料分散
永續IT採購軟體市場仍面臨著一個根本性的數據問題。這是因為,除一級IT供應商外,可審計的產品和排放記錄急劇減少,尤其是在零件和原料網路中。雖然基於PACT的資料交換標準對大規模貿易夥伴很有用,但亞太和南美許多小規模供應商仍然沒有保存可以大規模整合到採購平台中的記錄。 EcoVadis在2026年初推出了一款“產品碳足跡計算器”,支援13種語言,涵蓋包括電子和金屬在內的12個產業部門,旨在解決這一問題,但分散的低級供應商對該計算器的採用情況仍然參差不齊。當缺乏原始數據時,平台被迫依賴基於支出的模型,這削弱了買家對報告結果的信心,並需要更強大的審計追蹤。儘管EcoVadis與Watershed在2026年3月的合作解決了部分問題,但要從根本上緩解這一限制因素,永續IT採購軟體市場仍需在供應商層級的各個層面開展更廣泛的數位化工作。
細分市場分析
到2025年,軟體將佔據68.74%的市場佔有率,成為永續IT採購軟體市場區隔中最大的組成部分。企業青睞基於平台的工具,因為這些工具能夠將ESG評分、供應商入駐、報告儀表板和採購管理整合到一個統一的從尋源到付款的環境中。這一趨勢也反映出廣泛整合的重要性日益凸顯,採購方強烈要求將永續性資料整合到現有的採購流程中,而無需更改核心基礎設施。 EcoVadis透過其在SAP Ariba、Coupa、GEP、Jagger和Ivalua等採購平台的認證整合能力,為此模式提供了支持,從而減少了完全客製化開發的需求。
此外,當多個買家使用同一生態系統時,共用的評估平台減輕了問卷的負擔,因此該領域也受益於供應商網路效應。由此,軟體在永續IT採購軟體市場中保持了最明顯的優勢,同時在規模、客戶維繫和工作流程深度方面均有所提升。服務仍然至關重要,因為採用不同貨幣和ERP架構的多企業採購環境需要實施、資料豐富、諮詢和評估管理等服務。此外,預計到2031年,服務業將以18.65%的複合年成長率成長,因為許多公司不僅需要授權的支持,還需要將平台功能轉化為營運合規流程的支援。隨著市場的成熟,服務組合可能會從廣泛的實施支援轉向資料品質、審計合規性和採購相關的範圍3合規性。
到2025年,雲端將佔據65.12%的市場佔有率,成為永續IT採購軟體市場最大的部署模式。買家之所以青睞SaaS模式,是因為其引進週期短、易於更新監管內容,且無需大規模本地基礎架構即可擴展供應商協作。雲端還支援與供應商網路進行即時數據共用,這對於希望從其一級IT供應商收集更多原始排放數據的公司至關重要。此外,與完全本地部署的系統相比,訂閱模式降低了初始部署的負擔,也符合更廣泛的採購軟體購買行為。
在國防、金融服務和公共採購等領域,本地部署系統仍然發揮著至關重要的作用,因為這些領域對供應商的商業數據和合約記錄的控制往往更為嚴格。隨著許多公司將永續性分析和供應商互動層遷移到雲端,同時將高度敏感的交易資料保留在本地環境中,混合模式預計到2031年將以18.52%的複合年成長率成長。 SAP的2026年永續發展控制塔藍圖直接反映了這項需求,展示了雲端分析如何在大型組織中與本地S/4HANA交易資料整合。這種方法與目前永續IT採購軟體市場的現狀相符,在該市場中,完全遷移到公共雲端並非總是可行,選擇性現代化改造已經在進行中。因此,混合模式的興起並非源自於對雲端的排斥,而是源自於將新的永續性工具與現有採購基礎設施整合的實際需求。
區域分析
到2025年,歐洲將佔34.56%的市場佔有率,成為永續IT採購軟體市場最大的地區。這一領先地位反映了歐洲強大的企業採購基礎設施、複雜且多層次的IT供應鏈,以及德國、英國、法國、義大利和西班牙等國大規模工業、金融和科技公司的集中分佈。德國維持了國內市場最成熟的地位,永續性已正式納入其公共IT採購架構的評估因素,滿足了公共和私營部門對結構化供應商ESG工具的需求。歐盟委員會也注意到德國資訊揭露基礎的廣泛性,強制性的永續性報告正在推動企業軟體的需求。英國透過“IT再利用公益憲章”,在歐盟法規範圍之外,支持“優先再利用”的實踐,從而加強了該地區的循環採購方向。
預計到2031年,亞太地區將以19.12%的複合年成長率成長,成為永續IT採購軟體市場成長最快的區域板塊。這一成長主要得益於資訊揭露壓力、出口主導的供應商需求,以及日本、韓國、澳洲、中國和印度等國本地平台的發展。日本尤為突出,NEC於2025年12月啟動了「供應商入口網站」試點檢驗,推進其整個供應鏈永續性自評估問卷的數位化。該地區在電子和IT製造業中的地位也為其發展提供了助力,催生了對能夠容納眾多小規模分包商和本地化工作流程的供應商互動工具的需求。中國和印度仍然是高成長市場,兩國以出口為導向的製造商擴大收到來自歐洲企業客戶的ESG數據請求,即使在國內資訊揭露法規尚不完善的地區,軟體的普及應用也在加速推進。
到2025年,北美將佔據重要地位,因為大型科技公司、金融機構和聯邦承包商已將供應商永續性要求納入其採購政策。南美仍處於新興階段,巴西主要出口商透過歐洲客戶的報告要求,擴大參與永續IT採購計畫。阿根廷和其他南美國家仍處於早期階段,實施主要集中在跨國公司和大規模出口商。中東和非洲仍處於早期階段,但阿拉伯聯合大公國(阿拉伯聯合大公國)和沙烏地阿拉伯正引領著與其各自的淨零排放和經濟轉型政策相關的區域發展。
其他好處:
- Excel格式的市場預測(ME)表
- 3個月的分析師支持
目錄
第1章:引言
- 研究假設和市場定義
- 調查範圍
第2章:調查方法
第3章執行摘要
第4章 市場狀況
- 市場概覽
- 市場促進因素
- IT採購中範圍3資料可追溯性的監理壓力
- 企業對可審計的供應商ESG數據的需求日益成長
- 從人工採購流程過渡到包含永續性評估功能的流程。
- 透過篩選能源和碳屬性,實現採購主導的成本降低。
- 透過供應商數位化實現永續性調查問卷調查的自動化
- 在硬體升級和設備生命週期計畫中實施與ESG相關的採購
- 市場限制因素
- 二級和三級網路中供應商排放資料的碎片化
- 與傳統ERP和電子採購系統的互通性有限。
- IT團隊之間在採購、永續性和內部資料所有權方面存在爭議。
- 供應商在ESG評估中需要使用多種框架,這給他們帶來了越來越大的壓力。
- 宏觀經濟因素對市場的影響
- 產業價值鏈分析
- 監理情勢
- 技術展望
- 波特五力分析
第5章 市場規模與成長預測
- 按組件
- 軟體
- 服務
- 不同的發展
- 雲
- 現場
- 混合
- 按公司規模
- 大公司
- 小型企業
- 透過使用
- 供應商ESG評估與評分
- 永續採購和採購管理
- 供應商風險監控
- 碳足跡與生命週期評估
- 報告、合規和審計管理
- 循環採購和資產回收計劃
- 按類別分類的IT採購
- 終端用戶計算設備
- 伺服器和資料中心設備
- 網路基礎設施
- 雲端和數位服務
- 軟體和SaaS的採購
- IT周邊設備
- 按地區
- 北美洲
- 美國
- 加拿大
- 墨西哥
- 南美洲
- 巴西
- 阿根廷
- 其他南美國家
- 歐洲
- 德國
- 英國
- 法國
- 義大利
- 西班牙
- 俄羅斯
- 其他歐洲國家
- 亞太地區
- 中國
- 印度
- 日本
- 韓國
- 澳洲
- 其他亞太國家
- 中東和非洲
- 中東
- 沙烏地阿拉伯
- 阿拉伯聯合大公國
- 其他中東國家
- 非洲
- 南非
- 奈及利亞
- 其他非洲國家
- 中東
- 北美洲
第6章 競爭情勢
- 市場集中度
- 策略趨勢
- 市佔率分析
- 公司簡介
- Ivalua Inc.
- Coupa Software Incorporated
- SAP SE
- Jaggaer, LLC
- GEP Worldwide
- Zycus Infotech Pvt. Ltd.
- Oracle Corporation
- EcoVadis SAS
- IntegrityNext GmbH
- Sphera Solutions, Inc.
- Supplier.io, Inc.
- OneTrust, LLC
- Verdikt
- Sedex Information Exchange Limited
- Assent Inc.
- Asuene Inc.
- HICX Solutions Limited
- IPoint-systems gmbh
- Achilles Information Limited
- Greenly
第7章 市場機會與未來展望
According to Mordor Intelligence, the sustainable IT procurement software market size was valued at USD 1.04 billion in 2025 and estimated to grow from USD 1.22 billion in 2026 to reach USD 2.84 billion by 2031, at a CAGR of 18.41% during the forecast period (2026-2031).
This report is Segmented by Component (Software, and Services), Deployment (Cloud, On-Premise, and Hybrid), Enterprise Size (Large Enterprises, and Small and Medium Enterprises), Application (Supplier ESG Assessment and Scoring, and More), IT Procurement Category (End-User Computing Devices, and More), and Geography. The Market Forecasts are Provided in Terms of Value (USD).
Global Sustainable IT Procurement Software Market Trends and Insights
Regulatory Pressure on Scope 3 Data Traceability in IT Procurement
The Sustainable IT Procurement Software Market is being pushed forward by disclosure rules that now require clearer separation between supplier-measured primary data and modeled estimates in Scope 3 reporting, which manual procurement processes cannot handle across layered IT supply chains. The March 2026 Phase 1 progress update from the GHG Protocol also introduced a 95% reporting boundary requirement, reducing the room for de minimis exclusions and increasing the need for direct supplier data collection. The World Business Council for Sustainable Development strengthened this shift when it published the PACT Methodology v3.0 in April 2025, providing trading partners with a clearer framework for exchanging product carbon footprint data across systems. Even after the April 2025 CSRD simplification package narrowed the number of companies in mandatory scope, the value-chain effect continued because large buyers still needed structured ESG data from approved IT suppliers. This combination of regulatory rules, data standards, and supplier reporting pressure is keeping the Sustainable IT Procurement Software Market firmly tied to compliance-led enterprise spending.
Rising Enterprise Demand for Auditable Supplier ESG Data
The Sustainable IT Procurement Software Market is also gaining support from buyers that no longer accept supplier sustainability claims without supporting evidence tied to audits, filings, and outside validation. EcoVadis reported in May 2026 that more than USD 2.5 trillion in global spend was governed through sustainability risk insights on its network, demonstrating both how deeply adoption has become and how much supplier coverage is still missing outside the most connected vendor groups. Enterprises now want platforms that can validate questionnaire responses against audit records and live risk indicators, which moves supplier scoring from a periodic survey exercise into a more permanent procurement control layer. The June 2025 extension of the EcoVadis and Ivalua partnership reflected that need by bringing predictive ESG risk analytics into Ivalua's Risk Center before sourcing teams launch supplier engagement. As a result, the Sustainable IT Procurement Software Market is moving beyond supplier onboarding and deeper into category planning, risk screening, and supplier development programs.
Fragmented Supplier Emissions Data Across Tier 2 and Tier 3 Networks
The Sustainable IT Procurement Software Market still faces a fundamental data problem because auditable product and emissions records decline sharply beyond first-tier IT suppliers, especially in component and raw-material networks. PACT-based exchange standards help larger trading partners, but many smaller suppliers in Asia-Pacific and South America do not yet maintain records that can be pulled into procurement platforms at scale. EcoVadis responded in early 2026 with a Product Carbon Footprint Calculator available in 13 languages and across 12 industrial sectors, including electronics and metals, yet adoption across fragmented lower-tier suppliers remains uneven. When primary data is missing, platforms fall back on spend-based models, which weakens buyers' confidence in reported results and leaves them in need of stronger audit trails. The March 2026 EcoVadis and Watershed partnership addressed part of this issue, but the Sustainable IT Procurement Software Market still depends on a much wider digitalization effort across supplier tiers before this restraint meaningfully eases.
Other drivers and restraints analyzed in the detailed report include:
- Shift From Manual Procurement Workflows to Embedded Sustainability Scoring
- Procurement-Led Cost Avoidance Through Energy and Carbon Attribute Filtering
- Limited Interoperability With Legacy ERP and E-Procurement Stacks
For complete list of drivers and restraints, kindly check the Table Of Contents.
Segment Analysis
Software held 68.74% share in 2025, making it the largest component in the Sustainable IT Procurement Software Market at the segment level. Enterprises favored platform-based tools because they could place ESG scoring, supplier onboarding, reporting dashboards, and sourcing controls inside a connected source-to-pay environment. That preference also reflected the growing value of integration breadth, as buyers increasingly wanted sustainability data to be incorporated into existing procurement events without changing core infrastructure. EcoVadis supported this model with certified integrations across procurement platforms such as SAP Ariba, Coupa, GEP, Jaggaer, and Ivalua, which reduced the need for fully custom builds.
The same segment benefited from supplier-side network effects because shared assessment platforms reduced questionnaire fatigue when multiple buyers relied on the same ecosystem. As a result, software retained the clearest advantage in the Sustainable IT Procurement Software Market because scale, retention, and workflow depth improved together. Services remain important because implementation, data enrichment, consulting, and managed assessment work are necessary in multi-entity procurement environments with different currencies and ERP stacks. Services are also projected to expand at a 18.65% CAGR through 2031, as many enterprises still need help turning platform capabilities into operational compliance processes rather than simply buying licenses. Over time, that services mix is likely to shift away from broad rollout support and toward data quality, audit readiness, and procurement-specific Scope 3 support as the market matures.
Cloud accounted for 65.12% of the market in 2025, making it the largest deployment model in the Sustainable IT Procurement Software Market. Buyers favored SaaS delivery because deployment cycles were faster, regulatory content could be updated more easily, and supplier engagement could scale without the need for heavy local infrastructure. Cloud also supported live data sharing with supplier networks, which was important as enterprises sought to gather more primary emissions data from first-tier IT vendors. The model fit broader procurement software buying behavior as well, since subscription delivery reduced the upfront deployment burden compared with fully on-premises systems.
On-premise systems remained relevant in defense, financial services, and public procurement, where supplier commercial data and contract records were often under stricter control. Hybrid is projected to expand at a 18.52% CAGR through 2031, as many enterprises move sustainability analytics and supplier engagement layers to the cloud while keeping sensitive transaction data in on-premises environments. SAP's 2026 roadmap for Sustainability Control Tower directly reflected this demand by showing how cloud analytics could work with on-premise S/4HANA transaction data in large organizations. That approach fits the current stage of the Sustainable IT Procurement Software Market, where full public cloud migration is not always realistic but selective modernization is already underway. Hybrid momentum is therefore tied less to a rejection of cloud and more to the practical need to connect new sustainability tools with existing procurement infrastructure.
Complete Report Scope:
- By Component
- Software
- Services
- By Deployment
- Cloud
- On-Premise
- Hybrid
- By Enterprise Size
- Large Enterprises
- Small and Medium Enterprises
- By Application
- Supplier ESG Assessment and Scoring
- Sustainable Sourcing and Procurement Management
- Supplier Risk Monitoring
- Carbon Footprint and Lifecycle Assessment
- Reporting, Compliance and Audit Management
- Circular Procurement and Asset Reuse Planning
- By IT Procurement Category
- End-User Computing Devices
- Servers and Data Center Equipment
- Network Infrastructure
- Cloud and Digital Services
- Software and SaaS Procurement
- IT Peripherals
- By Geography
- North America
- United States
- Canada
- Mexico
- South America
- Brazil
- Argentina
- Rest of South America
- Europe
- Germany
- United Kingdom
- France
- Italy
- Spain
- Russia
- Rest of Europe
- Asia-Pacific
- China
- India
- Japan
- South Korea
- Australia
- Rest of Asia-Pacific
- Middle East and Africa
- Middle East
- Saudi Arabia
- United Arab Emirates
- Rest of Middle East
- Africa
- South Africa
- Nigeria
- Rest of Africa
- Middle East
- North America
Geography Analysis
Europe held 34.56% share in 2025, giving the region the largest position in the Sustainable IT Procurement Software Market by geography. Its lead reflected strong enterprise procurement infrastructure, complex multi-tier IT supply chains, and a high concentration of large industrial, financial, and technology companies across Germany, the United Kingdom, France, Italy, and Spain. Germany remained the deepest national market because public IT procurement frameworks already incorporate sustainability as a formal evaluation factor, supporting both public and private demand for structured supplier ESG tools. The European Commission also pointed to a large disclosure base in Germany, where mandatory sustainability reporting requirements sustain enterprise software demand. The United Kingdom reinforced the region's circular procurement direction through its IT Reuse for Good Charter, which supported reuse-first practices even outside the EU regulatory perimeter.
Asia-Pacific is projected to expand at a 19.12% CAGR through 2031, making it the fastest-growing regional block in the Sustainable IT Procurement Software Market. Growth is supported by disclosure pressure, export-led supplier demands, and local platform development across Japan, South Korea, Australia, China, and India. Japan stands out because NEC began pilot validation of its Supplier Portal in December 2025 to digitalize sustainability self-assessment questionnaires across supply chains. The region also benefits from its role in electronics and IT manufacturing, requiring supplier engagement tools that can work across many smaller sub-tier vendors and localized workflows. China and India remain high-growth markets because export-oriented manufacturers in both countries are receiving more ESG data requests from European enterprise customers, pulling software adoption forward even where domestic disclosure rules are less mature.
North America held a substantial position in 2025 as large technology companies, financial institutions, and federal contractors were already embedding supplier sustainability requirements into procurement policies. South America remained an emerging region, with large Brazilian exporters being drawn into sustainable IT procurement programs through customer reporting requirements from Europe. Argentina and the rest of South America were still early-stage markets, with adoption concentrated mainly among multinationals and larger exporters. The Middle East and Africa stayed at an earlier adoption stage, though the United Arab Emirates and Saudi Arabia led regional deployments tied to national net-zero and economic transformation agendas.
- Ivalua Inc.
- Coupa Software Incorporated
- SAP SE
- Jaggaer, LLC
- GEP Worldwide
- Zycus Infotech Pvt. Ltd.
- Oracle Corporation
- EcoVadis SAS
- IntegrityNext GmbH
- Sphera Solutions, Inc.
- Supplier.io, Inc.
- OneTrust, LLC
- Verdikt
- Sedex Information Exchange Limited
- Assent Inc.
- Asuene Inc.
- HICX Solutions Limited
- IPoint-systems gmbh
- Achilles Information Limited
- Greenly
Additional Benefits:
- The market estimate (ME) sheet in Excel format
- 3 months of analyst support
TABLE OF CONTENTS
1 INTRODUCTION
- 1.1 Study Assumptions and Market Definition
- 1.2 Scope of the Study
2 RESEARCH METHODOLOGY
3 EXECUTIVE SUMMARY
4 MARKET LANDSCAPE
- 4.1 Market Overview
- 4.2 Market Drivers
- 4.2.1 Regulatory Pressure on Scope 3 Data Traceability in IT Procurement
- 4.2.2 Rising Enterprise Demand for Auditable Supplier ESG Data
- 4.2.3 Shift From Manual Procurement Workflows to Embedded Sustainability Scoring
- 4.2.4 Procurement-Led Cost Avoidance Through Energy and Carbon Attribute Filtering
- 4.2.5 Supplier Digitalization Enabling Automated Sustainability Questionnaires
- 4.2.6 ESG-Linked Sourcing in Hardware Refresh and Device Lifecycle Programs
- 4.3 Market Restraints
- 4.3.1 Fragmented Supplier Emissions Data Across Tier 2 and Tier 3 Networks
- 4.3.2 Limited Interoperability With Legacy ERP and e-Procurement Stacks
- 4.3.3 Internal Data Ownership Conflicts Between Procurement, Sustainability, and IT Teams
- 4.3.4 High Supplier Response Fatigue in Multi-Framework ESG Assessments
- 4.4 Impact of Macroeconomic Factors on the Market
- 4.5 Industry Value-Chain Analysis
- 4.6 Regulatory Landscape
- 4.7 Technological Outlook
- 4.8 Porter's Five Forces Analysis
- 4.8.1 Threat of New Entrants
- 4.8.2 Bargaining Power of Suppliers
- 4.8.3 Bargaining Power of Buyers
- 4.8.4 Threat of Substitutes
- 4.8.5 Intensity Of Competitive Rivalry
5 MARKET SIZE AND GROWTH FORECASTS (VALUE)
- 5.1 By Component
- 5.1.1 Software
- 5.1.2 Services
- 5.2 By Deployment
- 5.2.1 Cloud
- 5.2.2 On-Premise
- 5.2.3 Hybrid
- 5.3 By Enterprise Size
- 5.3.1 Large Enterprises
- 5.3.2 Small and Medium Enterprises
- 5.4 By Application
- 5.4.1 Supplier ESG Assessment and Scoring
- 5.4.2 Sustainable Sourcing and Procurement Management
- 5.4.3 Supplier Risk Monitoring
- 5.4.4 Carbon Footprint and Lifecycle Assessment
- 5.4.5 Reporting, Compliance and Audit Management
- 5.4.6 Circular Procurement and Asset Reuse Planning
- 5.5 By IT Procurement Category
- 5.5.1 End-User Computing Devices
- 5.5.2 Servers and Data Center Equipment
- 5.5.3 Network Infrastructure
- 5.5.4 Cloud and Digital Services
- 5.5.5 Software and SaaS Procurement
- 5.5.6 IT Peripherals
- 5.6 By Geography
- 5.6.1 North America
- 5.6.1.1 United States
- 5.6.1.2 Canada
- 5.6.1.3 Mexico
- 5.6.2 South America
- 5.6.2.1 Brazil
- 5.6.2.2 Argentina
- 5.6.2.3 Rest of South America
- 5.6.3 Europe
- 5.6.3.1 Germany
- 5.6.3.2 United Kingdom
- 5.6.3.3 France
- 5.6.3.4 Italy
- 5.6.3.5 Spain
- 5.6.3.6 Russia
- 5.6.3.7 Rest of Europe
- 5.6.4 Asia-Pacific
- 5.6.4.1 China
- 5.6.4.2 India
- 5.6.4.3 Japan
- 5.6.4.4 South Korea
- 5.6.4.5 Australia
- 5.6.4.6 Rest of Asia-Pacific
- 5.6.5 Middle East and Africa
- 5.6.5.1 Middle East
- 5.6.5.1.1 Saudi Arabia
- 5.6.5.1.2 United Arab Emirates
- 5.6.5.1.3 Rest of Middle East
- 5.6.5.2 Africa
- 5.6.5.2.1 South Africa
- 5.6.5.2.2 Nigeria
- 5.6.5.2.3 Rest of Africa
- 5.6.5.1 Middle East
- 5.6.1 North America
6 COMPETITIVE LANDSCAPE
- 6.1 Market Concentration
- 6.2 Strategic Moves
- 6.3 Market Share Analysis
- 6.4 Company Profiles (includes Global Level Overview, Market Level Overview, Core Segments, Financials as available, Strategic Information, Market Rank/Share, Products and Services, Recent Developments)
- 6.4.1 Ivalua Inc.
- 6.4.2 Coupa Software Incorporated
- 6.4.3 SAP SE
- 6.4.4 Jaggaer, LLC
- 6.4.5 GEP Worldwide
- 6.4.6 Zycus Infotech Pvt. Ltd.
- 6.4.7 Oracle Corporation
- 6.4.8 EcoVadis SAS
- 6.4.9 IntegrityNext GmbH
- 6.4.10 Sphera Solutions, Inc.
- 6.4.11 Supplier.io, Inc.
- 6.4.12 OneTrust, LLC
- 6.4.13 Verdikt
- 6.4.14 Sedex Information Exchange Limited
- 6.4.15 Assent Inc.
- 6.4.16 Asuene Inc.
- 6.4.17 HICX Solutions Limited
- 6.4.18 IPoint-systems gmbh
- 6.4.19 Achilles Information Limited
- 6.4.20 Greenly
7 MARKET OPPORTUNITIES AND FUTURE OUTLOOK
- 7.1 White-space and Unmet-Need Assessment

 2026-2030年全球貨運採購軟體市場
 採購軟體市場規模、佔有率和趨勢分析報告:按軟體類型、部署模式、企業規模、最終用途、地區和細分市場預測(2026-2033 年)
 採購到付款市場規模、佔有率、成長和全球行業分析:按類型和應用、區域的洞察,2026-2034年的預測
 2026年全球採購軟體市場報告
 建築採購軟體市場:依採購類型、部署模式、組織規模和應用程式分類-2026-2032年全球預測採購軟體市場規模、佔有率、成長率和全球產業分析:按類型、應用和地區的洞察,2026-2034年的預測
 採購軟體:市場佔有率分析、產業趨勢與統計、成長預測(2026-2031)
 物聯網採購市場規模、佔有率和成長分析:按組件、應用、最終用戶產業和地區分類 - 2026-2033 年產業預測
 採購軟體市場分析及預測(至2035年):按類型、產品類型、服務、技術、組件、應用、流程、部署類型、最終用戶和功能分類
 採購軟體市場-全球產業規模、佔有率、趨勢、機會及預測(按部署類型、軟體類型、組織規模、垂直產業、地區和競爭格局分類,2021-2031年)