


 |
市場調查報告書
商品編碼
2044212
採購軟體:市場佔有率分析、產業趨勢與統計、成長預測(2026-2031)Procurement Software - Market Share Analysis, Industry Trends & Statistics, Growth Forecasts (2026 - 2031) |
||||||

※ 本網頁內容可能與最新版本有所差異。詳細情況請與我們聯繫。
預計採購軟體市場將從 2025 年的 98.1 億美元和 2026 年的 107.4 億美元成長到 2031 年的 171.1 億美元,2026 年至 2031 年的年複合成長率(CAGR)為 9.76%。
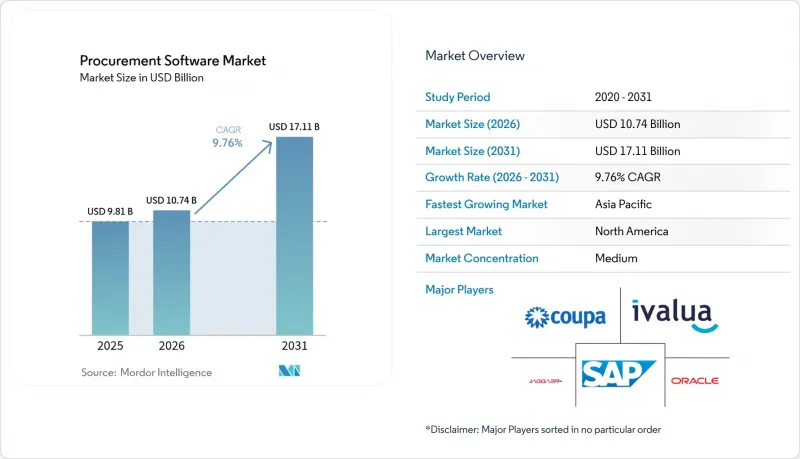
需求的核心在於結合雲端原生架構、生成式人工智慧輔助駕駛和代幣化跨境支付基礎設施的自主工作流程,這些要素在降低服務交付成本的同時,也加快了決策週期。雲端採用正逐漸成為主流,因為高彈性的SaaS平台能夠大幅降低資料中心開銷,提供支出即時可見性,並為所有租戶實現近乎即時的功能更新。醫療保健行業的聯合採購組織透過將採購決策與基於價值的報銷方案相結合,擴大了終端用戶的採用率;而中小企業則透過免費增值計劃和嵌入式金融服務進入市場,將資本投資轉化為營運支出。從區域來看,成熟的北美市場支撐著當前的收入,但亞太地區正經歷著更快的成長,這主要得益於公共部門強制性電子採購和雲端的快速普及。
全球採購軟體市場趨勢與洞察
端到端採購工作流程自動化
企業正在將採購訂單、核准、供應商尋源、合約簽署和結算整合到一個統一的平台,從而消除人工交接,並將週期時間縮短一半。機器人流程自動化 (RPA) 現在處理大部分採購訂單,使人力資源能夠重新分配到供應商關係管理 (SRM) 方面。因此,受原料價格波動影響的行業營運成本降低了近 20%,而早期採用者則能夠透過協商批量折扣來保護價格波動期間的利潤率。即時儀錶板允許在數小時內重新分配預算,即使在發生中斷的情況下也是如此。這項功能在 2025 年半導體短缺期間發揮了至關重要的作用。已實現這種自動化水準的企業表示,供應商入駐速度顯著加快,並且對單一來源風險的抵禦能力也得到了增強。
ERP系統與電子採購系統的無縫整合
核心ERP系統與採購套件之間的雙向資料流消除了主資料重複,減少了發票差異,並縮短了每月結算週期。領先供應商提供的即用型適配器無需自訂編碼即可同步合約條款、科目代碼和稅務數據,從而降低了運營多個套件的公司的整合風險。此外,中間件整合了營運多個ERP實例的集團公司的數據,提供統一的支出分析,可視化異常支出並支援批量折扣的使用。已完成無縫整合的公司通常報告稱,其整個採購團隊的生產力提高了兩位數,因為採購人員可以在熟悉的ERP介面中完成交易。這種整合的採用最終降低了轉換成本,並提高了供應商合約續約率。
整合舊有系統的複雜性
對於擁有老舊且高度客製化ERP程式碼庫的公司而言,將採購套件投入運作需要數月的映射、測試和修復工作。在傳統的SAP或Oracle環境中,自訂擴充功能會造成脆弱的依賴關係,這些依賴關係會在升級過程中失效,從而增加預算並延遲投資回報。資料品質問題,例如重複的供應商記錄,會進一步阻礙資料同步,通常會導致平台部署延遲,直到並行ERP現代化改造完成。儘管供應商現在提供預先認證的連接器來承擔部分整合風險,但高度客製化的部署仍然會超出最初的計劃。這些障礙使得整合複雜性成為數位化採購項目停滯不前的最常見原因。
細分市場分析
到2025年,雲端技術將佔據採購軟體市場67.92%的佔有率。這反映出企業傾向於選擇無需資本投入即可因應流量高峰的彈性容量。該領域9.81%的複合年成長率表明,多租戶SaaS平台正在將人工智慧模型的訓練成本分攤到數千個客戶身上,使得即使對於中型企業而言,自主發票匹配和預測風險評分也變得經濟可行。在國防和金融業,由於資料主權法規限制了外部託管,本地部署仍然普遍存在,但混合架構正擴大將本地交易處理與集中式分析相結合。邊緣運算在網路環境不穩定的地區運營的零售商中也越來越受歡迎,因為它能夠降低延遲,並確保即使在網路故障期間交易也能持續進行。
採購軟體市場正受益於雲端供應商每隔幾小時而非每季進行一次更新,從而能夠快速回應監管變化,例如強制性電子帳單和碳排放報告法規。相較之下,本地部署的升級週期長達 6-12 個月,導致新功能獲取延遲,整體擁有成本 (TCO) 增加。即使是受監管的企業也在試行「屏蔽式 SaaS」模式,這種模式在保持多租戶經濟效益的同時,還能加密敏感字段,這表明本地部署多年來建立的強大地位正在逐漸被削弱。綜上所述,這些趨勢表明,在可預見的未來,雲端的主導地位將得到鞏固。
預計到2025年,製造業將引領整個產業,佔銷售額的21.63%。這得益於複雜的材料清單(BOM)管理和準時制(JIT)庫存策略,這些策略需要與供應商密切合作。然而,成長最快的行業是醫療產業,預計其複合年成長率將達到9.79%。這是因為醫院將採購成本的降低與基於價值的報銷指標掛鉤,因此,採購成本每降低1%至關重要,直接影響收入。與電子健康記錄的流程級整合使臨床醫生能夠對植入的使用情況進行基準測試,並根據證據進行價格談判,從而使整形外科支出降低了兩位數。集團採購組織正在增強採購能力,並幫助醫院根據感染控制和再入院率等指標評估供應商的績效。
在其他領域,零售和電商平台正在實現關稅計算和海關文件產生的自動化,從而減少跨境摩擦。同時,銀行、金融和保險(BFSI)機構正在部署軟體,以滿足全球資本監管規定的第三方風險義務。政府機構正在採用電子採購來滿足透明度和可訪問性要求,而IT和電信公司則正在利用支出分析來遏制SaaS訂閱的無序擴張。憑藉構建特定產業工作流程的能力,例如建設產業的承包商合規性檢查清單,垂直行業SaaS供應商能夠佔據水平套件所忽略的未開發領域。因此,採購軟體市場不僅在企業規模上不斷擴大,而且在產業特定性深度上也不斷提升。
這份《採購軟體市場報告》按部署類型(雲端和本地部署)、最終用戶行業(零售、製造、運輸物流、醫療保健、銀行、金融服務和保險、IT和電信等)、組織規模(大型企業和中小企業)、應用模組(電子尋源、合約管理、支出分析等)、組件(軟體和服務)以及地區進行細分。市場預測以美元計價。
區域分析
預計到2025年,北美將佔全球收入的33.64%,這主要得益於成熟的ERP生態系統、第14091號行政命令強制供應商多元化以及早期採用人工智慧驅動的生成式採購協同工具。聯邦政府要求合約資料必須機器可讀,這推動了私人企業採用相關平台,而加拿大企業也在轉型以符合數位無障礙法規。出口導向的墨西哥製造商正在實施軟體以實現美墨加協定(USMCA)原產地證書的自動化,這凸顯了貿易協定如何促進數位化採購。
亞太地區以9.87%的複合年成長率(CAGR)位居全球成長之首,這主要得益於印度GeM等政府入口網站以及中國集中式公共採購改革(強制規定超過一定金額的採購必須採用電子採購)。日本正大力投資支持API的政府系統,而澳洲已頒布《現代奴隸制法案》,要求企業對其供應鏈中是否有強迫勞動風險進行審計。因此,採購平台已成為ESG合規的前沿領域。企業正在徹底跨越傳統基礎設施,採用雲端原生套件,這些套件從一開始就提供在地化的語言包、稅收規則和支付整合功能。
歐洲正努力在北美市場的成熟與亞太地區的高速成長之間尋求平衡。歐盟計劃強制實施電子表格(eForms),這將規範合約公告,降低跨境競標成本,並有利於採用內建模式支援的平台。綠色新政計劃要求在整個生命週期內碳計量,強制要求使用軟體收集排放數據,並在競標評估期間呈現「從搖籃到大門」的碳足跡。德國的供應鏈實質審查法正在擴大人權審計的範圍,將一級供應商納入其中,歐盟其他地區也在討論類似的立法,這將促進合規主導的電子採購。南美和中東市場仍在發展中,但隨著巴西和沙烏地阿拉伯部署國家電子採購入口網站,這些市場正在加速成長。同時,非洲許多地區仍然面臨溝通障礙,這阻礙了電子採購的廣泛應用。
其他好處:
- Excel格式的市場預測(ME)表
- 3個月的分析師支持
目錄
第1章:引言
- 研究假設和市場定義
- 調查範圍
第2章:調查方法
第3章執行摘要
第4章 市場狀況
- 市場概覽
- 市場促進因素
- 端到端採購工作流程自動化
- ERP系統與電子採購系統的無縫整合
- 遷移到雲端原生平台
- 生成式人工智慧輔助駕駛加速自主採購
- 代幣化的B2B支付基礎設施降低了跨國成本。
- 與碳核算 API 相關的綠色政府採購
- 市場限制因素
- 與舊有系統整合的複雜性
- 對資料安全和監管合規性的擔憂
- 人工智慧支出分析中演算法偏見的風險
- 顛覆性金融科技公司的進入削弱了SaaS的定價權。
- 價值鏈分析
- 監理情勢
- 波特五力分析
- 供應商的議價能力
- 買方的議價能力
- 新進入者的威脅
- 替代品的威脅
- 競爭公司之間的競爭
- 宏觀經濟因素對市場的影響
第5章 市場規模與成長預測
- 不同的發展
- 雲
- 現場
- 按最終用戶行業分類
- 零售
- 製造業
- 運輸/物流
- 衛生保健
- BFSI
- 資訊科技/通訊
- 政府/公共部門
- 其他終端用戶產業
- 按組織規模
- 大公司
- 中小企業
- 透過應用模組
- 電子採購
- 合約管理
- 支出分析與分析
- 從採購到付款
- 供應商關係管理
- 目錄管理
- 按組件
- 軟體
- 服務
- 按地區
- 北美洲
- 美國
- 加拿大
- 墨西哥
- 南美洲
- 巴西
- 阿根廷
- 南美洲其他地區
- 歐洲
- 德國
- 英國
- 法國
- 義大利
- 西班牙
- 其他歐洲國家
- 亞太地區
- 中國
- 日本
- 韓國
- 印度
- 澳洲
- 亞太其他地區
- 中東
- 沙烏地阿拉伯
- 阿拉伯聯合大公國
- 其他中東國家
- 非洲
- 南非
- 埃及
- 其他非洲地區
- 北美洲
第6章 競爭情勢
- 市場集中度
- 策略趨勢
- 市佔率分析
- 公司簡介
- SAP SE
- Coupa Software Incorporated
- Oracle Corporation
- Microsoft Corporation
- Jaggaer, LLC
- Infor Inc.(GT Nexus)
- Ivalua Inc.
- GEP Worldwide(GEP Solutions Private Ltd.)
- Basware Oyj
- Proactis Holdings Limited
- Zycus Incorporated
- Epicor Software Corporation
- Workday Inc.
- Tradeshift Holdings Inc.
- SynerTrade(Econocom Digital Solutions GmbH)
- Corcentric LLC(Determine)
- Rosslyn Data Technologies PLC
- Proxima Group Ltd.
- Scout RFP LLC(Workday)
- Mercateo AG
- Prospend Pty Ltd.
第7章 市場機會與未來展望
The procurement software market size is projected to expand from USD 9.81 billion in 2025 and USD 10.74 billion in 2026 to USD 17.11 billion by 2031, registering a CAGR of 9.76% between 2026 to 2031.
Demand pivots around autonomous workflows that combine cloud-native architectures, generative-AI copilots, and tokenized cross-border payment rails, each lowering cost-to-serve while accelerating decision cycles. Cloud deployment dominates because elastic SaaS platforms slash data-center overhead, give real-time spend visibility, and update features for every tenant in near-real time. End-user uptake broadens as healthcare group purchasing organizations link sourcing decisions to value-based reimbursement, while SMEs gain entry through freemium tiers and embedded finance that convert capital expense into operating expense. Regionally, North American maturity anchors current revenue, yet Asia Pacific outpaces on growth as public e-procurement mandates and leapfrog cloud adoption converge.
Global Procurement Software Market Trends and Insights
Automating End-to-End Procurement Workflows
Organizations collapse requisition, approval, supplier discovery, contracting, and invoicing into a single platform that removes manual handoffs and prunes cycle time by up to half. Robotic process automation now drafts the bulk of purchase orders, reallocating human effort toward supplier relationship management. The resulting operating-expense reduction approaches 20% in industries exposed to volatile input prices, giving early adopters headroom to negotiate volume discounts that shield margins during commodity swings. Real-time dashboards redirect budgets within hours when disruptions hit, a capability that proved decisive during the 2025 semiconductor shortage. Firms that achieve this level of automation also report materially faster supplier onboarding, strengthening resiliency against single-source risk.
Seamless ERP and e-Procurement Integration
Bidirectional data flow between core ERP systems and procurement suites eliminates duplicate master records, curbing invoice discrepancies and shortening monthly close cycles. Pre-built adapters from leading vendors now synchronize contract terms, chart-of-accounts codes, and tax data without custom code, shrinking integration risk for multisuite enterprises. Middleware further federates data for conglomerates running multiple ERP instances, enabling unified spend analytics that surface maverick spend and unlock volume-discount leverage. Firms completing clean integrations often cite double-digit productivity gains across procurement staff because requisitioners transact from within the familiar ERP interface. This integration stickiness, in turn, raises switching costs and underpins vendor renewal rates.
Legacy-System Integration Complexity
Enterprises with aging, highly customized ERP codebases require months of mapping, testing, and remediation before procurement suites can go live. Custom extensions in legacy SAP or Oracle environments create brittle dependencies that break during upgrades, inflating budgets and delaying ROI. Data-quality problems such as duplicate supplier records further hamper synchronization, often forcing businesses to postpone platform rollouts until parallel ERP modernization concludes. Vendors now offer pre-certified connectors that shift part of the integration risk onto themselves, yet highly tailored deployments still overrun initial schedules. These hurdles make integration complexity the single most cited reason for stalled digital-procurement programs.
Other drivers and restraints analyzed in the detailed report include:
- Migration to Cloud-Native Platforms
- Generative AI Copilots Accelerating Autonomous Sourcing
- Data-Security and Regulatory Compliance Concerns
For complete list of drivers and restraints, kindly check the Table Of Contents.
Segment Analysis
Cloud deployment captured 67.92% of the procurement software market share in 2025, reflecting enterprise preference for elastic capacity that absorbs traffic spikes without capital expense. The segment's 9.81% CAGR underscores how multi-tenant SaaS platforms spread AI model-training costs across thousands of customers, making autonomous invoice matching and predictive risk scoring financially viable for mid-size firms. On-premise installations persist in defense and banking, where data-sovereignty rules limit external hosting, but hybrid architectures increasingly bridge local transaction processing with centralized analytics. Edge computing also gains favor among retailers operating in connectivity-challenged regions, lowering latency and ensuring continuous transaction flow during network outages.
The procurement software market benefits when cloud vendors roll updates in hours rather than quarters, enabling rapid response to regulatory changes such as electronic-invoice mandates or carbon-reporting rules. Conversely, on-premise buyers face six-to-twelve-month upgrade cycles that delay access to new functionality and inflate total cost of ownership. Even regulated entities are piloting shielded SaaS models that encrypt sensitive fields yet retain multi-tenant economics, signaling a gradual erosion of the long-standing on-premise stronghold. Taken together, these trends reinforce cloud's leadership position for the foreseeable horizon.
Manufacturing led 2025 revenue with 21.63% share, underpinned by complex bill-of-materials management and just-in-time inventory strategies that reward tight supplier coordination. Yet healthcare is the fastest riser, tracking a 9.79% CAGR as hospitals tie procurement savings to value-based reimbursement metrics, making every percentage point of supply cost a bottom-line imperative. Procedure-level integration with electronic health records allows clinicians to benchmark implant utilization and negotiate evidence-based pricing, cutting orthopedic spend by double digits. Group-purchasing organizations amplify buying power and help hospitals adjudicate supplier performance on infection-control or readmission measures.
Elsewhere, retail and e-commerce platforms automate tariff calculations and customs documentation to mitigate border friction, while BFSI institutions deploy software to meet third-party risk obligations under global capital rules. Government agencies adopt e-procurement to meet transparency and accessibility mandates, and IT-telecom firms use spend analytics to tame SaaS subscription sprawl. The ability to configure sector-specific workflows-such as subcontractor compliance checklists for construction-positions vertical SaaS vendors to seize whitespace overlooked by horizontal suites. Consequently, the procurement software market broadens not only by enterprise size but also by depth of industry fit.
The Procurement Software Market Report is Segmented by Deployment (Cloud and On-Premise), End-User Industry (Retail, Manufacturing, Transportation and Logistics, Healthcare, BFSI, IT and Telecom, and More), Organization Size (Large Enterprises and SMEs), Application Module (e-Sourcing, Contract Management, Spend Analysis, and More), Component (Software and Services), and Geography. The Market Forecasts are Provided in Value (USD).
Geography Analysis
North America generated 33.64% of 2025 revenue, thanks to mature ERP ecosystems, supplier-diversity mandates under Executive Order 14091, and early adoption of generative-AI-enabled procurement copilots. Federal transparency requirements that demand machine-readable contract data drive platform penetration across civilian agencies, while Canadian entities migrate to comply with digital-accessibility rules. Mexico's export-focused manufacturers embed software to automate United States-Mexico-Canada Agreement origin certifications, underscoring how trade pacts can catalyze digital procurement.
Asia Pacific advances at a 9.87% CAGR, the fastest worldwide, propelled by government portals such as India's GeM and China's centralized public-procurement reforms that oblige electronic sourcing above specified thresholds. Japan allocates substantial funds to API-ready government systems, and Australia applies modern slavery legislation that forces businesses to audit supply chains for forced-labor risk, bringing procurement platforms to the front line of ESG compliance. Companies leapfrog legacy infrastructure entirely, opting for cloud-native suites that offer localized language packs, tax rules, and payment integrations from day one.
Europe balances North American maturity with Asia Pacific's growth velocity. The European Union's forthcoming eForms mandates standardize contract notices, cutting cross-border tender costs and favoring platforms with built-in schema support. Green-deal initiatives require lifecycle carbon accounting, compelling software to ingest emissions data and present cradle-to-gate footprints during bid evaluation. Germany's supply-chain due-diligence act extends human-rights audits to first-tier suppliers, and similar legislation is debated across the bloc, reinforcing compliance-driven adoption. South America and Middle East markets remain nascent but gather momentum as Brazil and Saudi Arabia roll out national e-procurement portals, while much of Africa still contends with connectivity gaps that delay widescale deployment.
- SAP SE
- Coupa Software Incorporated
- Oracle Corporation
- Microsoft Corporation
- Jaggaer, LLC
- Infor Inc. (GT Nexus)
- Ivalua Inc.
- GEP Worldwide (GEP Solutions Private Ltd.)
- Basware Oyj
- Proactis Holdings Limited
- Zycus Incorporated
- Epicor Software Corporation
- Workday Inc.
- Tradeshift Holdings Inc.
- SynerTrade (Econocom Digital Solutions GmbH)
- Corcentric LLC (Determine)
- Rosslyn Data Technologies PLC
- Proxima Group Ltd.
- Scout RFP LLC (Workday)
- Mercateo AG
- Prospend Pty Ltd.
Additional Benefits:
- The market estimate (ME) sheet in Excel format
- 3 months of analyst support
TABLE OF CONTENTS
1 INTRODUCTION
- 1.1 Study Assumptions and Market Definition
- 1.2 Scope of the Study
2 RESEARCH METHODOLOGY
3 EXECUTIVE SUMMARY
4 MARKET LANDSCAPE
- 4.1 Market Overview
- 4.2 Market Drivers
- 4.2.1 Automating End-to-End Procurement Workflows
- 4.2.2 Seamless ERP and e-Procurement Integration
- 4.2.3 Migration to Cloud-Native Platforms
- 4.2.4 Generative AI Copilots Accelerating Autonomous Sourcing
- 4.2.5 Tokenized B2B Payment Rails Lowering Cross-Border Costs
- 4.2.6 Green Public Procurement Linked to Carbon Accounting APIs
- 4.3 Market Restraints
- 4.3.1 Legacy-System Integration Complexity
- 4.3.2 Data-Security and Regulatory Compliance Concerns
- 4.3.3 Algorithmic Bias Risks in AI Spend Analytics
- 4.3.4 Disruptive FinTech Entrants Eroding SaaS Price Leverage
- 4.4 Value Chain Analysis
- 4.5 Regulatory Landscape
- 4.6 Porter's Five Forces Analysis
- 4.6.1 Bargaining Power of Suppliers
- 4.6.2 Bargaining Power of Buyers
- 4.6.3 Threat of New Entrants
- 4.6.4 Threat of Substitutes
- 4.6.5 Competitive Rivalry
- 4.7 Impact of Macroeconomic Factors on the Market
5 MARKET SIZE AND GROWTH FORECASTS (VALUE)
- 5.1 By Deployment
- 5.1.1 Cloud
- 5.1.2 On-Premise
- 5.2 By End-User Industry
- 5.2.1 Retail
- 5.2.2 Manufacturing
- 5.2.3 Transportation and Logistics
- 5.2.4 Healthcare
- 5.2.5 BFSI
- 5.2.6 IT and Telecom
- 5.2.7 Government and Public Sector
- 5.2.8 Other End-User Industries
- 5.3 By Organization Size
- 5.3.1 Large Enterprises
- 5.3.2 Small and Medium Enterprises (SMEs)
- 5.4 By Application Module
- 5.4.1 e-Sourcing
- 5.4.2 Contract Management
- 5.4.3 Spend Analysis and Analytics
- 5.4.4 Procure-to-Pay
- 5.4.5 Supplier Relationship Management
- 5.4.6 Catalog Management
- 5.5 By Component
- 5.5.1 Software
- 5.5.2 Services
- 5.6 By Geography
- 5.6.1 North America
- 5.6.1.1 United States
- 5.6.1.2 Canada
- 5.6.1.3 Mexico
- 5.6.2 South America
- 5.6.2.1 Brazil
- 5.6.2.2 Argentina
- 5.6.2.3 Rest of South America
- 5.6.3 Europe
- 5.6.3.1 Germany
- 5.6.3.2 United Kingdom
- 5.6.3.3 France
- 5.6.3.4 Italy
- 5.6.3.5 Spain
- 5.6.3.6 Rest of Europe
- 5.6.4 Asia-Pacific
- 5.6.4.1 China
- 5.6.4.2 Japan
- 5.6.4.3 South Korea
- 5.6.4.4 India
- 5.6.4.5 Australia
- 5.6.4.6 Rest of Asia-Pacific
- 5.6.5 Middle East
- 5.6.5.1 Saudi Arabia
- 5.6.5.2 United Arab Emirates
- 5.6.5.3 Rest of Middle East
- 5.6.6 Africa
- 5.6.6.1 South Africa
- 5.6.6.2 Egypt
- 5.6.6.3 Rest of Africa
- 5.6.1 North America
6 COMPETITIVE LANDSCAPE
- 6.1 Market Concentration
- 6.2 Strategic Moves
- 6.3 Market Share Analysis
- 6.4 Company Profiles (includes Global Level Overview, Market Level Overview, Core Segments, Financials as available, Strategic Information, Market Rank/Share, Products and Services, Recent Developments)
- 6.4.1 SAP SE
- 6.4.2 Coupa Software Incorporated
- 6.4.3 Oracle Corporation
- 6.4.4 Microsoft Corporation
- 6.4.5 Jaggaer, LLC
- 6.4.6 Infor Inc. (GT Nexus)
- 6.4.7 Ivalua Inc.
- 6.4.8 GEP Worldwide (GEP Solutions Private Ltd.)
- 6.4.9 Basware Oyj
- 6.4.10 Proactis Holdings Limited
- 6.4.11 Zycus Incorporated
- 6.4.12 Epicor Software Corporation
- 6.4.13 Workday Inc.
- 6.4.14 Tradeshift Holdings Inc.
- 6.4.15 SynerTrade (Econocom Digital Solutions GmbH)
- 6.4.16 Corcentric LLC (Determine)
- 6.4.17 Rosslyn Data Technologies PLC
- 6.4.18 Proxima Group Ltd.
- 6.4.19 Scout RFP LLC (Workday)
- 6.4.20 Mercateo AG
- 6.4.21 Prospend Pty Ltd.
7 MARKET OPPORTUNITIES AND FUTURE OUTLOOK
- 7.1 White-space and Unmet-Need Assessment

 2026-2030年全球貨運採購軟體市場
 永續IT採購軟體:市場佔有率分析、產業趨勢與統計及成長預測(2026-2031年)
 採購軟體市場規模、佔有率和趨勢分析報告:按軟體類型、部署模式、企業規模、最終用途、地區和細分市場預測(2026-2033 年)
 採購到付款市場規模、佔有率、成長和全球行業分析:按類型和應用、區域的洞察,2026-2034年的預測
 2026年全球採購軟體市場報告
 建築採購軟體市場:依採購類型、部署模式、組織規模和應用程式分類-2026-2032年全球預測採購軟體市場規模、佔有率、成長率和全球產業分析:按類型、應用和地區的洞察,2026-2034年的預測
 物聯網採購市場規模、佔有率和成長分析:按組件、應用、最終用戶產業和地區分類 - 2026-2033 年產業預測
 採購軟體市場分析及預測(至2035年):按類型、產品類型、服務、技術、組件、應用、流程、部署類型、最終用戶和功能分類
 採購軟體市場-全球產業規模、佔有率、趨勢、機會及預測(按部署類型、軟體類型、組織規模、垂直產業、地區和競爭格局分類,2021-2031年)