


 |
市場調查報告書
商品編碼
2073016
通訊網路能源效率軟體:市場佔有率分析、產業趨勢與統計、成長預測(2026-2031)Telecom Network Energy Efficiency Software - Market Share Analysis, Industry Trends & Statistics, Growth Forecasts (2026 - 2031) |
||||||

※ 本網頁內容可能與最新版本有所差異。詳細情況請與我們聯繫。
根據 Mordor Intelligence 預測,電信網路能源效率軟體的市場規模在 2025 年將達到 13.7 億美元,並將在 2026 年至 2031 年以 17.87% 的複合年成長率成長,到 2031 年達到 36.4 億美元。
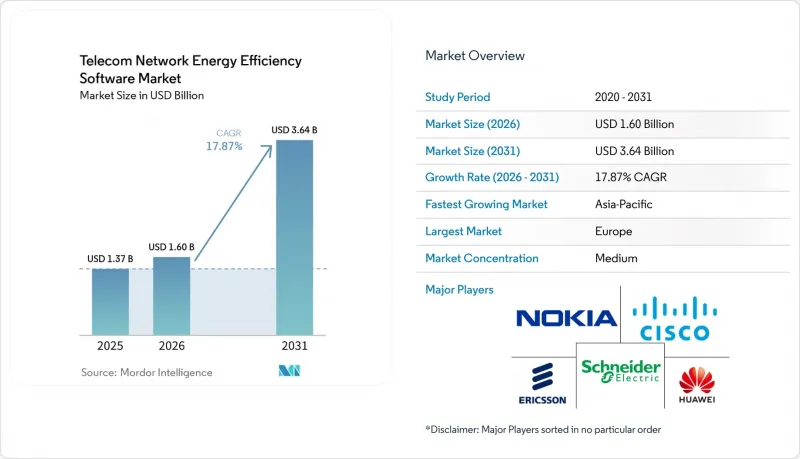
本報告按組件(軟體和服務)、解決方案類型(能源監控和視覺化軟體、能源分析和報告軟體等)、部署模式(雲端/SaaS、本地部署、混合部署)、最終用戶(行動網路營運商、網路基礎設施供應商等)和地區進行細分。市場預測以美元計價。
全球電信網路能源效率軟體市場趨勢及洞察
5G無線存取網能耗不斷增加
由於5G網路將比以往任何一代網路都消耗更多能源,電信網路能源效率軟體市場正在不斷擴張。大規模MIMO技術的廣泛應用以及都市區網路層密度的提高,正在推動站點級電力需求的成長,並導致運作中網路成本的上升。一項2025年的研究表明,在各種流量場景下,到2030年,英國的5G能源需求可能會激增,尤其是在都市區,能耗密度將顯著提高。在這樣的營運模式下,僅需求的成長並不能轉化為高效率的能源利用,反而會降低固定硬體配置的效能。因此,電信網路能源效率軟體市場對能夠跨多種設備環境提供睡眠模式、載波關閉和站點級最佳化整合控制的軟體的需求日益成長。當通訊業者尋求降低混合設備而非單一硬體堆疊的成本時,能夠超越廠商特定網路管理層進行操作的供應商將擁有顯著優勢。
利用人工智慧實現封閉回路型節能的進展
電信網路能源效率軟體市場也在不斷發展。基於人工智慧的封閉回路型工具不再侷限於試點階段,如今已開始在通訊業者的運作環境中部署。據愛立信稱,其「智慧能效」功能在2025年的一項試點計畫中,成功將沃達豐英國部分站點的5G無線單元日功耗降低了高達33%。這項成果意義重大,因為它直接將軟體決策轉化為無線層可衡量的能耗結果。此外,隨著最佳化工具透過學習各通訊業者網路的流量模式和配置行為來提升效能,切換成本也將隨之增加。在電信網路能源效率軟體市場,能夠確保早期全面部署並基於這些模式建立更廣泛的服務關係的供應商,很可能佔據優勢。這也是領先的成熟公司將人工智慧軟體與自動化平台和託管交付支援相結合的原因之一。
OSS、RAN 和電力系統整合的複雜性。
電信網路能源效率軟體市場仍面臨巨大的推廣障礙。這是因為能源平台必須連接到OSS環境、RAN系統和站點電力基礎設施,而這些系統通常使用不同的數據標準。這意味著通訊業者需要經歷漫長的工程週期,才能信任節能估計值或大規模實現控制操作的自動化。愛立信和諾基亞在2026年3月承認了這個問題,他們擴大了在rApp生態系統和SMO市場中的合作,以提高自主網路應用的廠商互通性。此舉表明,即使是主要供應商也認知到整合摩擦並非孤立的客戶問題,而是整個市場面臨的限制因素。在電信網路能源效率軟體市場,漫長的整合週期會延緩預算決策。這是因為通訊業者不僅透過許可費來衡量部署成本,還透過內部工程時間來衡量。即使降低能耗帶來的業務效益已經顯而易見,這種做法也會減緩推廣進程。
細分市場分析
至2025年,軟體銷售額將佔通訊業者。隨著通訊業者越來越依賴整合支援、託管最佳化和持續的模型維護,預計2026年至2031年服務領域的複合年成長率將達到18.25%。由於許多部署都始於平台選擇,之後通訊業者才會擴展到更廣泛的託管服務,因此軟體領域在電信網路能源效率軟體市場仍佔據重要地位。諾基亞已經開始部署以持續再培訓和人工智慧驅動的維護為核心的產品和服務,這印證了軟體和服務將日益融合而非爭奪同一預算的觀點。
這種轉變對電信網路能源效率軟體產業的競爭格局意義重大,因為託管服務能夠幫助供應商在初始部署階段後建立更持久的合作關係。當供應商參與到每週報告、成本降低績效檢驗和營運工作流程時,轉換成本不再局限於軟體替換。員工再培訓、服務等級調整和模型重新配置也包含在轉換成本中。這促使持續收入集中在那些在2024年初和2025年開始營運運作的供應商身上。因此,在電信網路能源效率軟體市場,服務透過在初始平台銷售之後提升客戶價值來填補獲利缺口。最終,構成比構成了當前收入的基礎,而服務則進一步加深了長期客戶維繫。
截至2025年,能源監控和視覺化軟體將佔據電信網路能源效率軟體市場28.74%的佔有率,而基於人工智慧的電源最佳化軟體預計到2031年將以18.65%的複合年成長率成長。監控領域佔據主導地位,是因為通訊業者需要穩定的可觀測層才能進行分析、最佳化或自動化。這個順序使監控供應商獲得了先發優勢,因為最初收集和整理站點資料的系統往往會影響後續的採購決策。同時,由於人工智慧驅動的最佳化能夠更直接地將運作中網路中的節能與軟體運作連結起來,因此其預算也越來越高。在電信網路能源效率軟體市場,隨著通訊業者超越視覺化階段,並透過動態網路控制追求可重複的效率提升,基於人工智慧的電源最佳化領域正在蓬勃發展。
此外,通訊業者對排放和能源管治方面可審計輸出的需求日益成長,推動了能源分析和報告軟體的重要性。這使得分析工具的角色從內部營運工具擴展到外部報告要求。能源管理和自動化軟體也在同步發展,尤其是在通訊業者將其軟體功能從「建議」轉向「執行」的情況下。 2026年5月,樂天行動和KDDI入選NEDO支援計劃,該計劃旨在2030年將虛擬基地台和行動資料中心的能耗降低40%。這清楚地表明了該領域對自動化日益成長的需求。因此,電信網路能源效率軟體市場同時支援多層解決方案,因為通訊業者進入該領域的成熟度各不相同,而不是遵循單一的統一路徑。這種層級結構降低了一種解決方案完全取代另一種解決方案的可能性。
區域分析
2025年,歐洲將佔據電信網路能源效率軟體市場34.56%的佔有率,成為最大的貢獻地區。這一地位得益於更完善的政策框架、通訊業者更突出的永續發展計畫以及基於人工智慧的能源管理工具的早期商業化。 2026年1月,歐盟委員會聯合研究中心發布了《電信網路永續性行為準則》,進一步加強了網路能源效率決策的合規性基礎。歐洲電信和能源監管委員會(BEREC)也透過基礎設施共用框架加強了支持,推動了該地區在提高網路設計和營運效率方面的努力。德國電信、Telia和Tele2都報告在排放取得了顯著進展,這表明歐洲採購能源效率軟體與長期的網路和治理決策相關,而不僅僅是短期的成本管治計劃。
預計亞太地區在2026年至2031年間將以18.45%的複合年成長率成長,成為電信網路能源效率軟體市場成長最快的區域市場。在該地區,大規模網路部署和通訊業者多元化發展正推動著對SaaS應用和更高級自動化技術的需求。 2026年5月,樂天移動和KDDI聯合入選NEDO(日本新能源產業技術綜合開發機構)的調查計畫,該項目旨在降低虛擬基地台和行動資料中心的能耗,這表明公眾和商業性對軟體主導的能源效率提升項目的支持力度日益增強。此外,諾基亞在印尼和菲律賓的SaaS實施案例研究也為東南亞電信網路能源效率軟體市場提供了可靠的參考數據。
北美仍然是通訊網路能源效率軟體的重要市場,這主要受不斷上漲的電價壓力以及對能夠降低站點和邊緣能耗的軟體日益成長的需求所驅動。美國能源資訊署 (EIA) 預測,零售電價將持續上漲至 2026 年,這將促使通訊業者更加關注需求側控制和能源效率軟體。在南美,隨著都市區5G 專案的推進,網路密度不斷擴大,對更嚴格的能源管理的需求也隨之增加,因此市場機會有限。中東和非洲的情況則較為複雜,一些通訊業者尋求提高網路自主性,而另一些運營商則直接受到柴油基地台經濟效益以及對更強大的監控基礎設施的需求所驅動。因此,不同地區對通訊網路能源效率軟體的採購重點各不相同:歐洲在監管和成熟部署方面主導,亞太地區在成長率方面領先,而其他地區則在成本壓力、基礎設施規模和當地營運限制等複雜因素的相互作用下不斷發展。
其他好處:
- Excel格式的市場預測(ME)表
- 3個月的分析師支持
目錄
第1章:引言
- 研究假設和市場定義
- 調查範圍
第2章:調查方法
第3章執行摘要
第4章 市場狀況
- 市場概覽
- 市場促進因素
- 5G無線接入網能量強度增加
- 透過人工智慧驅動的封閉回路型系統實現節能效果
- 在多廠商網路營運中實施雲SaaS
- 在環境、社會及公司治理(ESG)報告和實現淨零排放方面面臨合規壓力。
- 自主RAN最佳化,支援睡眠模式和載波關閉
- 塔式和邊緣營運中的能源價格波動
- 市場限制因素
- 傳統站點遙測與測量面臨的挑戰
- OSS、RAN 和電力系統整合的複雜性。
- 網路安全和資料主權問題
- 棕地維修工程的投資回收期很長。
- 宏觀經濟因素對市場的影響
- 產業價值鏈分析
- 監理情勢
- 技術展望
- 波特五力分析
第5章 市場規模與成長預測
- 按組件
- 軟體
- 服務
- 按解決方案類型
- 能源監控與視覺化軟體
- 能源分析和報告軟體
- 人工智慧驅動的電源最佳化軟體
- 能源管理與自動化軟體
- 部署模式
- 雲/SaaS
- 現場
- 混合
- 最終用戶
- 行動通訊業者
- 塔樓公司
- 網際服務供應商
- 網路基礎設施供應商
- 按地區
- 北美洲
- 美國
- 加拿大
- 墨西哥
- 南美洲
- 巴西
- 阿根廷
- 其他南美國家
- 歐洲
- 德國
- 英國
- 法國
- 義大利
- 西班牙
- 俄羅斯
- 其他歐洲國家
- 亞太地區
- 中國
- 印度
- 日本
- 韓國
- 澳洲
- 其他亞太國家
- 中東和非洲
- 中東
- 沙烏地阿拉伯
- 阿拉伯聯合大公國
- 土耳其
- 其他中東國家
- 非洲
- 南非
- 埃及
- 其他非洲國家
- 中東
- 北美洲
第6章 競爭情勢
- 市場集中度
- 策略趨勢
- 市佔率分析
- 公司簡介
- Tupl Inc.
- AirHop Communications, Inc.
- iMBrace Limited
- Recenso Services Ltd.
- TowerSight AI
- Polystar AB
- Nokia Corporation
- Telefonaktiebolaget LM Ericsson
- Huawei Technologies Co., Ltd.
- ZTE Corporation
- Cisco Systems, Inc.
- Siemens AG
- Schneider Electric SE
- ABB Ltd.
- Elisa Industriq
- Vertiv Holdings Co
- Honeywell International Inc.
- Qualcomm Technologies
- Juniper Networks, Inc.
- Mavenir Systems, Inc.
第7章 市場機會與未來展望
According to Mordor Intelligence, the telecom network energy efficiency software market size was valued at USD 1.37 billion in 2025 and is forecast to reach USD 3.64 billion by 2031 at a CAGR of 17.87% from 2026 to 2031.
This report is Segmented by Component (Software, and Services), Solution Type (Energy Monitoring and Visibility Software, Energy Analytics and Reporting Software, and More), Deployment Mode (Cloud/SaaS, On-Premises, and Hybrid), End User (Mobile Network Operators, Network Infrastructure Providers, and More), and Geography. The Market Forecasts are Provided in Terms of Value (USD).
Global Telecom Network Energy Efficiency Software Market Trends and Insights
Rising 5G RAN Energy Intensity
The telecom network energy efficiency software market is expanding because 5G creates a heavier energy burden than earlier network generations. Higher use of Massive MIMO and denser urban network layers is increasing site-level power needs and raising the cost of operating live networks. A 2025 study showed that 5G energy demand in the United Kingdom could rise sharply by 2030 under different traffic scenarios, with especially high consumption density in urban areas. That operating pattern makes static hardware settings less effective, because demand growth alone does not translate into efficient energy use. The telecom network energy efficiency software market is therefore seeing stronger demand for software that can orchestrate sleep modes, carrier shutdown, and site-level optimization across diverse equipment environments. Vendors that can operate above vendor-specific network management layers are in a stronger position when operators seek savings across mixed estates rather than within a single hardware stack.
AI-Driven Closed-Loop Power Saving Gains
The telecom network energy efficiency software market is also advancing, as AI-based closed-loop tools are now being deployed in live operator environments rather than remaining in pilot phases. Ericsson said its Intelligent Energy Efficiency capabilities reduced daily 5G radio unit power consumption by up to 33% at selected Vodafone UK sites during a 2025 trial. That result matters because it ties software decisions directly to measurable energy outcomes at the radio layer. It also raises switching costs over time, since optimization tools improve as they learn traffic patterns and configuration behavior from each operator's network. The telecom network energy efficiency software market is likely to reward vendors that secure early production deployments and then build a wider service relationship around those models. This is one reason the strongest incumbents are pairing AI software with automation platforms and managed delivery support.
Integration Complexity Across OSS, RAN, And Power Systems
The telecom network energy efficiency software market still faces a significant adoption barrier because energy platforms must connect to OSS environments, RAN systems, and site power infrastructure that often use different data standards. This creates a long engineering cycle before operators can trust savings estimates or automate control actions at scale. Ericsson and Nokia acknowledged this issue in March 2026 when they expanded cooperation across the rApp Ecosystem and SMO Marketplace to improve cross-vendor interoperability for autonomous network applications. That move shows that even leading suppliers see integration friction as a broad market constraint rather than a one-off customer problem. In the telecom network energy efficiency software market, long integration periods can delay budget decisions because operators measure deployment cost through internal engineering time as much as through license fees. This slows rollout even when the business case for lower power consumption is already visible.
Other drivers and restraints analyzed in the detailed report include:
- Cloud SaaS Adoption for Multi-Vendor Network Operations
- ESG Reporting and Net-Zero Compliance Pressure
- Legacy Site Telemetry And Metering Gaps
For complete list of drivers and restraints, kindly check the Table Of Contents.
Segment Analysis
Software accounted for 69.45% of revenue in 2025, making it the core revenue driver of the telecom network energy efficiency software market. This reflected the central role of licensed monitoring, analytics, optimization, and automation platforms in operator spending. Services are projected to grow at an 18.25% CAGR from 2026 to 2031, as operators rely more on integration support, managed optimization, and ongoing model maintenance. The telecom network energy efficiency software market size for software remained larger because most deployments still begin with a platform decision before operators expand into wider managed engagements. Nokia has already positioned its offering around continuous retraining and AI maintenance, which supports the idea that software and services are increasingly moving together rather than competing for the same budget line.
That shift matters for competitive behavior in the telecom network energy efficiency software industry because managed delivery can make vendor relationships more durable after the first implementation stage. Once a provider becomes part of weekly reporting, savings validation, and operating workflows, the cost of switching is no longer limited to replacing software. Staff retraining, service-level alignment, and model reconfiguration are also included in the exit cost. This supports recurring revenue concentration among suppliers that entered live deployments early in 2024 and 2025. In the telecom network energy efficiency software market, services are therefore closing the monetization gap by extending account value after the initial platform sale. The result is a component mix where software anchors present revenue and services support deeper account retention over time.
Energy Monitoring and Visibility Software held 28.74% of the telecom network energy efficiency software market share in 2025, while AI-Based Power Optimization Software is projected to grow at an 18.65% CAGR through 2031. Monitoring led because operators need a stable observability layer before they can trust analytics, optimization, or automation. That sequence gives monitoring vendors an early advantage, since the first system to collect and organize site data often shapes later purchasing decisions. At the same time, AI optimization is attracting stronger budgets because it links software actions more directly to power savings in live networks. The telecom network energy efficiency software market for AI-based power optimization is growing as operators move beyond visibility and seek repeatable efficiency gains from dynamic network control.
Energy Analytics and Reporting Software is also gaining importance because operators increasingly need auditable outputs for emissions and energy governance. That broadens the role of analytics from an internal operational tool to an external reporting requirement. Energy Management and Automation Software is developing in parallel, especially as operators seek to move software from recommendation to execution. In May 2026, Rakuten Mobile and KDDI were selected for a NEDO-backed program that aims to reduce the power consumption of virtualized base stations and mobile data centers by 40% by 2030, underscoring the scale of automation ambition now building in the sector. The telecom network energy efficiency software market, therefore, supports multiple solution layers simultaneously, because operators enter the stack at different maturity points rather than following a single uniform path. This layered structure reduces the chance that one solution type fully displaces the others.
Complete Report Scope:
- By Component
- Software
- Services
- By Solution Type
- Energy Monitoring and Visibility Software
- Energy Analytics and Reporting Software
- AI-Based Power Optimization Software
- Energy Management and Automation Software
- By Deployment Mode
- Cloud/SaaS
- On-Premises
- Hybrid
- By End User
- Mobile Network Operators
- Tower Companies
- Internet Service Providers
- Network Infrastructure Providers
- By Geography
- North America
- United States
- Canada
- Mexico
- South America
- Brazil
- Argentina
- Rest of South America
- Europe
- Germany
- United Kingdom
- France
- Italy
- Spain
- Russia
- Rest of Europe
- Asia-Pacific
- China
- India
- Japan
- South Korea
- Australia
- Rest of Asia-Pacific
- Middle East and Africa
- Middle East
- Saudi Arabia
- United Arab Emirates
- Turkey
- Rest of Middle East
- Africa
- South Africa
- Egypt
- Rest of Africa
- Middle East
- North America
Geography Analysis
Europe held 34.56% of the telecom network energy efficiency software market share in 2025, which made it the leading regional contributor. The region's position was supported by a stronger policy framework, more visible operator sustainability programs, and earlier commercialization of AI-based energy tools. The European Commission Joint Research Center published the Code of Conduct for the Sustainability of Telecommunications Networks in January 2026, which strengthened the compliance backdrop for network efficiency decisions. BEREC also added support through its infrastructure-sharing framework, which reinforced the region's push toward more efficient network design and operation. Deutsche Telekom, Telia, and Tele2 all reported major progress on emissions reduction, which shows that energy software procurement in Europe is tied to long-cycle network and governance decisions rather than short-lived cost programs.
Asia-Pacific is projected to grow at an 18.45% CAGR from 2026 to 2031, making it the fastest-growing regional segment in the telecom network energy efficiency software market. The region combines large network rollouts with a widening set of operator profiles, which supports demand for both SaaS adoption and deeper automation. In May 2026, Rakuten Mobile and KDDI were jointly selected for an NEDO research program focused on reducing power consumption in virtualized base stations and mobile data centers, which shows rising public and commercial support for software-led efficiency programs. Nokia's live SaaS deployments in Indonesia and the Philippines also give the telecom network energy efficiency software market credible production references in Southeast Asia.
North America remains an important part of the telecom network energy efficiency software market because electricity price pressure supports demand for software that can reduce site and edge power use. The U.S. Energy Information Administration said retail electricity prices were expected to continue rising through 2026, which keeps operators' focus on demand-side control and efficiency software. South America presents a selective opportunity in which urban 5G programs are expanding network density and increasing the need for more disciplined energy management. The Middle East and Africa remain a mixed region, with some operators pursuing greater network autonomy while others are driven more directly by diesel-heavy site economics and the need for stronger monitoring foundations. This leaves the telecom network energy efficiency software market with different purchase priorities by region, where Europe leads on regulation and mature deployment, Asia-Pacific leads on growth, and other regions advance through a mix of cost pressure, infrastructure scale, and local operational constraints.
- Tupl Inc.
- AirHop Communications, Inc.
- iMBrace Limited
- Recenso Services Ltd.
- TowerSight AI
- Polystar AB
- Nokia Corporation
- Telefonaktiebolaget LM Ericsson
- Huawei Technologies Co., Ltd.
- ZTE Corporation
- Cisco Systems, Inc.
- Siemens AG
- Schneider Electric SE
- ABB Ltd.
- Elisa Industriq
- Vertiv Holdings Co
- Honeywell International Inc.
- Qualcomm Technologies
- Juniper Networks, Inc.
- Mavenir Systems, Inc.
Additional Benefits:
- The market estimate (ME) sheet in Excel format
- 3 months of analyst support
TABLE OF CONTENTS
1 INTRODUCTION
- 1.1 Study Assumptions and Market Definition
- 1.2 Scope of the Study
2 RESEARCH METHODOLOGY
3 EXECUTIVE SUMMARY
4 MARKET LANDSCAPE
- 4.1 Market Overview
- 4.2 Market Drivers
- 4.2.1 Rising 5G RAN Energy Intensity
- 4.2.2 AI-Driven Closed-Loop Power Saving Gains
- 4.2.3 Cloud SaaS Adoption For Multi-Vendor Network Operations
- 4.2.4 ESG Reporting And Net-Zero Compliance Pressure
- 4.2.5 Autonomous RAN Optimization For Sleep Mode And Carrier Shutdown
- 4.2.6 Energy Price Volatility In Tower And Edge Operations
- 4.3 Market Restraints
- 4.3.1 Legacy Site Telemetry And Metering Gaps
- 4.3.2 Integration Complexity Across OSS, RAN, And Power Systems
- 4.3.3 Cybersecurity And Data Sovereignty Concerns
- 4.3.4 Long Payback Period For Retrofits In Brownfield Networks
- 4.4 Impact of Macroeconomic Factors on the Market
- 4.5 Industry Value-Chain Analysis
- 4.6 Regulatory Landscape
- 4.7 Technological Outlook
- 4.8 Porter's Five Forces Analysis
- 4.8.1 Bargaining Power of Buyers
- 4.8.2 Bargaining Power of Suppliers
- 4.8.3 Threat of New Entrants
- 4.8.4 Threat of Substitutes
- 4.8.5 Intensity of Competitive Rivalry
5 MARKET SIZE AND GROWTH FORECASTS (VALUE)
- 5.1 By Component
- 5.1.1 Software
- 5.1.2 Services
- 5.2 By Solution Type
- 5.2.1 Energy Monitoring and Visibility Software
- 5.2.2 Energy Analytics and Reporting Software
- 5.2.3 AI-Based Power Optimization Software
- 5.2.4 Energy Management and Automation Software
- 5.3 By Deployment Mode
- 5.3.1 Cloud/SaaS
- 5.3.2 On-Premises
- 5.3.3 Hybrid
- 5.4 By End User
- 5.4.1 Mobile Network Operators
- 5.4.2 Tower Companies
- 5.4.3 Internet Service Providers
- 5.4.4 Network Infrastructure Providers
- 5.5 By Geography
- 5.5.1 North America
- 5.5.1.1 United States
- 5.5.1.2 Canada
- 5.5.1.3 Mexico
- 5.5.2 South America
- 5.5.2.1 Brazil
- 5.5.2.2 Argentina
- 5.5.2.3 Rest of South America
- 5.5.3 Europe
- 5.5.3.1 Germany
- 5.5.3.2 United Kingdom
- 5.5.3.3 France
- 5.5.3.4 Italy
- 5.5.3.5 Spain
- 5.5.3.6 Russia
- 5.5.3.7 Rest of Europe
- 5.5.4 Asia-Pacific
- 5.5.4.1 China
- 5.5.4.2 India
- 5.5.4.3 Japan
- 5.5.4.4 South Korea
- 5.5.4.5 Australia
- 5.5.4.6 Rest of Asia-Pacific
- 5.5.5 Middle East and Africa
- 5.5.5.1 Middle East
- 5.5.5.1.1 Saudi Arabia
- 5.5.5.1.2 United Arab Emirates
- 5.5.5.1.3 Turkey
- 5.5.5.1.4 Rest of Middle East
- 5.5.5.2 Africa
- 5.5.5.2.1 South Africa
- 5.5.5.2.2 Egypt
- 5.5.5.2.3 Rest of Africa
- 5.5.5.1 Middle East
- 5.5.1 North America
6 COMPETITIVE LANDSCAPE
- 6.1 Market Concentration
- 6.2 Strategic Moves
- 6.3 Market Share Analysis
- 6.4 Company Profiles (includes Global Level Overview, Market Level Overview, Core Segments, Financials as available, Strategic Information, Market Rank/Share, Products and Services, Recent Developments)
- 6.4.1 Tupl Inc.
- 6.4.2 AirHop Communications, Inc.
- 6.4.3 iMBrace Limited
- 6.4.4 Recenso Services Ltd.
- 6.4.5 TowerSight AI
- 6.4.6 Polystar AB
- 6.4.7 Nokia Corporation
- 6.4.8 Telefonaktiebolaget LM Ericsson
- 6.4.9 Huawei Technologies Co., Ltd.
- 6.4.10 ZTE Corporation
- 6.4.11 Cisco Systems, Inc.
- 6.4.12 Siemens AG
- 6.4.13 Schneider Electric SE
- 6.4.14 ABB Ltd.
- 6.4.15 Elisa Industriq
- 6.4.16 Vertiv Holdings Co
- 6.4.17 Honeywell International Inc.
- 6.4.18 Qualcomm Technologies
- 6.4.19 Juniper Networks, Inc.
- 6.4.20 Mavenir Systems, Inc.
7 MARKET OPPORTUNITIES AND FUTURE OUTLOOK
- 7.1 White-Space And Unmet-Need Assessment

 中東歐電信業者業務服務概況(2026 年)電信業者業務服務概況:西歐(2026 年)通訊業者策略基準研究:減少下游客戶相關排放、廢棄物和廢棄產品對環境的影響。中小企業的通訊業者全球商業服務市場:2025-2030 年預測
 Orange-通訊自動化、人工智慧和自主網路案例研究:為從塞內加爾到西班牙的26個國家的3億用戶管理自主人工智慧和網路自動化馬來西亞:電信業者業務及IT服務預測(2025-2030)印尼:電信業者業務及IT服務預測(2025-2030)全球電信業者營運支出:趨勢與預測(2024-2031)
 電信業者的B2B成長策略:案例研究與分析(第三卷:北美電信業者)
 通訊業者的永續發展:通訊設備供應商的機會及風險評估(2025年~2030年)