


 |
市場調查報告書
商品編碼
2072955
碳意識應用開發平台:市場佔有率分析、產業趨勢與統計、成長預測(2026-2031)Carbon-Aware Application Development Platform - Market Share Analysis, Industry Trends & Statistics, Growth Forecasts (2026 - 2031) |
||||||

※ 本網頁內容可能與最新版本有所差異。詳細情況請與我們聯繫。
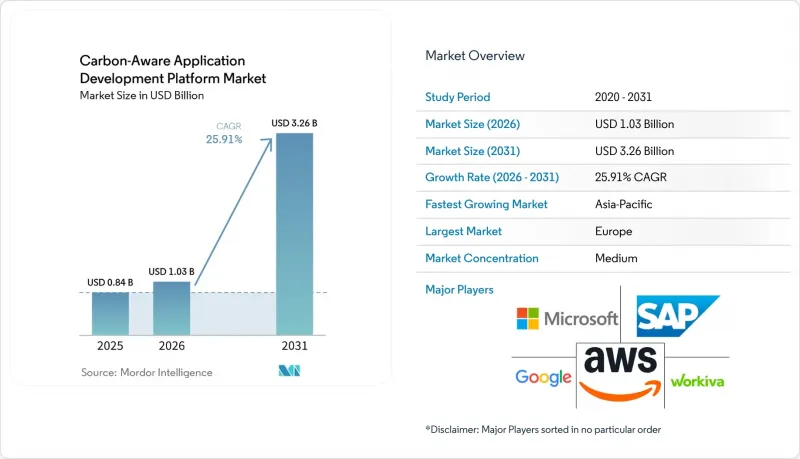
根據 Mordor Intelligence 預測,碳感知應用開發平台的市場規模預計將在 2025 年達到 8.4 億美元,2026 年達到 10.3 億美元,到 2031 年達到 32.6 億美元,2026 年至 2031 年的複合年成長率為 25.9%。
本報告按組件(平台和服務)、部署模式(雲端、本地部署、混合部署)、企業規模(大型企業、中小企業)、應用程式(碳意識開發和軟體開發生命週期管理等)、最終用戶產業(IT和電信、銀行、金融服務和保險等)以及地區進行細分。市場預測以美元計價。
全球碳意識應用開發平台市場趨勢及洞察
企業對碳最佳化軟體執行的需求日益成長
企業對碳最佳化軟體執行的需求日益成長。這是因為永續發展目標不再只是企業訊息,而是正在影響預算和營運決策。根據FinOps基金會的報告,到2025年,歐洲53%的FinOps實踐將報告雲碳指標,年增18個百分點,而北美僅為29%。這種差異為碳感知應用開發平台市場的供應商提供了明顯的機遇,他們可以銷售將碳追蹤作為雲端管理標準要素的工具。企業也逐漸意識到,碳感知調度可以揭示那些僅以降低成本為目標的最佳化方案可能無法發現的閒置容量和資源浪費。 ISO/IEC 21031:2024《軟體碳強度》規範為買家提供了一種正式的方法,可以將軟體排放工作轉化為可重複和可審計的分數,從而方便財務和法務部門進行內部核准。
監管進步,邁向可審計的數位永續管理
歐盟氣候相關財務資訊揭露條例 (CSRD) 的首個強制性報告階段將於 2025 年適用於大型上市公司,要求披露溫室氣體排放信息,並接受基於 ESRS E1 標準的第三方鑑證。美國證券交易委員會 (SEC) 也於 2024 年 3 月通過了其氣候相關財務資訊揭露條例 (CSRD),強制要求上市公司分階段報告範圍 1 和範圍 2 的碳排放,首先從 2025 年的「大型加速申報公司」開始。雖然這些法規並未明確要求揭露軟體層面的碳強度數據,但審計人員越來越要求提供工作量層面的證據來支持所報告的排放數據。這種日益成長的需求正在改變碳感知工具的角色,使其不再只是自願性的 ESG 投資,而是成為公司報告數據合理性的管理層。 「碳感知應用開發平台」市場正受益於這一轉變,因為可追溯的數據收集、報告邏輯和證據鏈在採購決策中變得越來越重要。
碳數據提供者之間的標準化程度滯後
碳數據供應商缺乏標準化仍然是碳感知應用開發平台市場面臨的最大障礙之一。 2025年1月,Electricity Maps報告稱,在全球65個電網中,平均流量追蹤排放因子與邊際排放因子之間的統計相關性極低。這意味著針對某一訊號最佳化的工作負載在針對其他訊號進行評估時可能表現不佳。雖然SCI框架為軟體團隊提供了一種計算碳強度的方法,但它並未定義單一的電網排放訊號,迫使企業根據具體情況確定調查方法。在監管機構和標準化機構彌合這一差距之前,買家將面臨日後不得不重新設計資料模型、控制措施和整合方案以滿足審計要求的風險。
細分市場分析
到2025年,該平台將佔據「碳感知應用開發平台市場」72.1%的佔有率,成為其組件組合中的收入支柱。這一領先地位反映了企業在測量引擎、排放API、SCI評分工具和CI/CD報告插件方面的投入,這些工具構成了碳感知開發的基準層。最先進的採用者是已經完成溫室氣體基線清單編制的科技和金融服務公司,他們現在需要用於日常開發的工具。由綠色軟體基金會管理的「碳感知SDK」展示了商業供應商為企業部署打包的整合介面的廣泛性。
預計到2031年,服務業將以26.5%的複合年成長率成長,成為碳意識應用開發平台市場中成長最快的組成部分。這一趨勢反映了企業常見的採購模式:在企業內部掌握碳相關工具的使用技能之前,諮詢、實施和營運管理服務便會迅速擴張。企業仍需要協助進行範圍界定、活動資料映射、軟體交付系統整合以及建置符合審計要求的報告管理功能。從平台收入和服務成長的平衡來看,僅靠軟體是不夠的,這意味著隨著碳意識應用開發平台在整個市場中的普及,實施支援仍將至關重要。
到 2025 年,雲端將主導碳感知應用開發平台市場,佔據 67.3% 的市場佔有率,成為主流採用模式。這種主導地位源於這樣一個事實:最具實用性的碳相關資訊(例如電網碳強度數據、儀錶板和調度器整合)在公共雲端環境中最容易取得。微軟 Azure 碳最佳化、AWS 永續發展控制台和Google的碳智慧運算工具都將碳資料放置在工程團隊管理工作負載的附近。這種接近性降低了採用門檻,使團隊能夠在同一操作環境中查看排放和成本數據。
混合環境預計到 2031 年將以 26.9% 的複合年成長率成長,成為成長最快的部署模式。銀行、公共產業和政府等受監管行業仍在本地運行關鍵工作負載,並需要跨私有和公共基礎設施的統一報告視圖。這種需求正促使買家轉向能夠連接傳統運算環境、新型 AI 環境和雲端原生遙測的架構。本地部署仍然是最小的細分市場,但對於那些根據直接碳審計義務和計算主權法規構建私人 AI 能力的公司而言,它仍然至關重要。
區域分析
到了2025年,歐洲佔34.9%的市場佔有率,成為碳意識應用開發平台市場最大的區域貢獻者。該地區受益於圍繞CSRD和ESRS E1要求構建的健全的報告框架。這些法規使受監管公司的溫室氣體揭露更加詳細和可審計,提高了工作負載層面證據和可追溯報告邏輯的價值。德國也透過其2025年「綠色編碼」系列研討會支持了開發人員能力的提升。隨後,綠色軟體基金會將SCI框架與CSRD支援需求結合,為採購團隊建立了軟體工程實務與正式報告要求之間的橋樑。
北美憑藉其強大的AI基礎設施投資和活躍的氣候變遷資訊揭露環境,在「碳感知應用開發平台市場」佔據第二大佔有率。儘管美國證券交易委員會(SEC)的分階段資訊揭露框架提高了對更完善的排放證據的需求,但大型科技和金融服務公司已經具備了實施碳感知工具的規模。加拿大和墨西哥仍處於早期市場階段,但透過與美國公司建立供應商合作關係,其用戶群正在擴大。以巴西為首的南美洲市場規模仍然較小,但隨著供應鏈脫碳和報告義務的重要性日益凸顯,早期需求也逐漸顯現。
預計到2031年,亞太地區將以27.9%的複合年成長率成長,成為成長最快的地區。日本是主要的成長中心,部分原因是日本經濟產業省(METI)於2025年6月發布了首份「瓦比特合作」報告,以及修訂後的《能源節約法》框架從2026年開始適用於資料中心。中國也在加速發展,於2025年8月制定了雲端服務客戶碳排放運算的技術標準,建立了國內碳排放運算和揭露模式。中東和非洲市場仍處於起步階段,但隨著淨零排放努力和投資者主導的ESG(環境、社會和治理)要求開始影響數位基礎設施的採購,其長期潛力正在不斷成長。
其他好處:
- Excel格式的市場預測(ME)表
- 3個月的分析師支持
目錄
第1章:引言
- 研究假設和市場定義
- 調查範圍
第2章:調查方法
第3章執行摘要
第4章 市場狀況
- 市場概覽
- 市場促進因素
- 企業對碳最佳化軟體執行的需求日益成長
- 監管機構應推廣可審計的數位化永續發展管理系統
- 人工智慧和高密度運算工作負載的擴展
- 在雲端營運中整合 FinOps 和 GreenOps
- 過渡到即時碳強度 API 和調度
- 擴大與環境、社會及公司治理(ESG)相關的採購及產品開發標準
- 市場限制因素
- 碳數據提供者缺乏標準化
- 傳統DevOps和雲端堆疊中高階整合的複雜性
- 測量工作負荷水準排放的數據品質差
- 對非核心永續發展相關軟體支出進行預算審查
- 產業價值鏈分析
- 監理情勢
- 技術展望
- 宏觀經濟因素對市場的影響
- 波特五力分析
第5章 市場規模與成長預測
- 按組件
- 平台
- 服務
- 部署模式
- 雲
- 現場
- 混合
- 按公司規模
- 大公司
- 小型企業
- 透過使用
- 碳意識開發與軟體開發生命週期管理
- 碳感知工作負載最佳化
- 碳測量、監測和預測
- 管治、報告、合規
- 決策智慧與自動化
- 產業最終用途
- 資訊科技/通訊
- BFSI
- 工業製造
- 能源公用事業
- 石油和天然氣
- 零售與電子商務
- 食品飲料製造業
- 運輸/物流
- 建築和基礎設施
- 政府/公共部門
- 其他終端用戶產業
- 按地區
- 北美洲
- 美國
- 加拿大
- 墨西哥
- 南美洲
- 巴西
- 其他南美國家
- 歐洲
- 德國
- 英國
- 法國
- 義大利
- 西班牙
- 俄羅斯
- 其他歐洲國家
- 亞太地區
- 中國
- 印度
- 日本
- 韓國
- 澳洲
- 其他亞太國家
- 中東
- 土耳其
- 沙烏地阿拉伯
- 阿拉伯聯合大公國
- 其他中東國家
- 非洲
- 南非
- 奈及利亞
- 其他非洲國家
- 北美洲
第6章 競爭情勢
- 市場集中度
- 策略趨勢
- 市佔率分析
- 公司簡介
- Electricity Maps ApS
- WattTime, Inc.
- Normative.io Ltd
- Cycloid SAS
- Workiva Inc.
- SAP SE
- Microsoft Corporation
- Amazon Web Services, Inc.
- Google LLC
- IBM Corporation
- Salesforce, Inc.
- ServiceNow, Inc.
- Oracle Corporation
- Schneider Electric SE
- ENGIE SA
- Siemens AG
- Dassault Systemes SE
- Accenture plc
- Capgemini SE
- HCL Technologies Limited
- Tata Consultancy Services Limited
第7章 市場機會與未來展望
According to Mordor Intelligence, the carbon-Aware application development platform market size is projected to be USD 0.84 billion in 2025, USD 1.03 billion in 2026, and reach USD 3.26 billion by 2031, growing at a CAGR of 25.9% from 2026 to 2031.
This report is Segmented by Component (Platform and Services), Deployment Mode (Cloud, On-Premises, and Hybrid), Enterprise Size (Large Enterprises, and Small and Medium Enterprises), Application (Carbon-Aware Development and SDLC Management, and More), End-Use Industry (IT and Telecom, BFSI, and More), and Geography. The Market Forecasts are Provided in Terms of Value (USD).
Global Carbon-Aware Application Development Platform Market Trends and Insights
Rising Enterprise Demand for Carbon-Optimized Software Execution
Enterprise demand for carbon-optimized software execution is rising because sustainability targets now affect budgets and operating decisions, not just corporate messaging. The FinOps Foundation reported that 53% of European FinOps practices were reporting cloud carbon metrics in 2025, up 18 percentage points year over year, while North America remained at 29%. That gap gives vendors in the Carbon-Aware Application Development Platform Market a clear opening to sell tools that turn carbon tracking into a standard part of cloud management. Enterprises are also finding that carbon-aware scheduling can expose idle capacity and waste that cost-only rightsizing programs do not always catch. The ISO/IEC 21031:2024 Software Carbon Intensity specification provided buyers with a formal way to convert software emissions work into repeatable, auditable scores, making internal approval easier for finance and legal teams.
Regulatory Push for Auditable Digital Sustainability Controls
The first mandatory reporting phase of the EU CSRD applied in 2025 to large listed companies and required greenhouse gas disclosure under ESRS E1 with third-party assurance. The U.S. Securities and Exchange Commission also adopted climate disclosure rules in March 2024 with phased Scope 1 and Scope 2 reporting for public companies beginning with Large Accelerated Filers in 2025. Even though these rules do not expressly require software-level carbon-intensity data, auditors are increasingly requesting workload-level evidence to support reported emissions values. That demand shifts carbon-aware tooling from a voluntary ESG purchase into a control layer that helps enterprises defend reported numbers. The Carbon-Aware Application Development Platform Market is benefiting from that shift, as traceable data collection, reporting logic, and evidence trails are becoming increasingly important in procurement decisions.
Limited Standardization Across Carbon Data Providers
Limited standardization across carbon data providers remains one of the clearest barriers in the Carbon-Aware Application Development Platform Market. Electricity Maps reported in January 2025 that average flow-traced and marginal emissions factors showed very low statistical correlation across 65 global grids. That means a workload optimized for one signal can perform worse when evaluated under another. The SCI framework provided software teams with a way to calculate carbon intensity, but it did not prescribe a single grid emissions signal, leaving enterprises to decide on methodology on a case-by-case basis. Until regulators or standards bodies close that gap, buyers face the risk of having to rework data models, controls, and integrations later to meet audit expectations.
Other drivers and restraints analyzed in the detailed report include:
- Growth of AI and High-Density Compute Workloads
- FinOps and GreenOps Convergence in Cloud Operations
- High Integration Complexity with Legacy DevOps and Cloud Stacks
For complete list of drivers and restraints, kindly check the Table Of Contents.
Segment Analysis
Platform held a 72.1% share of the Carbon-Aware Application Development Platform Market in 2025, making it the revenue anchor for the component mix. That lead reflects enterprise spending on measurement engines, emissions APIs, SCI scoring tools, and CI/CD reporting plugins that form the base layer for carbon-aware development. Adoption has moved furthest in technology and financial services organizations that have already completed baseline greenhouse gas inventories and now need developer tooling for routine use. The Carbon Aware SDK, maintained by the Green Software Foundation, shows the breadth of the integration surface that commercial vendors are packaging for enterprise deployment.
Services are forecast to grow at a 26.5% CAGR through 2031, making it the fastest-growing component of the Carbon-Aware Application Development Platform Market. That pattern reflects a familiar enterprise buying path where advisory, implementation, and managed operations rise quickly before in-house carbon tooling skills become common. Enterprises still need help setting boundaries, mapping activity data, connecting software delivery systems, and building reporting controls that stand up in audit settings. The balance between platform revenue and services growth suggests that software alone is not enough, and that execution support will remain important as adoption broadens across the Carbon-Aware Application Development Platform Market.
Cloud held 67.3% of the Carbon-Aware Application Development Platform market in 2025, making it the dominant deployment model by a wide margin. The lead came from the fact that the most usable carbon signals, such as grid carbon intensity feeds, dashboards, and scheduler integrations, are easiest to access in public cloud environments. Microsoft Azure Carbon Optimization, the AWS Sustainability Console, and Google's carbon-intelligent computing tools all place carbon data close to where engineering teams already manage workloads. That proximity lowers adoption friction because teams can view emissions and cost data in the same operating context.
Hybrid is projected to expand at a 26.9% CAGR through 2031, making it the fastest-growing deployment mode. Regulated sectors such as banking, utilities, and government still run major workloads on-premises and need a single reporting view across both private and public infrastructure. That need is pushing buyers toward architectures that bridge legacy compute, new AI environments, and cloud-native telemetry. On-premises remains the smallest segment, but it remains relevant for enterprises that build private AI capacity under direct carbon audit obligations or compute sovereignty rules.
Complete Report Scope:
- By Component
- Platform
- Services
- By Deployment Mode
- Cloud
- On-Premises
- Hybrid
- By Enterprise Size
- Large Enterprises
- Small and Medium Enterprises
- By Application
- Carbon-Aware Development and SDLC Management
- Carbon-Aware Workload Optimization
- Carbon Measurement, Monitoring and Forecasting
- Governance, Reporting and Compliance
- Decision Intelligence and Automation
- By End-Use Industry
- IT and Telecom
- BFSI
- Industrial Manufacturing
- Energy and Utilities
- Oil and Gas
- Retail and E-Commerce
- Food and Beverage Manufacturing
- Transportation and Logistics
- Construction and Infrastructure
- Government and Public Sector
- Other End-User Industries
- By Geography
- North America
- United States
- Canada
- Mexico
- South America
- Brazil
- Rest of South America
- Europe
- Germany
- United Kingdom
- France
- Italy
- Spain
- Russia
- Rest of Europe
- Asia-Pacific
- China
- India
- Japan
- South Korea
- Australia
- Rest of Asia-Pacific
- Middle East
- Turkey
- Saudi Arabia
- United Arab Emirates
- Rest of Middle East
- Africa
- South Africa
- Nigeria
- Rest of Africa
- North America
Geography Analysis
Europe held a 34.9% share in 2025, making it the largest regional contributor to the Carbon-Aware Application Development Platform Market. The region benefits from a strong reporting framework built around the CSRD and ESRS E1 requirements. Those rules made greenhouse gas disclosure more detailed and more auditable for in-scope companies, which raised the value of workload-level evidence and traceable reporting logic. Germany also supported developer capacity building through its 2025 Green Coding workshop series. The Green Software Foundation later mapped the SCI framework to CSRD support needs, providing procurement teams with a clearer bridge between software engineering practices and formal reporting expectations.
North America held the second-largest share in the Carbon-Aware Application Development Platform Market because the region combines strong AI infrastructure investment with an active climate disclosure environment. The U.S. Securities and Exchange Commission's phased disclosure framework increased the need for better emissions evidence, while large technology and financial services firms already had the scale to operationalize carbon-aware tooling. Canada and Mexico remain earlier-stage markets, but supplier linkages with U.S. enterprises are widening the adoption base. South America, led by Brazil, is still smaller, yet early demand is emerging as supply chain decarbonization and reporting obligations become more important.
Asia-Pacific is forecast to grow at a 27.9% CAGR through 2031, making it the fastest-growing region. Japan is a major growth center because METI published the first Watt-Bit Collaboration report in June 2025, and the country's updated Energy Conservation Act framework will begin applying to qualifying data centers in 2026. China also added momentum through its August 2025 technical standard for cloud service customer carbon emission accounting, which created a domestic model for calculation and disclosure. The Middle East and Africa remain early-stage markets, but long-term potential is improving as net-zero commitments and investor-led ESG requirements begin to shape digital infrastructure procurement.
- Electricity Maps ApS
- WattTime, Inc.
- Normative.io Ltd
- Cycloid SAS
- Workiva Inc.
- SAP SE
- Microsoft Corporation
- Amazon Web Services, Inc.
- Google LLC
- IBM Corporation
- Salesforce, Inc.
- ServiceNow, Inc.
- Oracle Corporation
- Schneider Electric SE
- ENGIE SA
- Siemens AG
- Dassault Systemes SE
- Accenture plc
- Capgemini SE
- HCL Technologies Limited
- Tata Consultancy Services Limited
Additional Benefits:
- The market estimate (ME) sheet in Excel format
- 3 months of analyst support
TABLE OF CONTENTS
1 INTRODUCTION
- 1.1 Study Assumptions and Market Definition
- 1.2 Scope of the Study
2 RESEARCH METHODOLOGY
3 EXECUTIVE SUMMARY
4 MARKET LANDSCAPE
- 4.1 Market Overview
- 4.2 Market Drivers
- 4.2.1 Rising Enterprise Demand for Carbon-Optimized Software Execution
- 4.2.2 Regulatory Push for Auditable Digital Sustainability Controls
- 4.2.3 Growth of AI and High-Density Compute Workloads
- 4.2.4 FinOps and GreenOps Convergence in Cloud Operations
- 4.2.5 Shift Toward Real-Time Carbon Intensity APIs and Scheduling
- 4.2.6 Expansion of ESG-Linked Procurement and Product Development Standards
- 4.3 Market Restraints
- 4.3.1 Limited Standardization Across Carbon Data Providers
- 4.3.2 High Integration Complexity With Legacy DevOps and Cloud Stacks
- 4.3.3 Data Quality Gaps in Workload-Level Emissions Measurement
- 4.3.4 Budget Scrutiny for Non-Core Sustainability Software Spend
- 4.4 Industry Value-Chain Analysis
- 4.5 Regulatory Landscape
- 4.6 Technological Outlook
- 4.7 Impact of Macroeconomic Factors on the Market
- 4.8 Porter's Five Forces Analysis
- 4.8.1 Bargaining Power of Buyers
- 4.8.2 Bargaining Power of Suppliers
- 4.8.3 Threat of New Entrants
- 4.8.4 Threat of Substitutes
- 4.8.5 Intensity of Competitive Rivalry
5 MARKET SIZE AND GROWTH FORECASTS (VALUE)
- 5.1 By Component
- 5.1.1 Platform
- 5.1.2 Services
- 5.2 By Deployment Mode
- 5.2.1 Cloud
- 5.2.2 On-Premises
- 5.2.3 Hybrid
- 5.3 By Enterprise Size
- 5.3.1 Large Enterprises
- 5.3.2 Small and Medium Enterprises
- 5.4 By Application
- 5.4.1 Carbon-Aware Development and SDLC Management
- 5.4.2 Carbon-Aware Workload Optimization
- 5.4.3 Carbon Measurement, Monitoring and Forecasting
- 5.4.4 Governance, Reporting and Compliance
- 5.4.5 Decision Intelligence and Automation
- 5.5 By End-Use Industry
- 5.5.1 IT and Telecom
- 5.5.2 BFSI
- 5.5.3 Industrial Manufacturing
- 5.5.4 Energy and Utilities
- 5.5.5 Oil and Gas
- 5.5.6 Retail and E-Commerce
- 5.5.7 Food and Beverage Manufacturing
- 5.5.8 Transportation and Logistics
- 5.5.9 Construction and Infrastructure
- 5.5.10 Government and Public Sector
- 5.5.11 Other End-User Industries
- 5.6 By Geography
- 5.6.1 North America
- 5.6.1.1 United States
- 5.6.1.2 Canada
- 5.6.1.3 Mexico
- 5.6.2 South America
- 5.6.2.1 Brazil
- 5.6.2.2 Rest of South America
- 5.6.3 Europe
- 5.6.3.1 Germany
- 5.6.3.2 United Kingdom
- 5.6.3.3 France
- 5.6.3.4 Italy
- 5.6.3.5 Spain
- 5.6.3.6 Russia
- 5.6.3.7 Rest of Europe
- 5.6.4 Asia-Pacific
- 5.6.4.1 China
- 5.6.4.2 India
- 5.6.4.3 Japan
- 5.6.4.4 South Korea
- 5.6.4.5 Australia
- 5.6.4.6 Rest of Asia-Pacific
- 5.6.5 Middle East
- 5.6.5.1 Turkey
- 5.6.5.2 Saudi Arabia
- 5.6.5.3 United Arab Emirates
- 5.6.5.4 Rest of Middle East
- 5.6.6 Africa
- 5.6.6.1 South Africa
- 5.6.6.2 Nigeria
- 5.6.6.3 Rest of Africa
- 5.6.1 North America
6 COMPETITIVE LANDSCAPE
- 6.1 Market Concentration
- 6.2 Strategic Moves
- 6.3 Market Share Analysis
- 6.4 Company Profiles (includes Global Level Overview, Market Level Overview, Core Segments, Financials as available, Strategic Information, Market Rank/Share, Products and Services, Recent Developments)
- 6.4.1 Electricity Maps ApS
- 6.4.2 WattTime, Inc.
- 6.4.3 Normative.io Ltd
- 6.4.4 Cycloid SAS
- 6.4.5 Workiva Inc.
- 6.4.6 SAP SE
- 6.4.7 Microsoft Corporation
- 6.4.8 Amazon Web Services, Inc.
- 6.4.9 Google LLC
- 6.4.10 IBM Corporation
- 6.4.11 Salesforce, Inc.
- 6.4.12 ServiceNow, Inc.
- 6.4.13 Oracle Corporation
- 6.4.14 Schneider Electric SE
- 6.4.15 ENGIE SA
- 6.4.16 Siemens AG
- 6.4.17 Dassault Systemes SE
- 6.4.18 Accenture plc
- 6.4.19 Capgemini SE
- 6.4.20 HCL Technologies Limited
- 6.4.21 Tata Consultancy Services Limited
7 MARKET OPPORTUNITIES AND FUTURE OUTLOOK
- 7.1 White-Space and Unmet-Need Assessment

 面向銀行、金融服務和保險業的綠色IT軟體:市場佔有率分析、行業趨勢和統計數據以及成長預測(2026-2031年)東南亞綠色IT軟體和雲端永續性:市場佔有率分析、產業趨勢和統計數據以及成長預測(2026-2031年)
 2026年全球雲端永續性市場報告
 雲端永續性市場分析及預測(至 2035 年):按類型、產品類型、服務、技術、組件、應用、部署類型、最終用戶和解決方案分類
 按組織規模、部署模式、組件、服務類型和垂直行業分類的雲端永續性市場 - 全球預測 2026-2032 年
 全球雲端永續市場
 全球雲端永續發展市場規模、佔有率和趨勢分析:按公司規模、解決方案、服務模式、最終用途、地區、前景和預測,2024-2031
 雲端永續發展市場規模、佔有率、趨勢分析報告:按解決方案、按企業規模、按服務模式、按最終用途、按地區、細分市場預測,2024-2030 年