


 |
市場調查報告書
商品編碼
2072954
綠色程式碼分析與最佳化軟體:市場佔有率分析、產業趨勢與統計、成長預測(2026-2031)Green Code Analysis and Optimization Software - Market Share Analysis, Industry Trends & Statistics, Growth Forecasts (2026 - 2031) |
||||||

※ 本網頁內容可能與最新版本有所差異。詳細情況請與我們聯繫。
根據 Mordor Intelligence 預測,綠色程式碼分析和最佳化軟體的市場規模預計將在 2025 年達到 5.2 億美元,2026 年達到 6.2 億美元,到 2031 年達到 20.4 億美元,2026 年至 2031 年的複合年成長率為 26.9%。
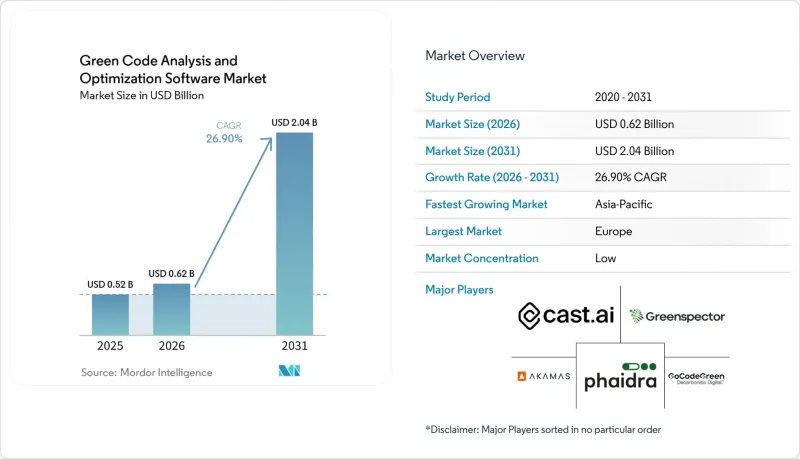
本報告按解決方案類型(例如,碳排放測量和程式碼分析)、部署模式(雲端、混合、本地部署)、企業規模(大型企業、中小企業)、最終用戶產業(例如,IT和電信、銀行、金融服務和保險、工業製造)以及地區進行細分。市場預測以價值(美元)表示。
全球綠色程式碼分析與最佳化軟體市場趨勢及洞察
軟體領域對碳管治的需求日益成長
企業軟體團隊不再能夠獨立決定環境資訊揭露的進度,因為揭露時間表現在由外部法規規定。 CSRD第一階段強制要求大規模上市企業揭露其2024財政年度的軟體相關排放,報告截止日期為2025年。這使得軟體相關排放從內部問題轉變為正式的報告流程。儘管2026年2月24日的綜合指令將其適用範圍限制在員工人數超過1000人且銷售額超過4.5億歐元(5.09億美元)的公司,但由於主要買家繼續透過問卷調查和合約條款將披露要求傳遞給供應商,整個供應鏈仍然面臨壓力。 「軟體碳強度」框架於2024年3月正式被採納為ISO/IEC 21031:2024標準,據綠色軟體基金會稱,微軟、NTT Data、AVEVA和瑞銀等機構已將其作為一項實用指標。此外,ISO/IEC TS 20125-1:2026 正在建立第二條標準化路徑,該標準定義了數位服務整個生命週期(從需求收集到生命週期結束)的生態設計要求。這種報告規則和技術標準的結合,為綠色程式碼分析和最佳化軟體市場提供了一條直接的採購管道,因為買家越來越要求軟體供應商展示如何衡量和管理程式碼排放。
在雲端原生環境中最佳化 AI 工作負載的壓力
人工智慧工作負載的經濟性使得軟體效率不再只是小眾的永續發展議題,而是成為了董事會層面的預算問題。預計到2025年,全球資料中心的電力消耗量將達到361.6太瓦時(TWh),到2030年將達到945太瓦時,這獎勵企業在工作負載進一步成長之前大幅削減資源浪費。 2026年4月,麻省理工學院的研究人員發布了一款快速預測工具,幫助資料中心營運商在部署前估算工作負載等級的電力消耗。該工具可直接應用於生產前軟體審查和部署計劃。谷歌也報告稱,其第七代Ironwood TPU的「計算碳排放」比上一代TPU v5p降低了3.7倍,這證實了儘管硬體效率不斷提高,但軟體層面的控制仍然至關重要。當推理需求成長速度超過工程團隊最佳化應用程式邏輯的速度時,即使是最好的硬體,其優勢也會因低效的軟體設計和可避免的令牌生成開銷而被抵消。這一差距正在推動綠色程式碼分析和最佳化軟體市場的成長,因為財務團隊現在將程式碼效率低下視為計算成本的直接原因。
整個工具鏈中綠色程式碼遙測技術的標準化程度還不夠。
綠色程式碼分析和最佳化軟體市場仍面臨許多挑戰,因為軟體碳排放測量尚未在所有工具鏈和執行環境中實現標準化。儘管 ISO/IEC 21031:2024 提供了通用的調查方法,但使用者採用此方法仍依賴不同供應商針對不同語言、服務、容器和雲端環境的實作。 MDPI 旗下期刊《軟體》(Software)發表的一項研究強調了測量粒度方面的深層問題,以及主要雲端供應商缺乏即時能源數據,迫使團隊依賴估計值而非完全測量的真實數據。這使得負責人難以在公平的條件下比較工具,從而延緩了跨多重雲端環境的大規模採購決策。綠色軟體基金會的硬體標準化工作旨在改善底層遙測功能,但業界通常需要時間來達成共識並最終採用。在團隊能夠跨程式語言和基礎設施層獲取一致的碳排放數據之前,儘管市場對綠色程式碼分析和最佳化軟體表現出濃厚的興趣,但企業採用該軟體的速度可能仍然緩慢。
細分市場分析
到2025年,「碳測量與程式碼分析」將佔據綠色程式碼分析與最佳化軟體市場29.84%的佔有率。這表明許多買家仍然先從視覺化入手,然後再進行最佳化。這一趨勢反映了工程團隊的實際需求,即首先建立基準,以證明程式碼變更、運行時調優或採購決策的合理性。 「軟體碳強度(SCI)」方法論(已正式採納為ISO/IEC 21031:2024)為買家提供了一個通用基準,並推動了對能夠持續測量排放的工具的需求。 2025年12月獲準的人工智慧SCI規範將其邏輯擴展到人工智慧的訓練、微調和推理,為先前未追蹤這些工作負載中軟體特定排放的組織創造了一個新的需求領域。 「綠色軟體開發生命週期(SDLC)和持續整合/持續交付(CI/CD)自動化」預計到2031年將以27.56%的複合年成長率成長,這表明買家正在從一次性審計轉向將持續管理融入軟體交付流程。
這項轉變意義重大,因為在綠色程式碼分析和最佳化軟體產業,責任正從孤立的ESG團隊轉移到主流工程實踐。隨著企業尋求將碳評估結果與可操作的擴展和工作負載管理聯繫起來,運行時最佳化和資源效率的衡量也在不斷擴展。永續性分析和基準測試仍然至關重要,因為採購人員在確定糾正措施的優先順序之前,需要對應用程式、團隊和業務部門進行比較。管治、合規和認證工具在高度監管的行業中越來越受歡迎,這些行業的採購團隊要求提供符合更廣泛的環境報告要求的可審計文件。 Tech Mahindra與微軟合作開發的Green CodeRefiner報告稱,現代化應用程式程式碼庫的環境影響評分提高了20-40%,這表明整合工具集可以從簡單的評分發展成為可衡量的程式碼改進方案。
到2025年,雲端將佔據綠色程式碼分析和最佳化軟體市場66.12%的佔有率。這反映了那些率先邁向軟體永續性的企業所採取的「雲端優先」策略。 SaaS交付降低了平台團隊的採用門檻,這些團隊已經在動態環境中運營,並且偏好集中式工具管理。領先供應商提供的原生雲端碳排放儀錶板也提供了一個基礎資料層,可以與第三方軟體整合,用於分析和最佳化。預計到2031年,混合部署將以27.34%的複合年成長率成長,並有望成為綠色程式碼分析和最佳化軟體市場中成長最快的部署模式。這項成長主要由受監管產業推動,這些產業要求在私有基礎設施和公共雲端中都具備碳排放可見度。
儘管本地部署規模仍然相對較小,但它們在國防、政府和受監管的金融機構等以主權為中心的環境中繼續發揮著至關重要的作用。 2026年4月,歐盟委員會授予四家供應商一份價值1.8億歐元(2.04億美元)的契約,作為其主權雲框架的一部分,並將環境永續性作為八項主權標準之一。這表明,即使在高度敏感的環境中,綠色性能也至關重要。這一點意義重大,因為需求正在從純粹的雲端原生公司擴展到那些以前將永續性工具視為可選項的買家。隨著這些環境的現代化,支援跨分散式系統統一運行視圖的混合遙測技術的價值正在不斷提升。因此,在綠色程式碼分析和最佳化軟體市場,能夠整合雲端、私人基礎設施和傳統環境,而不強迫客戶採用單一基礎設施模型的供應商將具有優勢。
區域分析
預計到2025年,歐洲將佔據綠色程式碼分析和最佳化軟體市場34.67%的佔有率,成為最大的區域貢獻者。這一主導地位源自於該地區最完善的軟體永續性環境,其中CSRD和ESRS E1等法規提高了企業報告和採購中軟體相關排放的透明度。歐盟委員會實施條例EU:2026/718將於2026年6月30日生效,該條例為淨零排放技術的公共採購程序增加了最低環境永續性要求,從而提高了政府採購中對軟體效率可審計證據的需求。歐盟委員會也於2026年6月3日提案了《雲端運算和人工智慧發展法案》,該法案明確關注節能資料中心容量和環境永續性評估規則,從而加大了對部署在區域基礎設施中的軟體的下游壓力。此外,歐洲聚集了眾多供應商,例如SonarSource、Software Improvement Group和Greenspector,這些供應商將綠色程式碼分析和最佳化軟體市場與買家和標準制定活動緊密聯繫起來。
預計到2031年,亞太地區將以28.45%的複合年成長率成長,成為綠色程式碼分析和最佳化軟體市場成長最快的區域市場。在日本,NTT於2026年3月發布的「軟體從製造到處置的二氧化碳排放計算規則」發出了重要的政策和採購訊號。這將使軟體生命週期評估與企業採購和報告需求更加緊密地結合。隨著雲端運算的快速發展、本地基礎設施的建設以及各行業數位服務的成長,該地區對軟體效率的關注度也日益提高。 Cast AI於2025年在印度和新加坡開設辦事處,並在該地區進行後續投資活動,顯示供應商正積極將亞太地區視為下一個關鍵成長區域。中國、印度、日本、韓國和澳洲在軟體採購壓力、在地化要求和雲端最佳化需求方面各有不同,這些因素共同推動了市場需求。
就綠色程式碼分析和最佳化軟體市場規模而言,北美仍是第二大區域市場。這是因為該地區的主要企業已經積極參與雲端最佳化、人工智慧基礎設施建設和財務營運(FinOps)實踐。雖然美國目前還沒有與CSRD(永續程式碼報告框架)類似的聯邦級報告框架,但由於各州的氣候課責要求和供應鏈的壓力,軟體排放仍然是企業面臨的關鍵問題。南美市場小規模,但其成長動力來自不斷擴大的雲端採用率和跨國買家日益成長的報告期望。同時,中東和非洲仍處於起步階段,國家數位化計畫才剛開始與永續發展報告需求結合。阿拉伯聯合大公國和沙烏地阿拉伯處於領先,而南非和奈及利亞的進展則較為緩慢,因為基礎設施的限制仍然限制其整個技術資產遙測資料的深度和一致性。
其他好處:
- Excel格式的市場預測(ME)表
- 3個月的分析師支持
目錄
第1章:引言
- 研究假設和市場定義
- 調查範圍
第2章:調查方法
第3章執行摘要
第4章 市場狀況
- 市場概覽
- 市場促進因素
- 軟體碳管治需求日益成長
- 可視化 CI/CD 管線中的代碼級能源浪費
- 在雲端原生環境中最佳化 AI 工作負載的壓力
- 在企業工程團隊中整合財務營運和綠色運營
- 針對注重碳排放的應用進行調度與運行時最佳化
- 主要買家的「永續設計」採購條款
- 市場限制因素
- 綠色程式碼遙測標準化在不同工具鏈中的局限性
- 核心平台團隊以外的開發人員支援存在差異。
- 與傳統 DevOps 和可觀測性堆疊整合需要付出相當大的努力。
- 僅針對程式碼的最佳化方案,其短期投資報酬率存在不確定性。
- 宏觀經濟因素對市場的影響
- 產業價值鏈分析
- 監理情勢
- 技術展望
- 波特五力分析
第5章 市場規模與成長預測
- 按解決方案類型
- 碳排放的測量與編碼分析
- 運行時最佳化和資源效率
- 綠色軟體開發生命週期和持續整合/持續交付自動化
- 永續性分析和基準測試
- 管治、合規和認證
- 部署模式
- 雲
- 混合
- 現場
- 按公司規模
- 大公司
- 小型企業
- 產業最終用途
- 資訊科技/通訊
- BFSI
- 工業製造
- 能源公用事業
- 石油和天然氣
- 零售與電子商務
- 食品和飲料製造
- 建築和基礎設施
- 政府/公共部門
- 其他終端用戶產業
- 按地區
- 北美洲
- 美國
- 加拿大
- 墨西哥
- 南美洲
- 巴西
- 其他南美國家
- 歐洲
- 德國
- 英國
- 法國
- 義大利
- 西班牙
- 俄羅斯
- 其他歐洲國家
- 亞太地區
- 中國
- 印度
- 日本
- 韓國
- 澳洲
- 其他亞太國家
- 中東
- 土耳其
- 沙烏地阿拉伯
- 阿拉伯聯合大公國
- 其他中東國家
- 非洲
- 南非
- 奈及利亞
- 其他非洲國家
- 北美洲
第6章 競爭情勢
- 市場集中度
- 策略趨勢
- 市佔率分析
- 公司簡介
- CAST AI Group Inc.
- Akamas SpA
- Phaidra Inc.
- Digital Tactics Ltd
- Greenspector
- GoCodeGreen Limited
- Software Improvement Group BV
- Greenplaces, Inc.
- GreenCode
- Electricity Maps
- CarbonAware
- open source, Green Software Directory
- Ab Ovo BV
- SustainAIOps Limited
- Kubex AI, Inc.
- EAR, Energy Aware Runtime
- EcoCode
- ecoCode
- CodeScene AB
- SonarSource SA
- CAST Software BV
第7章 市場機會與未來展望
According to Mordor Intelligence, the green code analysis and optimization software market size is projected to be USD 0.52 billion in 2025, USD 0.62 billion in 2026, and reach USD 2.04 billion by 2031, growing at a CAGR of 26.9% from 2026 to 2031.
This report is Segmented by Solution Type (Carbon Measurement and Code Analysis, and More), Deployment Mode (Cloud, Hybrid, and On-Premise), Enterprise Size (Large Enterprises, and Small and Medium-Sized Enterprises), End-Use Industry (IT and Telecom, BFSI, Industrial Manufacturing, and More), and Geography. The Market Forecasts are Provided in Terms of Value (USD).
Global Green Code Analysis and Optimization Software Market Trends and Insights
Rising Software Carbon Governance Requirements
Enterprise software teams are no longer setting their own pace on environmental disclosure because external rules now define the timetable. CSRD Wave 1 required large listed companies to disclose software-related emissions for the financial year 2024, with reporting taking place in 2025, thereby moving software-related emissions from an internal topic into formal reporting practice. The February 24, 2026, Omnibus Directive adjusted applicability to companies with more than 1,000 employees and EUR 450 million in turnover (USD 509 million), but the broader supply-chain pressure persists because large buyers continue to pass disclosure requirements to vendors through questionnaires and contract terms. The Software Carbon Intensity framework was formalized as ISO/IEC 21031:2024 in March 2024, and the Green Software Foundation states that organizations, including Microsoft, NTT DATA, AVEVA, and UBS, are already applying it as a practical measurement base. A second standards track is also forming through ISO/IEC TS 20125-1:2026, which sets ecodesign requirements across the digital service life cycle from requirements gathering to end-of-life. This mix of reporting rules and technical standards is providing the green code analysis and optimization software market with a direct procurement channel, as buyers increasingly want software vendors to demonstrate how code emissions are measured and controlled.
AI Workload Efficiency Pressure in Cloud-Native Environments
The economics of AI workloads are making software efficiency a board-level budget issue rather than a niche sustainability topic. Global data center electricity consumption reached 361.6 TWh in 2025 and is projected to reach 945 TWh by 2030, providing enterprises with a strong incentive to reduce waste before workloads scale further. In April 2026, MIT researchers published a rapid prediction tool that helps data center operators estimate workload-level power use before deployment, which fits directly into pre-production software review and deployment planning. Google also reported that its seventh-generation Ironwood TPUs deliver a 3.7x improvement in Compute Carbon Intensity over the previous TPU v5p generation, confirming that hardware efficiency is improving but not removing the need for software-side control. When inference demand rises faster than engineering teams can optimize application logic, even the best hardware can be offset by wasteful software design and avoidable token-generation overhead. That gap is expanding the market for green code analysis and optimization software, as finance teams now see code inefficiency as a direct driver of compute costs.
Limited Green Code Telemetry Standardization Across Toolchains
The green code analysis and optimization software market still faces a real friction point because software carbon measurement is not yet standardized across all toolchains and runtime environments. ISO/IEC 21031:2024 provides a common methodology, but user adoption still depends on vendor-specific implementations across languages, services, containers, and cloud environments. Research published in MDPI's Software journal highlighted persistent issues with measurement granularity and the lack of real-time energy data from major cloud providers, forcing teams to rely on estimates rather than fully instrumented actuals. That makes it harder for buyers to compare tools on a like-for-like basis and slows large procurement decisions across multi-cloud estates. The Green Software Foundation's hardware standards work is intended to improve lower-level telemetry support, but industry alignment and adoption typically take time. Until teams can capture consistent carbon data across languages and infrastructure layers, enterprise rollouts in the green code analysis and optimization software market will continue to move more slowly than interest levels suggest.
Other drivers and restraints analyzed in the detailed report include:
- Code-Level Energy Waste Visibility in CI/CD Pipelines
- FinOps and GreenOps Convergence in Enterprise Engineering Teams
- High Integration Effort With Legacy DevOps and Observability Stacks
For complete list of drivers and restraints, kindly check the Table Of Contents.
Segment Analysis
Carbon Measurement and Code Analysis held 29.84% of the green code analysis and optimization software market share in 2025, which shows that most buyers still begin with visibility before moving to optimization. That pattern reflects the practical need to establish a baseline before engineering teams can justify code changes, runtime tuning, or procurement decisions. The Software Carbon Intensity method, formalized as ISO/IEC 21031:2024, is providing buyers with a common reference point, strengthening demand for tools that can measure emissions consistently. The SCI for AI specification, ratified in December 2025, extended that logic into AI training, fine-tuning, and inference, adding a new demand layer for organizations that did not previously track software-specific emissions in those workloads. Green SDLC and CI/CD Automation is projected to expand at a 27.56% CAGR through 2031, indicating that buyers are moving from stand-alone audits to continuous controls embedded in software delivery.
This change matters because the green code analysis and optimization software industry is shifting accountability away from isolated ESG teams and into mainstream engineering practice. Runtime Optimization and Resource Efficiency are growing alongside measurement, as enterprises seek to translate carbon diagnostics into practical rightsizing and workload actions. Sustainability Analytics and Benchmarking also remain relevant, since buyers need comparison views across applications, teams, and business units before they can prioritize remediation. Governance, Compliance, and Certification tools are gaining traction in regulated sectors, where procurement teams seek audit-ready documentation aligned with broader environmental reporting expectations. Tech Mahindra's Green CodeRefiner, built with Microsoft, reported a 20% to 40% improvement in green impact scores across modernized application codebases, demonstrating that integrated tooling can move beyond scoring into measurable code-improvement programs.
Cloud accounted for a 66.12% share of the green code analysis and optimization software market in 2025, reflecting the cloud-first posture of enterprises that moved earliest toward software sustainability. SaaS delivery lowers deployment friction for platform teams that already operate in dynamic environments and prefer centralized tool administration. Native cloud carbon dashboards from major providers also provide a basic data layer that can connect with third-party software for analysis and optimization. Hybrid deployment is projected to grow at a 27.34% CAGR through 2031, making it the fastest-growing deployment model in the green code analysis and optimization software market. That growth is being driven by regulated sectors that need carbon visibility across both private infrastructure and public cloud.
On-premise deployment remains smaller, but it still serves sovereignty-sensitive environments in defense, government, and regulated financial institutions. The European Commission's Sovereign Cloud Framework awarded an EUR 180 million contract, or USD 204 million, to four providers in April 2026 and included environmental sustainability as 1 of 8 sovereignty criteria, which signals that even sensitive environments are being asked to address green performance. That is important because it broadens demand beyond purely cloud-native organizations and into buyers that previously treated sustainability tooling as optional. As these estates modernize, hybrid telemetry becomes more valuable because it supports a single operating view across distributed systems. The green code analysis and optimization software market, therefore, favors vendors that can connect cloud, private infrastructure, and legacy estates without forcing clients into a single infrastructure model.
Complete Report Scope:
- By Solution Type
- Carbon Measurement and Code Analysis
- Runtime Optimization and Resource Efficiency
- Green SDLC and CI/CD Automation
- Sustainability Analytics and Benchmarking
- Governance, Compliance and Certification
- By Deployment Mode
- Cloud
- Hybrid
- On-Premise
- By Enterprise Size
- Large Enterprises
- Small and Medium-Sized Enterprises
- By End-Use Industry
- IT and Telecom
- BFSI
- Industrial Manufacturing
- Energy and Utilities
- Oil and Gas
- Retail and E-Commerce
- Food and Beverage Manufacturing
- Construction and Infrastructure
- Government and Public Sector
- Other End-User Industries
- By Geography
- North America
- United States
- Canada
- Mexico
- South America
- Brazil
- Rest of South America
- Europe
- Germany
- United Kingdom
- France
- Italy
- Spain
- Russia
- Rest of Europe
- Asia-Pacific
- China
- India
- Japan
- South Korea
- Australia
- Rest of Asia-Pacific
- Middle East
- Turkey
- Saudi Arabia
- United Arab Emirates
- Rest of Middle East
- Africa
- South Africa
- Nigeria
- Rest of Africa
- North America
Geography Analysis
Europe held 34.67% of the green code analysis and optimization software market share in 2025, making it the largest regional contributor. The region's lead comes from the most formal software sustainability environment, where CSRD and ESRS E1 have made software-related emissions more visible in enterprise reporting and procurement. Commission Implementing Regulation EU: 2026/718, applicable from June 30, 2026, adds minimum environmental sustainability requirements to public procurement procedures covering net-zero technologies, thereby strengthening demand for auditable evidence of software efficiency in government buying. The European Commission also proposed the Cloud and AI Development Act on June 3, 2026, with explicit focus on energy-efficient data center capacity and environmental sustainability rating rules, which increases downstream pressure on software deployed in regional infrastructure. Europe also benefits from a dense vendor base that includes SonarSource, Software Improvement Group, and Greenspector, which keeps the green code analysis and optimization software market close to both buyers and standard-setting activity.
Asia-Pacific is projected to grow at a 28.45% CAGR through 2031, making it the fastest-growing regional segment in the green code analysis and optimization software market. Japan is providing an important policy and procurement signal through NTT's March 2026 cradle-to-grave software CO2 calculation rules, which align software life-cycle measurement more closely with enterprise purchasing and reporting needs. The region also combines rapid cloud expansion, local infrastructure build-out, and rising interest in software efficiency as digital services scale across industries. Cast AI's 2025 office openings in India and Singapore, followed by later regional investment activity, show that vendors are actively prioritizing Asia-Pacific as the next major growth zone. China, India, Japan, South Korea, and Australia each add demand through different mixes of software procurement pressures, localization requirements, and cloud-optimization needs.
North America remained the second-largest regional market for green code analysis and optimization software because large enterprises in the region are already active in cloud optimization, AI infrastructure build-out, and FinOps practices. The United States does not yet have a single federal reporting framework equal to CSRD, but state-level climate accountability requirements and supply-chain pressure still keep software emissions on the enterprise agenda. South America is still a smaller market, led by growing cloud adoption and reporting expectations from multinational buyers, while the Middle East and Africa remain earlier-stage regions where national digital programs are beginning to intersect with sustainability reporting needs. The United Arab Emirates and Saudi Arabia are emerging first, while South Africa and Nigeria are moving more gradually because infrastructure constraints still limit the depth and consistency of telemetry across technology estates.
- CAST AI Group Inc.
- Akamas S.p.A.
- Phaidra Inc.
- Digital Tactics Ltd
- Greenspector
- GoCodeGreen Limited
- Software Improvement Group B.V.
- Greenplaces, Inc.
- GreenCode
- Electricity Maps
- CarbonAware
- open source, Green Software Directory
- Ab Ovo B.V.
- SustainAIOps Limited
- Kubex AI, Inc.
- EAR, Energy Aware Runtime
- EcoCode
- ecoCode
- CodeScene AB
- SonarSource S.A.
- CAST Software B.V.
Additional Benefits:
- The market estimate (ME) sheet in Excel format
- 3 months of analyst support
TABLE OF CONTENTS
1 INTRODUCTION
- 1.1 Study Assumptions and Market Definition
- 1.2 Scope of the Study
2 RESEARCH METHODOLOGY
3 EXECUTIVE SUMMARY
4 MARKET LANDSCAPE
- 4.1 Market Overview
- 4.2 Market Drivers
- 4.2.1 Rising Software Carbon Governance Requirements
- 4.2.2 Code-Level Energy Waste Visibility In CI/CD Pipelines
- 4.2.3 AI Workload Efficiency Pressure In Cloud-Native Environments
- 4.2.4 FinOps and GreenOps Convergence In Enterprise Engineering Teams
- 4.2.5 Carbon-Aware Application Scheduling And Runtime Optimization
- 4.2.6 Sustainability-by-Design Procurement Clauses From Large Buyers
- 4.3 Market Restraints
- 4.3.1 Limited Green Code Telemetry Standardization Across Toolchains
- 4.3.2 Fragmented Developer Buy-In Beyond Core Platform Teams
- 4.3.3 High Integration Effort With Legacy DevOps And Observability Stacks
- 4.3.4 Ambiguous Short-Term ROI For Code-Only Optimization Programs
- 4.4 Impact of Macroeconomic Factors on the Market
- 4.5 Industry Value-Chain Analysis
- 4.6 Regulatory Landscape
- 4.7 Technological Outlook
- 4.8 Porter's Five Forces Analysis
- 4.8.1 Bargaining Power of Buyers
- 4.8.2 Bargaining Power of Suppliers
- 4.8.3 Threat of New Entrants
- 4.8.4 Threat of Substitutes
- 4.8.5 Intensity of Competitive Rivalry
5 MARKET SIZE AND GROWTH FORECASTS (VALUE)
- 5.1 By Solution Type
- 5.1.1 Carbon Measurement and Code Analysis
- 5.1.2 Runtime Optimization and Resource Efficiency
- 5.1.3 Green SDLC and CI/CD Automation
- 5.1.4 Sustainability Analytics and Benchmarking
- 5.1.5 Governance, Compliance and Certification
- 5.2 By Deployment Mode
- 5.2.1 Cloud
- 5.2.2 Hybrid
- 5.2.3 On-Premise
- 5.3 By Enterprise Size
- 5.3.1 Large Enterprises
- 5.3.2 Small and Medium-Sized Enterprises
- 5.4 By End-Use Industry
- 5.4.1 IT and Telecom
- 5.4.2 BFSI
- 5.4.3 Industrial Manufacturing
- 5.4.4 Energy and Utilities
- 5.4.5 Oil and Gas
- 5.4.6 Retail and E-Commerce
- 5.4.7 Food and Beverage Manufacturing
- 5.4.8 Construction and Infrastructure
- 5.4.9 Government and Public Sector
- 5.4.10 Other End-User Industries
- 5.5 By Geography
- 5.5.1 North America
- 5.5.1.1 United States
- 5.5.1.2 Canada
- 5.5.1.3 Mexico
- 5.5.2 South America
- 5.5.2.1 Brazil
- 5.5.2.2 Rest of South America
- 5.5.3 Europe
- 5.5.3.1 Germany
- 5.5.3.2 United Kingdom
- 5.5.3.3 France
- 5.5.3.4 Italy
- 5.5.3.5 Spain
- 5.5.3.6 Russia
- 5.5.3.7 Rest of Europe
- 5.5.4 Asia-Pacific
- 5.5.4.1 China
- 5.5.4.2 India
- 5.5.4.3 Japan
- 5.5.4.4 South Korea
- 5.5.4.5 Australia
- 5.5.4.6 Rest of Asia-Pacific
- 5.5.5 Middle East
- 5.5.5.1 Turkey
- 5.5.5.2 Saudi Arabia
- 5.5.5.3 United Arab Emirates
- 5.5.5.4 Rest of Middle East
- 5.5.6 Africa
- 5.5.6.1 South Africa
- 5.5.6.2 Nigeria
- 5.5.6.3 Rest of Africa
- 5.5.1 North America
6 COMPETITIVE LANDSCAPE
- 6.1 Market Concentration
- 6.2 Strategic Moves
- 6.3 Market Share Analysis
- 6.4 Company Profiles (includes Global Level Overview, Market Level Overview, Core Segments, Financials as available, Strategic Information, Market Rank/Share, Products and Services, Recent Developments)
- 6.4.1 CAST AI Group Inc.
- 6.4.2 Akamas S.p.A.
- 6.4.3 Phaidra Inc.
- 6.4.4 Digital Tactics Ltd
- 6.4.5 Greenspector
- 6.4.6 GoCodeGreen Limited
- 6.4.7 Software Improvement Group B.V.
- 6.4.8 Greenplaces, Inc.
- 6.4.9 GreenCode
- 6.4.10 Electricity Maps
- 6.4.11 CarbonAware
- 6.4.12 open source, Green Software Directory
- 6.4.13 Ab Ovo B.V.
- 6.4.14 SustainAIOps Limited
- 6.4.15 Kubex AI, Inc.
- 6.4.16 EAR, Energy Aware Runtime
- 6.4.17 EcoCode
- 6.4.18 ecoCode
- 6.4.19 CodeScene AB
- 6.4.20 SonarSource S.A.
- 6.4.21 CAST Software B.V.
7 MARKET OPPORTUNITIES AND FUTURE OUTLOOK
- 7.1 White-Space and Unmet-Need Assessment

 2026-2030年全球數位化工作指導軟體市場
 程序化招募平台:市場佔有率分析、產業趨勢與統計及成長預測(2026-2031 年)
 全球數據壓縮軟體市場規模、佔有率、趨勢和成長分析報告(2026-2034年)
 數位 OSS/BSS 市場預測至 2034 年—按組件、部署模式、雲端類型、組織規模、應用程式、最終用戶和地區分類的全球分析數位社群互動解決方案市場預測至2034年-按組件、部署模式、組織規模、技術、應用、最終用戶和地區分類的全球分析
 2026-2030年全球生產調度軟體市場
 2026年全球敏捷物聯網(IoT)市場報告2026年全球職業發展軟體市場報告人工智慧驅動的生產調度市場預測至2034年:按組件、資料來源、安全標準、應用、最終用戶和地區分類的全球分析埃格斯特朗節點市場預測至2034年-按技術、應用、最終用戶和地區分類的全球分析