

 |
市場調查報告書
商品編碼
2066775
歐洲電動車充電基礎設施:市場佔有率分析、產業趨勢和統計數據以及成長預測(2026-2031 年)Europe Electric Vehicle (EV) Charging Equipment - Market Share Analysis, Industry Trends & Statistics, Growth Forecasts (2026 - 2031) |
||||||
※ 本網頁內容可能與最新版本有所差異。詳細情況請與我們聯繫。
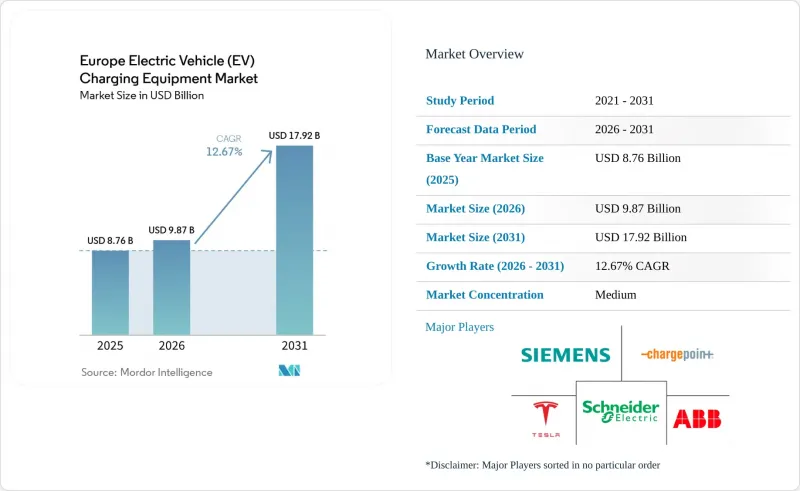
據 Mordor Intelligence 稱,歐洲電動車充電基礎設施市場預計到 2026 年價值 98.7 億美元,高於 2025 年的 87.6 億美元,預計到 2031 年將達到 179.2 億美元。
預計 2026 年至 2031 年的複合年成長率為 12.67%。
本報告按充電等級(1 級、2 級、直流快速充電、超快速充電、兆瓦級)、安裝地點(住宅、商業/零售設施、公共設施、交通樞紐)、應用(家庭、職場、城市公共場所、高速公路/交通運輸和車輛/維護基地)以及地區(德國、英國、法國、西班牙、荷蘭、挪威等)進行分類。
歐洲電動車充電基礎設施市場的趨勢與洞察。
擴大電動車的普及及相關投資
預計到2024年,全新電池式電動車)註冊量將達到320萬輛,歐洲汽車製造商協會(ACEA)預測,到2030年,道路上行駛的電動車將超過5000萬輛。汽車製造商目前正將高功率充電設施的投資納入其產品策略。光是IONITY聯盟就已在2024年前獲得7億歐元的資金,並計畫將350kW充電樁的數量增加到7,000個。車輛數量的成長將提高充電樁的利用率,從而提高設備供應商收入的穩定性。車隊採購商將基於主要路線的覆蓋範圍而非消費者補貼來採購,從而確保對硬體的長期穩定需求。
政府主導的公共充電網路的擴展
成員國已撥款超過100億歐元用於2024年至2030年間公共充電基礎設施的建設,其中德國的55億歐元「德國網路」(Deutschlandnetz)計畫領跑,法國也投入19億歐元用於高速公路走廊的再投資。競標框架明確規定了最低功率輸出和互通性要求,因此供應商強調認證計量和遠端更新功能。雖然競爭性競標會對利潤率造成壓力,但多年期合約可以透過大規模部署帶來的規模經濟來抵消部分價格壓力。
安裝和併網成本高昂
部署一台150千瓦的快速充電樁成本可能高達30萬歐元,其中併網成本有時幾乎佔總成本的一半。農村地區的安裝通常需要鋪設數公里的電線和安裝新的變壓器,這提高了運轉率平衡點。為了克服這些障礙,供應商正在推廣模組化機櫃,這種機櫃可為多個50千瓦的充電樁供電,透過犧牲部分尖峰時段充電速度來降低併網成本。
細分市場分析
預計功率超過 350 千瓦的兆瓦級充電樁將以 23.88% 的複合年成長率成長,這主要得益於卡車電氣化法規要求充電時間縮短至 30 分鐘以內,與柴油車相當。 Milence 公司於 2024 年在安特衛普-布魯日安裝了首個商用 1 兆瓦系統,證明了該技術的可行性。到 2025 年,二級充電基礎設施將保持 46.85% 的市場佔有率,這得益於歐洲電動車充電基礎設施市場廣泛的住宅和職場用戶群。隨著車隊營運商和高速公路營運商直接轉向超快速充電技術,專注於中功率直流硬體的供應商正感受到壓力。儘管二級充電樁在歐洲電動車充電基礎設施市場仍佔據相當大的佔有率,但成長速度更有利於高功率樁。
國內交流電專家正在相應地調整戰略。 Alphen將於2025年初停止中中功率直流電的生產,轉而專注於大批量交流電產品線;西門子則透過與E.ON的合作,擴展了其300kW平台。營運商往往更傾向於能夠提供硬體、軟體和維護一體化服務的供應商,這有利於提供垂直整合服務的公司。隨著兆瓦級系統的部署預計將加速,到本十年末,歐洲電動車充電基礎設施市場中高功率系統的佔有率預計將從目前的個位數百分比上升至20%左右。
其他好處:
- Excel格式的市場預測(ME)表
- 3個月的分析師支持
目錄
第1章:引言
- 研究假設和市場定義
- 調查範圍
第2章:調查方法
第3章執行摘要
第4章 市場狀況
- 市場概覽
- 市場促進因素
- 擴大電動車的普及及相關投資
- 政府主導的公共充電網路擴建
- 歐盟 AFIR 規定,沿著 TEN-T 走廊的快速充電樁間距為 60 公里(2025 年)。
- 透過電網調整產生的收入來源(V2G 和動態定價)實現充電樁的投資回報率。
- 零售能源企業將家用太陽能發電系統和電動車充電器捆綁銷售。
- 市場限制因素
- 安裝和併網成本高昂
- 電力分配網路擁塞和變壓器更換延誤。
- AFIR 未涵蓋的分散式支付和漫遊標準
- 不斷上漲的電價正在擠壓充電業者的利潤空間。
- 供應鏈分析
- 監理情勢
- 技術展望
- 波特五力模型
第5章 市場規模與成長預測
- 按充電等級
- 1 級(3 千瓦或以下)
- 2級(3-50千瓦)
- 直流快速充電(50-150千瓦)
- 超快速充電(150-350千瓦)
- 兆瓦級(350千瓦或以上)
- 按安裝位置
- 住宅
- 商業和零售
- 公共/市政
- 交通樞紐(機場、港口)
- 透過使用
- 家用充電
- 職場中充電
- 都市區的公共充電站
- 高速公路/行駛中快速充電
- 車輛組和停車場的充電
- 按地區
- 德國
- 英國
- 法國
- 義大利
- 西班牙
- 荷蘭
- 挪威
- 俄羅斯
- 其他歐洲國家
第6章 競爭情勢
- 市場集中度
- 策略趨勢(併購、聯盟、購電協議)
- 市場佔有率分析(主要公司的市場排名和佔有率)
- 公司簡介
- ABB Ltd
- Schneider Electric SE
- Siemens AG
- Tesla Inc.
- ChargePoint Holdings Inc.
- Delta Electronics Inc.
- Robert Bosch GmbH
- EVBox Group
- Alfen NV
- Power Electronics SL
- Wallbox NV
- Kempower Oyj
- IONITY GmbH
- Fastned BV
- Enel X Way SpA
- BP Pulse(BP plc)
- Shell Recharge(Shell plc)
- E.ON Drive GmbH
- Allego NV
- Eaton Corporation plc
第7章 市場機會與未來展望
According to Mordor Intelligence, the europe electric vehicle charging equipment market size in 2026 is estimated at USD 9.87 billion, growing from 2025 value of USD 8.76 billion with 2031 projections showing USD 17.92 billion, growing at 12.67% CAGR over 2026-2031.
This report is Segmented by Charging Level (Level 1, Level 2, DC Fast, Ultra-Fast, and Megawatt Class), Installation Site (Residential, Commercial and Retail, Public Municipal, and Transportation Hubs), Application (Home, Workplace, Public Urban, Highway Corridor/En-Route, and Fleet and Depot), and Geography (Germany, United Kingdom, France, Spain, Netherlands, Norway, and More).
Europe Electric Vehicle (EV) Charging Equipment Market Trends and Insights
Growing Adoption of EVs and Related Investments
Battery-electric vehicle registrations reached 3.2 million units in 2024, and the European Automobile Manufacturers' Association projects a fleet of more than 50 million EVs on the road by 2030. Automakers now embed high-power charging investments into product strategies; the IONITY consortium alone secured EUR 700 million in 2024 to grow its network to 7,000 chargers rated at 350 kW. Higher vehicle volumes raise charger utilization, which improves revenue certainty for equipment suppliers. Fleet buyers base procurement on corridor coverage rather than consumer subsidies, stabilizing long-term hardware demand.
Government-Backed Expansion of Public-Charging Networks
Member states have allocated more than EUR 10 billion for public-charging deployments between 2024 and 2030, led by Germany's EUR 5.5 billion Deutschlandnetz program and France's EUR 1.9 billion reinvestment in highway corridors. Tender frameworks specify minimum power outputs and interoperability features, so hardware vendors emphasize certified metering and remote-update capability. Competitive bidding squeezes margins, but multi-year contracts offset price pressure through volume scale.
High Installation and Grid-Connection Costs
Deploying a 150 kW fast charger can cost up to EUR 300,000, with grid fees comprising as much as half of the total. Rural sites often need kilometer-scale cabling and new transformers, which escalates break-even utilization levels. To ease barriers, suppliers promote modular cabinets that feed several 50 kW dispensers, trading peak speed for lower connection charges.
Other drivers and restraints analyzed in the detailed report include:
- EU AFIR Fast-Charger Mandate
- Grid-Balancing Revenue Streams Unlocking Charger ROI
- Distribution-Grid Congestion and Transformer Delays
For complete list of drivers and restraints, kindly check the Table Of Contents.
Segment Analysis
Megawatt units above 350 kW are poised for a 23.88% CAGR, buoyed by truck electrification mandates that call for sub-30-minute refueling parity with diesel. Milence installed the first commercial 1 MW system at Antwerp-Bruges in 2024, demonstrating technical feasibility. Level 2 equipment retained a 46.85% share in 2025, thanks to the vast residential and workplace base across the European electric vehicle charging equipment market. Vendors that specialize in mid-range DC hardware feel pressure as fleet operators and highway concessionaires leapfrog directly to ultra-fast technology. The European electric vehicle charging equipment market size for Level 2 remains significant, yet growth rates favor higher power segments.
Domestic AC specialists shift their strategy accordingly. Alfen exited mid-range DC manufacturing in early 2025 to focus on high-volume AC lines, while Siemens broadened its 300-kW platform through a partnership with E.ON. Operators prefer suppliers able to bundle hardware, software, and maintenance, which favors companies with vertically integrated offerings. The expected acceleration in megawatt deployments should raise the European electric vehicle charging equipment market share of high-power systems from today's single-digit baseline toward the low-twenties by decade-end.
List of Companies Covered in this Report:
- ABB Ltd
- Schneider Electric SE
- Siemens AG
- Tesla Inc.
- ChargePoint Holdings Inc.
- Delta Electronics Inc.
- Robert Bosch GmbH
- EVBox Group
- Alfen N.V.
- Power Electronics S.L.
- Wallbox N.V.
- Kempower Oyj
- IONITY GmbH
- Fastned B.V.
- Enel X Way S.p.A.
- BP Pulse (BP p.l.c.)
- Shell Recharge (Shell p.l.c.)
- E.ON Drive GmbH
- Allego N.V.
- Eaton Corporation plc
Additional Benefits:
- The market estimate (ME) sheet in Excel format
- 3 months of analyst support
TABLE OF CONTENTS
1 Introduction
- 1.1 Study Assumptions & Market Definition
- 1.2 Scope of the Study
2 Research Methodology
3 Executive Summary
4 Market Landscape
- 4.1 Market Overview
- 4.2 Market Drivers
- 4.2.1 Growing adoption of EVs & related investments
- 4.2.2 Government-backed expansion of public-charging networks
- 4.2.3 EU AFIR mandate for ?60 km fast-charger spacing on TEN-T corridors (2025)
- 4.2.4 Grid-balancing revenue streams (V2G & dynamic tariffs) unlocking charger ROI
- 4.2.5 Retail-energy players bundling home-solar + EV chargers
- 4.3 Market Restraints
- 4.3.1 High installation & grid-connection costs
- 4.3.2 Distribution-grid congestion & transformer upgrade delays
- 4.3.3 Fragmented payments/roaming standards outside AFIR scope
- 4.3.4 Rising electricity prices squeezing charger-operator margins
- 4.4 Supply-Chain Analysis
- 4.5 Regulatory Landscape
- 4.6 Technological Outlook
- 4.7 Porter's Five Forces
- 4.7.1 Bargaining Power of Suppliers
- 4.7.2 Bargaining Power of Consumers
- 4.7.3 Threat of New Entrants
- 4.7.4 Threat of Substitute Products & Services
- 4.7.5 Intensity of Competitive Rivalry
5 Market Size & Growth Forecasts
- 5.1 By Charging Level
- 5.1.1 Level 1 (Up to 3 kW)
- 5.1.2 Level 2 (3 to 50 kW)
- 5.1.3 DC Fast (50 to 150 kW)
- 5.1.4 Ultra-Fast (150 to 350 kW)
- 5.1.5 Megawatt Class (Above 350 kW)
- 5.2 By Installation Site
- 5.2.1 Residential
- 5.2.2 Commercial and Retail
- 5.2.3 Public Municipal
- 5.2.4 Transportation Hubs (Airports, Ports)
- 5.3 By Application
- 5.3.1 Home Charging
- 5.3.2 Workplace Charging
- 5.3.3 Public Urban Charging
- 5.3.4 Highway Corridor/En-Route Fast Charging
- 5.3.5 Fleet and Depot Charging
- 5.4 By Geography
- 5.4.1 Germany
- 5.4.2 United Kingdom
- 5.4.3 France
- 5.4.4 Italy
- 5.4.5 Spain
- 5.4.6 Netherlands
- 5.4.7 Norway
- 5.4.8 Russia
- 5.4.9 Rest of Europe
6 Competitive Landscape
- 6.1 Market Concentration
- 6.2 Strategic Moves (M&A, Partnerships, PPAs)
- 6.3 Market Share Analysis (Market Rank/Share for key companies)
- 6.4 Company Profiles (includes Global level Overview, Market level overview, Core Segments, Financials as available, Strategic Information, Products & Services, and Recent Developments)
- 6.4.1 ABB Ltd
- 6.4.2 Schneider Electric SE
- 6.4.3 Siemens AG
- 6.4.4 Tesla Inc.
- 6.4.5 ChargePoint Holdings Inc.
- 6.4.6 Delta Electronics Inc.
- 6.4.7 Robert Bosch GmbH
- 6.4.8 EVBox Group
- 6.4.9 Alfen N.V.
- 6.4.10 Power Electronics S.L.
- 6.4.11 Wallbox N.V.
- 6.4.12 Kempower Oyj
- 6.4.13 IONITY GmbH
- 6.4.14 Fastned B.V.
- 6.4.15 Enel X Way S.p.A.
- 6.4.16 BP Pulse (BP p.l.c.)
- 6.4.17 Shell Recharge (Shell p.l.c.)
- 6.4.18 E.ON Drive GmbH
- 6.4.19 Allego N.V.
- 6.4.20 Eaton Corporation plc
7 Market Opportunities & Future Outlook
- 7.1 White-space & Unmet-need Assessment
 英國電動車充電基礎設施:市場佔有率分析、行業趨勢和統計數據以及成長預測(2026-2031 年)
 電動車公共充電網路市場預測至2034年:按充電樁類型、連接方式、位置、所有權/營運模式和區域分類的全球分析電動車充電機器人市場預測至2034年—按產品類型、充電技術、充電速度、應用、最終用戶和地區分類的全球分析下一代電動車充電網路市場預測:至2034年-全球分析(按充電器類型、輸出功率、連接器類型、車輛型號、安裝類型、連接方式、應用、最終用戶和地區分類)
 電動車充電站市場(含廣告看板):依廣告形式、充電器類型、安裝位置、網路類型和最終用戶分類,全球預測,2026-2032年電動車充電主動濾波器按充電站類型、濾波器配置、額定輸出功率和最終用戶分類,全球預測,2026-2032年電動車充電濾波器市場按濾波器類型、濾波器拓撲結構、額定電流、應用和最終用戶分類-全球預測,2026-2032年電動車智慧充電控制器市場:按充電等級、模式、通訊技術、交付方式、車輛類型、應用和最終用戶分類-2026-2032年全球預測日本電動車充電設備市場佔有率分析、產業趨勢及統計、成長預測(2026-2031)
 日本電動車充電設備市場規模、佔有率、趨勢及預測(按充電站、最終用途和地區分類,2026-2034年)