


 |
市場調查報告書
商品編碼
2066769
建築和拆除廢棄物管理:市場佔有率分析、行業趨勢和統計數據、成長預測(2026-2031 年)Construction And Demolition Waste Management - Market Share Analysis, Industry Trends & Statistics, Growth Forecasts (2026 - 2031) |
||||||

※ 本網頁內容可能與最新版本有所差異。詳細情況請與我們聯繫。
據 Mordor Intelligence 稱,2025 年建築和拆除廢棄物管理市場價值為 1,162 億美元,預計到 2031 年將達到 1,671 億美元,而 2026 年為 1,235 億美元,預測期內(2026-2031 年)的複合年成長率為 6.23%預計為 6.23%。
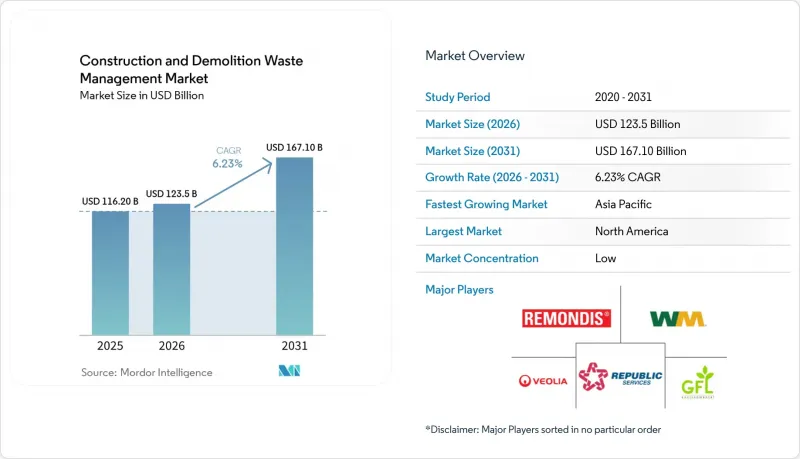
本報告按廢棄物類型(非危險廢棄物、危險廢棄物)、材料(混凝土/磚塊、瀝青、金屬、木材、土壤/沙子、石膏及其他)、服務(收集/運輸、分類/分離、回收、掩埋)和地區(北美、南美、歐洲、亞太、中東和非洲)進行細分。市場預測以美元計價。
全球建築及拆除廢棄物管理市場趨勢及洞察
廢棄物分類、處理和回收設備的技術進步
自動化和人工智慧正在重新定義混合建築和拆除廢棄物回收的經濟效益,提高了礦物和非礦物成分識別的準確性、純度和一致性。特雷克斯的第四代ZenRobotics系統將辨識能力擴展到500多種廢棄物類別,並實現了每分鐘高達80次的揀選速度。這使得塑膠和木材流的大規模、更清潔的分離成為可能。阿爾託大學的一項研究發現,當工人的年薪超過20,980歐元時,使用電腦視覺的自動化分類可以將相對成本降低27%,所需人員數量可以比傳統生產線減少91.7%,從而提高工廠的獲利能力。數位化也在提高高負載應用的處理能力;HAZEMAG的「4.0回收工廠」每小時可處理300噸,並整合了配方管理和皮帶稱重等分析功能,以滿足終端市場的品質要求。解決污染問題至關重要,因為管理不善的廢物流造成的全球外部成本巨大。目前,機器人感測器能夠識別木材上的油漆等細微特徵,從而改善回收利用的途徑。
政府制定了嚴格的法規和政策,規範廢棄物減量和回收。
2024年至2026年間,隨著監管機構將廢棄物再利用目標與許可證和公共採購中隱含碳的報告和可追溯性要求掛鉤,政策環境變得更加嚴格。歐盟修訂後的建築產品法規強制要求提交包含碳指標的環境產品聲明(EPD),該地區的競爭力提升計畫旨在將再生材料的使用率從2024年的12.2%提高到2030年的24%。成員國正努力協調高潛力廢棄物流(例如骨材、混凝土、燒製黏土磚和石膏)的廢棄物終止標準,並增強人們對再生材料的信心。在美國,SWIFR(永續廢棄物和拆除廢棄物回收)津貼的受助者必須按材料類型報告其收集、回收和管理的建築和拆除廢棄物(C&D)的數量,從而加強對回收成果的衡量和課責。中國「十四五」循環經濟規劃設定了非鐵金屬回收的目標,力爭2025年將資源回收產業規模擴大到5兆元人民幣(約6,944億美元)。這表明基礎設施項目對回收材料的需求將持續存在。
對廢棄物管理基礎設施和設備進行了大量前期投資。
在許多地區,尤其是垃圾掩埋費低、商品價差窄的地區,建築和拆除廢棄物的收集、運輸、分類和處理所需的大量資金仍然是最大的障礙。近期的公共資助計畫旨在透過補貼和績效撥款來降低初始成本門檻,但多年期承諾和報告義務增加了地方政府和私人企業的複雜性。目前,印尼30個地方政府正在實施績效撥款模式,儘管實施能力各不相同,但這些模式表明,資金可以與源頭分類和成本回收掛鉤。同樣,寮國人民民主共和國的國家計畫將設備、運輸設施和掩埋維修與非正規工人的培訓相結合。這對於專案的實施至關重要,但也延長了達到運作前置作業時間。在已開發市場,雖然人工智慧分類機和高產能生產線需要大量資金,但由於數位化帶來的學習曲線和營運成本降低,可行性差距正在逐漸縮小。
細分市場分析
到2025年,非危險廢棄物佔比將達到97.67%,而危險廢棄物僅佔2.33%,但其年複合成長率(CAGR)在2031年之前仍高達7.21%。這反映出人們對老舊建築和基礎設施中遺留材料的日益關注。這種構成意味著建築和拆除廢棄物管理市場仍然高度重視礦物成分,而不斷加強的合規體係正促使對拆除工程中的石棉、鉛和多氯聯苯(PCBs)進行更嚴格的監測。地方許可製度和掩埋接收法規日益要求認證、通知、特殊處理和安排,有助於確保危險物質的安全運輸路線和文件記錄。縣級舉措,例如定期接收和包裝標準,也體現了危險廢棄物運輸的營運安全措施。聯邦專案規範正在限制可能導致危險廢棄物污染的現場活動,提高了整個建築和拆除廢棄物管理行業的回收率計算標準和承包商報告要求。
在非危險廢棄物領域,技術和製程的改進正在提升生產的品質和市場競爭力。水基密度分選和跳汰系統能夠實現高純度礦物分級,進而改善路基和結構應用等終端用戶的關鍵效能指標。選擇性拆除和品質保證 (QA) 的標準和規程增強了人們對再生材料的信心,從而促進了建築和拆除廢棄物管理市場中高價值再利用,並降低了降級回收的風險。數位化報告框架加強了污染控制,確保有害成分不會污染原本可回收的礦物流。這些措施共同為該領域奠定了堅實的基礎,同時,監管壓力和有針對性的基礎設施建設正在推動對小規模危險廢棄物類別的投資,預計這些類別將從較低的基數上實現更快的成長。
區域分析
到2025年,北美將佔據34.12%的市場佔有率,這反映了成熟的授權體系、區域性廢棄物再利用義務以及計畫實施中日益普及的數位化合規工具。聯邦和州政府的指南將資本津貼與可衡量的廢棄物再利用績效掛鉤,簡化了報告流程,並在仍有挑戰的地區擴大了設施部署。縣市級計畫正在實施可退還押金制度、第三方設施認證和規劃核准,從而改善現場執行情況並增強對下游設施的信心。在區域層面,各協會正專注投資建造新的物料回收設施(MRF)和傳輸設施,以擴大服務覆蓋範圍並實現物料流的內部化。這些因素共同作用,正在加強北美建築和拆除廢棄物管理市場的資源回收基礎設施和分析能力。
亞太地區是成長最快的地區,預計年複合成長率將達到7.82%,這主要得益於大規模的建設活動、快速的都市化以及重點國家不斷完善的政策框架。在中國,預計2024年將產生24.1億噸建築廢棄物,占城市固態廢棄物總量的25.9%,顯示國家和城市計畫必須大力支持建築垃圾的收集。在政策趨勢方面,「十四五」規劃設定了資源回收業市場規模達到5兆元人民幣(約6,944億美元)的目標,而城市層面的表現表明,資源利用效率仍有提升空間。日本根據《建築材料回收法》實現了97%的混凝土回收率,新加坡的綠色建築標誌(Green Mark)也對再生材料含量給予了認可,這些都顯示了規範和評估標準如何使循環材料的供應與專案目標保持一致。世界銀行在東南亞支持的計畫正在透過基於結果的津貼和成本回收措施,擴大城市層面的服務,以支持垃圾分類和廢棄物再利用。
在歐盟框架的支持下,高回收率和日益統一的廢棄物處置標準及環境產品聲明(EPD)標準正在增強跨境對再生材料的信心。該地區的目標是到2030年將再生材料的使用率從2024年的12.2%提高到24%,其中建築和拆除廢棄物是其涵蓋範圍內最大的廢棄物來源。目前正在進行的廢棄物處置標準制定工作優先考慮骨材、混凝土、磚塊和石膏,這些材料與歐洲建築和拆除廢棄物管理市場的主要礦物成分相吻合。歐盟資助的試點計畫正在展示整合了建築資訊模型(BIM)、無損檢測和人工智慧評估的結構要素和數位工具,從而推進規範制定者和建築規範官員的重要品質保證(QA)方法。政策和標準趨勢繼續傾向於高價值回收而非回填,成員國正在調整稅收和採購政策以鼓勵再生材料的採用。
其他好處:
- Excel格式的市場預測(ME)表
- 3個月的分析師支持
目錄
第1章:引言
- 研究假設和市場定義
- 調查範圍
第2章:調查方法
第3章執行摘要
第4章 市場狀況
- 市場概覽
- 市場促進因素
- 政府制定了嚴格的法規和政策,規範廢棄物減量和回收。
- 全球都市化進程和基礎建設活動不斷擴展
- 擴大循環經濟原則在建設產業的應用
- 人們越來越意識到環境永續性和減少碳足跡的重要性
- 廢棄物分類、處理和回收設備的技術進步
- 由於資源短缺,對再生建築材料的需求增加
- 市場限制因素
- 廢棄物管理基礎設施和設備的前期資本投入較高
- 建築工人缺乏意識和培訓不足
- 廢物流受到污染會降低可回收性和材料品質。
- 發展中地區缺乏先進的回收設施
- 價值供應鏈分析
- 監理情勢
- 技術展望
- 波特五力模型
- 循環經濟與物質流分析
- 環境和生命週期評估考慮因素
第5章 市場規模及成長預測(以金額為準;如有數量數據,亦會列出)
- 廢棄物類型
- 無害廢棄物
- 危險廢棄物
- 材料
- 混凝土磚
- 瀝青
- 金屬
- 木頭
- 土壤和沙子
- 石膏板和乾牆
- 其他(塑膠、玻璃)
- 按服務
- 收集和運輸
- 分類和分離
- 回收和資源回收
- 掩埋和廢物處理
- 按地區
- 北美洲
- 美國
- 加拿大
- 墨西哥
- 南美洲
- 巴西
- 阿根廷
- 智利
- 哥倫比亞
- 歐洲
- 德國
- 英國
- 法國
- 義大利
- 西班牙
- 荷蘭
- 俄羅斯
- 亞太地區
- 中國
- 印度
- 日本
- 韓國
- 澳洲
- 東南亞(印尼、越南、泰國、馬來西亞、菲律賓)
- 中東和非洲
- 阿拉伯聯合大公國
- 沙烏地阿拉伯
- 南非
- 奈及利亞
- 其他中東和非洲
- 北美洲
第6章 競爭情勢
- 市場集中度
- 策略趨勢
- 市佔率分析
- 公司簡介
- Veolia
- WM(Waste Management)
- Republic Services
- REMONDIS
- GFL Environmental
- FCC Environment
- Biffa
- Cleanaway Waste Management
- Bingo Industries
- Urbaser
- Dulsco
- Averda
- BEEAH Group
- Geocycle(Holcim)
- Holcim(ECOCycle/Aggregate Industries)
- Heidelberg Materials(ReConcrete/evoBuild)
- Sims Metal
- Waste Connections
- RE Sustainability(Ramky Enviro)
- Ragn-Sells
- SUEZ
第7章 市場機會與未來展望
According to Mordor Intelligence, the construction and demolition waste management market size was valued at USD 116.20 billion in 2025 and is estimated to grow from USD 123.5 billion in 2026 to reach USD 167.10 billion by 2031, at a CAGR of 6.23% during the forecast period (2026-2031).
This report is Segmented by Waste Type (Non-Hazardous, Hazardous), by Material (Concrete & Bricks, Asphalt, Metal, Timber, Soil & Sand, Gypsum, Others), by Service (Collection & Transportation, Sorting & Segregation, Recycling, Landfilling), and by Geography (North America, South America, Europe, Asia Pacific, Middle East and Africa). Market Forecasts are Provided in Value (USD).
Global Construction And Demolition Waste Management Market Trends and Insights
Technological Advancements in Waste Sorting, Processing, and Recycling Equipment
Automation and AI are redefining the economics of mixed C&D recovery by improving recognition, purity, and consistency across mineral and non-mineral fractions. Terex's ZenRobotics fourth-generation systems raised identification capabilities to more than 500 waste categories and achieved up to 80 picks per minute, which enables cleaner separation of plastics and wood streams at scale. Aalto University research found that computer vision-enabled automated sorting cut comparative costs by 27% when labor wages exceeded EUR 20,980 annually and reduced workforce requirements by 91.7% versus conventional lines, improving facility-level viability. Digitalization is also raising throughput in heavy-duty applications, with HAZEMAG's Recycling Plant 4.0 reaching 300 tonnes per hour and embedding analytics such as recipe management and belt weighing to match end-market quality needs. Addressing contamination is critical because the global externality cost of mismanaged waste flows has been significant, and robotic sensors now distinguish nuanced features like paint on wood to improve reuse pathways.
Stringent Government Regulations and Policies for Waste Reduction and Recycling
The policy environment intensified in 2024-2026 as regulators linked diversion targets to embodied carbon reporting and traceability requirements in permits and public procurement. The EU's revised Construction Products Regulation mandates Environmental Product Declarations with carbon indicators, while the region's competitiveness agenda targets doubling the circular material use rate to 24% by 2030 from 12.2% in 2024. Member States are working toward harmonized end-of-waste criteria for high-potential streams such as aggregates, concrete, fired clay bricks, and gypsum to build confidence in secondary materials. In the United States, SWIFR grants require grantees to report C&D tonnages collected, recycled, and managed by material type, which strengthens measurement and accountability for recovery outcomes. China's 14th Five-Year Plan on Circular Economy sets targets for recycled non-ferrous metals and a resource recycling industry valued at RMB 5 trillion (USD 694.4 billion) by 2025, signaling sustained demand for recovered materials in infrastructure programs.
High Initial Capital Investment for Waste Management Infrastructure and Equipment
Capital intensity for C&D collection, transfer, sorting, and processing remains the largest headwind in many regions, particularly where tip fees are low, and commodity spreads are thin. Recent public finance programs are designed to reduce upfront cost barriers through grants and performance-based transfers, but multi-year funding commitments and reporting obligations add complexity for local governments and private operators. Indonesia's performance-based grants approach, now rolling out across 30 local governments, shows how capital can be linked to source separation and cost recovery, although execution capacity varies. Lao PDR's national program similarly pairs equipment, transfer facilities, and landfill upgrades with training for informal workers, which is essential for uptake but adds lead time to commissioning. In advanced markets, AI sorters and high-throughput lines require significant capital, though learning curves and operating savings from digitalization are gradually closing feasibility gaps.
Other drivers and restraints analyzed in the detailed report include:
- Growing Demand for Recycled Construction Materials Due to Resource Scarcity
- Rising Adoption of Circular Economy Principles in the Construction Industry
- Contamination of Waste Streams Reducing Recyclability and Material Quality
For complete list of drivers and restraints, kindly check the Table Of Contents.
Segment Analysis
Non-hazardous waste commanded 97.67% in 2025, while hazardous waste, at 2.33%, recorded the fastest 7.21% CAGR through 2031, reflecting heightened attention to legacy materials in aging buildings and infrastructure. This mix keeps the construction and demolition waste management market focused on mineral fractions in large volumes while compliance systems strengthen oversight of asbestos, lead, and PCBs in demolition workflows. Local permitting and landfill acceptance rules increasingly require certifications, notification, specialized handling, and scheduling, which support safe routing and documentation for hazardous materials. County-level practices, such as appointment-only acceptance and packaging standards, also reflect the operational safeguards around hazardous streams. Federal project specifications now restrict on-site activities that could create hazardous waste crossover, which raises the bar for diversion counting and contractor reporting across the construction and demolition waste management industry.
On the non-hazardous side, technology and process improvements are enhancing the quality and marketability of outputs. Water-based density separation and jigging systems have demonstrated high-purity mineral fractions, improving performance metrics that matter to end users in road base and structural applications. Standards and protocols for selective demolition and QA are fostering trust in recycled materials, which supports higher-value reuse and reduces downcycling risk in the construction and demolition waste management market. Digital reporting frameworks are tightening contamination controls and assuring that hazardous constituents are not co-mingled into otherwise recyclable mineral streams. Together, these measures help maintain the segment's strong base while channeling investment into the smaller hazardous category, which is expected to grow faster from a low base due to regulatory pressure and targeted infrastructure.
Geography Analysis
North America held 34.12% in 2025, reflecting a combination of mature permitting, local diversion mandates, and a growing use of digital compliance tools in project delivery. Federal and state guidance is linking capital grants to measured diversion outcomes, which streamlines reporting and scaling equipment deployments where gaps persist. County and city programs are adding refundable deposits, third-party facility certifications, and plan approvals that improve execution on job sites and raise confidence in downstream facilities. At the regional level, associations highlight new MRF and transfer investments that extend service coverage and internalize material flows. Together, these elements are strengthening diversion infrastructure and analytics across the construction and demolition waste management market in North America.
Asia-Pacific is the fastest-growing region with a 7.82% CAGR outlook, driven by large-scale construction activity, rapid urbanization, and an expanding policy framework in key countries. China generated 2.41 billion tonnes of construction waste in 2024, representing 25.9% of municipal solid waste, which demonstrates the scale at which national and city programs must support recovery. Policy signals include targets under the 14th Five-Year Plan for a resource recycling industry valued at RMB 5 trillion (USD 694.4 billion), and city-level performance ranges indicate room to raise utilization efficiency. Japan's 97% concrete recycling under its Construction Materials Recycling Law and Singapore's Green Mark recycled-content credits illustrate how specifications and scoring align the supply of circular materials with project goals. World Bank-backed programs in Southeast Asia are scaling city-level services with performance-based grants and cost recovery measures that support segregation and diversion.
Europe's framework is anchored by high recovery rates and increasingly harmonized standards for end-of-waste criteria and EPDs, which expand cross-border confidence in secondary materials. The region targets a 24% circular material use rate by 2030, up from 12.2% in 2024, with C&D waste as the largest stream in scope. Ongoing work on end-of-waste criteria prioritizes aggregates, concrete, bricks, and gypsum, which align with the mineral fractions that dominate the construction and demolition waste management market size in Europe. EU-funded pilots have validated structural elements and digital tools that link BIM, non-destructive testing, and AI assessments, advancing QA methods that will matter to specifiers and code officials. The policy and standards trajectory continues to support high-value recycling over backfilling, with Member States adjusting tax and procurement levers to reward secondary material uptake.
- Veolia
- WM (Waste Management)
- Republic Services
- REMONDIS
- GFL Environmental
- FCC Environment
- Biffa
- Cleanaway Waste Management
- Bingo Industries
- Urbaser
- Dulsco
- Averda
- BEEAH Group
- Geocycle (Holcim)
- Holcim (ECOCycle/Aggregate Industries)
- Heidelberg Materials (ReConcrete/evoBuild)
- Sims Metal
- Waste Connections
- RE Sustainability (Ramky Enviro)
- Ragn-Sells
- SUEZ
Additional Benefits:
- The market estimate (ME) sheet in Excel format
- 3 months of analyst support
TABLE OF CONTENTS
1 Introduction
- 1.1 Study Assumptions & Market Definition
- 1.2 Scope of the Study
2 Research Methodology
3 Executive Summary
4 Market Landscape
- 4.1 Market Overview
- 4.2 Market Drivers
- 4.2.1 Stringent Government Regulations and Policies for Waste Reduction and Recycling
- 4.2.2 Growing Urbanization and Infrastructure Development Activities Worldwide
- 4.2.3 Rising Adoption of Circular Economy Principles in Construction Industry
- 4.2.4 Increasing Awareness About Environmental Sustainability and Carbon Footprint Reduction
- 4.2.5 Technological Advancements in Waste Sorting, Processing, and Recycling Equipment
- 4.2.6 Growing Demand for Recycled Construction Materials Due to Resource Scarcity
- 4.3 Market Restraints
- 4.3.1 High Initial Capital Investment for Waste Management Infrastructure and Equipment
- 4.3.2 Lack of Awareness and Inadequate Training Among Construction Workforce
- 4.3.3 Contamination of Waste Streams Reducing Recyclability and Material Quality
- 4.3.4 Limited Availability of Advanced Recycling Facilities in Developing Regions
- 4.4 Value / Supply-Chain Analysis
- 4.5 Regulatory Landscape
- 4.6 Technological Outlook
- 4.7 Porter's Five Forces
- 4.7.1 Threat of New Entrants
- 4.7.2 Bargaining Power of Suppliers
- 4.7.3 Bargaining Power of Buyers
- 4.7.4 Threat of Substitutes
- 4.7.5 Industry Rivalry
- 4.8 Circular Economy & Material Flow Analysis
- 4.9 Environmental & Life-Cycle Assessment Considerations
5 Market Size & Growth Forecasts (value; with volume where available)
- 5.1 By Waste Type
- 5.1.1 Non-Hazardous Waste
- 5.1.2 Hazardous Waste
- 5.2 By Material
- 5.2.1 Concrete & Bricks
- 5.2.2 Asphalt
- 5.2.3 Metal
- 5.2.4 Timber
- 5.2.5 Soil and Sand
- 5.2.6 Gypsum & Drywall
- 5.2.7 Others (Plastic, Glass)
- 5.3 By Service
- 5.3.1 Collection & Transportation
- 5.3.2 Sorting & Segregation
- 5.3.3 Recycling & Material Recovery
- 5.3.4 Landfilling & Disposal
- 5.4 By Geography
- 5.4.1 North America
- 5.4.1.1 United States
- 5.4.1.2 Canada
- 5.4.1.3 Mexico
- 5.4.2 South America
- 5.4.2.1 Brazil
- 5.4.2.2 Argentina
- 5.4.2.3 Chile
- 5.4.2.4 Colombia
- 5.4.3 Europe
- 5.4.3.1 Germany
- 5.4.3.2 United Kingdom
- 5.4.3.3 France
- 5.4.3.4 Italy
- 5.4.3.5 Spain
- 5.4.3.6 Netherlands
- 5.4.3.7 Russia
- 5.4.4 Asia Pacific
- 5.4.4.1 China
- 5.4.4.2 India
- 5.4.4.3 Japan
- 5.4.4.4 South Korea
- 5.4.4.5 Australia
- 5.4.4.6 Southeast Asia (Indonesia, Vietnam, Thailand, Malaysia, Philippines)
- 5.4.5 Middle East
- 5.4.5.1 United Arab Emirates
- 5.4.5.2 Saudi Arabia
- 5.4.5.3 South Africa
- 5.4.5.4 Nigeria
- 5.4.5.5 Rest of Middle East And Africa
- 5.4.1 North America
6 Competitive Landscape
- 6.1 Market Concentration
- 6.2 Strategic Moves
- 6.3 Market Share Analysis
- 6.4 Company Profiles {(includes Global level Overview, Market level overview, Core Segments, Financials as available, Strategic Information, Market Rank/Share for key companies, Products & Services, and Recent Developments)}
- 6.4.1 Veolia
- 6.4.2 WM (Waste Management)
- 6.4.3 Republic Services
- 6.4.4 REMONDIS
- 6.4.5 GFL Environmental
- 6.4.6 FCC Environment
- 6.4.7 Biffa
- 6.4.8 Cleanaway Waste Management
- 6.4.9 Bingo Industries
- 6.4.10 Urbaser
- 6.4.11 Dulsco
- 6.4.12 Averda
- 6.4.13 BEEAH Group
- 6.4.14 Geocycle (Holcim)
- 6.4.15 Holcim (ECOCycle/Aggregate Industries)
- 6.4.16 Heidelberg Materials (ReConcrete/evoBuild)
- 6.4.17 Sims Metal
- 6.4.18 Waste Connections
- 6.4.19 RE Sustainability (Ramky Enviro)
- 6.4.20 Ragn-Sells
- 6.4.21 SUEZ
7 Market Opportunities & Future Outlook
- 7.1 White-space & unmet-need assessment

 建築與拆除廢棄物市場:全球市場預測(2026-2032 年)
 建築和拆除廢棄物管理市場規模、佔有率和成長分析:按材料、廢棄物分類、來源、服務和地區分類-2026-2033年產業預測
 建築和拆除廢棄物管理市場-全球產業規模、佔有率、趨勢、機會和預測:按材料、來源、服務、最終用戶、地區和競爭格局分類,2021-2031年
 建築和拆除廢棄物回收市場預測至2034年-按廢棄物類型、來源、服務類型、設備、應用、最終用戶和地區分類的全球分析
 亞太地區建築和拆除廢棄物管理:市場佔有率分析、行業趨勢和統計數據以及成長預測(2026-2031 年)歐洲建築和拆除廢棄物管理:市場佔有率分析、行業趨勢和統計數據以及成長預測(2026-2031 年)
 建築和拆除廢棄物管理市場報告:按行業、服務、廢棄物類型和地區分類(2026-2034 年)
 2026年全球建築與廢棄物廢棄物管理市場報告
 建築與拆除廢棄物管理市場規模、佔有率、成長及全球產業分析:依類型、應用和地區劃分的洞察與預測(2026-2034年)按材料類型、原料來源、加工技術、應用、最終用戶和通路骨材回收市場-2026-2032年全球預測