

 |
市場調查報告書
商品編碼
2066663
亞太地區EVA黏合劑:市佔率分析、產業趨勢與統計及成長預測(2026-2031年)Asia-Pacific EVA Adhesives - Market Share Analysis, Industry Trends & Statistics, Growth Forecasts (2026 - 2031) |
||||||
※ 本網頁內容可能與最新版本有所差異。詳細情況請與我們聯繫。
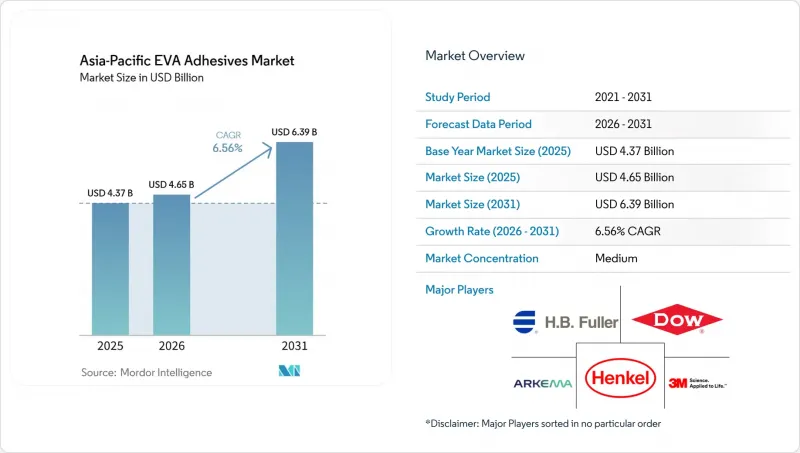
根據 Mordor Intelligence 預測,亞太地區 eVA黏合劑市場規模預計在 2025 年達到 43.7 億美元,2026 年擴大到 46.5 億美元,到 2031 年達到 63.9 億美元。
預計這將使 2026 年至 2031 年的年複合成長率(CAGR)達到 6.56%。
本報告按技術(熱熔膠、溶劑型膠、水性膠)、終端用戶產業(航太、汽車、建築、鞋類和皮革等終端用戶產業)以及地區(澳洲、中國、印度、印尼、日本、馬來西亞、新加坡、韓國、泰國及其他亞太地區)進行細分。市場預測以美元計價。
亞太地區EVA黏合劑市場趨勢及洞察。
電子商務的快速發展正在推動對熱熔包裝黏合劑。
跨境履約中心越來越多採用EVA熱熔膠系統。這些系統無需乾燥工序,可將生產線停機時間減少30-40%。這一趨勢正在推動亞太地區EVA黏合劑市場的成長。在中國,由於GB 9685-2016標準和日本食品衛生法對食品接觸過程中的遷移量有限制,低氣味等級產品的需求不斷成長。漢高於2025年開設了“上海靈感中心”,投資額達6000萬歐元。該中心可在短短48小時內完成客製化熱熔膠原型製作,幫助品牌商加快認證流程。隨著最低工資的提高,自動化使得每條包裝線可減少2-3名工人。儘管這些進步值得關注,但它們背後卻存在著中國消費成長放緩的因素。
鞋類產業的自動化正在推動低溫EVA材料的應用。
2024年,愛卡工業與OEM廠商合作,研發出一種開放時間僅需15-20秒的熱熔膠配方,在亞太地區實現了747.4億日圓的熱熔膠銷售額。廣東和同奈兩省的自動化鞋廠採用活化溫度為90-110度C的EVA材料,在維持每小時1200雙鞋生產速度的同時,最大限度地減少了熱損傷。此外,EVA材料透過季度VAM契約,有效緩衝了天然橡膠價格的波動。雖然這項優勢主要體現在越南和印尼,但如果全球鞋類採購因關稅而發生變化,其有效性可能會降低。
VAM原物料價格波動劇烈
在日本,醋酸乙烯單體(VAM)現貨價格已從2025年第一季的每噸816美元飆升至第四季的每噸943美元。此次價格上漲將使加工商的息稅折舊攤提前利潤(EBITDA)承受高達5%的壓力。無法進行避險的中小型企業面臨著30至60天的價格反映延遲,這危及了它們的貿易關係。同時,富樂集團(HB Fuller)的「量子飛躍計畫」(Project Quantum Leap)旨在集中採購VAM,從而確保價格固定,並爭取每年節省1.5億美元的成本。因此,垂直整合的跨國公司與一般買家之間的差距正在擴大,整個產業正朝著更快的重組方向發展。
細分市場分析
到了2025年,黏合劑在亞太地區的EVA黏合劑市場佔據64.28%的主導地位。然而,水性膠合劑的市佔率正以7.56%的強勁複合年成長率成長。隨著加工商遵守VOC排放上限規定,亞太地區的EVA黏合劑市場預計將持續成長。水性膠合劑具有保險成本更低、操作人員培訓更便捷等優勢,但其在低溫運輸中面臨的挑戰,例如凍融循環等,阻礙了其應用。以漢高新加坡電子黏合劑技術中心為例,該中心正逐步停止溶劑型產品的研發。
水性系統的發展與工作環境和合規性趨勢密切相關。採用水性系統,工廠可以避免使用防爆線路,進而顯著降低資本支出。儘管水性產品的乾燥週期較長,但南浦公司目前已發現其銷售額的60%以上來自水性產品,顯示其利潤率具有提升潛力。然而,在快速成長的電子商務領域,黏合劑仍然佔據主導地位,預計資本支出的轉變將是一個漸進的過程。
其他好處:
- Excel格式的市場預測(ME)表
- 3個月的分析師支持
目錄
第1章:引言
- 研究假設和市場定義
- 調查範圍
第2章:調查方法
第3章執行摘要
第4章 市場狀況
- 市場概覽
- 終端用戶趨勢
- 市場促進因素
- 電子商務的快速發展正在推動對熱熔包裝材料的需求。
- 製鞋業的自動化正在推動低溫EVA材料的應用。
- 亞太地區醫療保健產業向醫用EVA薄膜的過渡
- 中國和印度的太陽能電池封裝材料產能提高。
- 東南亞生物基EVA生產擴張(媒體通報不足)
- 市場限制因素
- VAM原物料價格波動劇烈
- 對溶劑型塗料實施嚴格的VOC(揮發性有機化合物)法規
- 與聚烯壓敏黏著劑的競爭
- 價值鏈分析
- 監理情勢
- 澳洲
- 中國
- 印度
- 印尼
- 日本
- 馬來西亞
- 新加坡
- 韓國
- 泰國
- 技術展望
- 波特五力模型
第5章 市場規模與成長預測
- 透過技術
- 熱熔膠
- 溶劑型
- 水系
- 按最終用戶行業分類
- 航太
- 車
- 建築/施工
- 鞋類和皮革
- 衛生保健
- 包裝
- 木工和細木工
- 其他終端用戶產業
- 國家
- 澳洲
- 中國
- 印度
- 印尼
- 日本
- 馬來西亞
- 新加坡
- 韓國
- 泰國
- 其他亞太國家
第6章 競爭情勢
- 市場集中度
- 策略趨勢
- 市佔率和排名分析
- 公司簡介
- 3M Company
- Aica Kogyo Co., Ltd.
- Arkema
- Avery Dennison Corp.
- Celanese Corporation
- CEMEDINE Co., Ltd.
- Dow
- ExxonMobil Chemical
- HB Fuller Company
- Henkel AG & Co. KGaA
- Jowat SE
- NANPAO Resins Chemical Group
- OKONG Corp.
- Paramelt BV
- Pidilite Industries Ltd.
- Selic Corp PCL
- Sika AG
- Tex Year Industries Inc.
- Toyo Polymer Co., Ltd.
- Wacker Chemie AG
第7章 市場機會與未來展望
According to Mordor Intelligence, the asia-Pacific eVA-based adhesives market, valued at USD 4.37 billion in 2025, is projected to grow to USD 4.65 billion in 2026 and reach USD 6.39 billion by 2031, marking a CAGR of 6.56% from 2026 to 2031.
This report is Segmented by Technology (Hot-Melt, Solvent-Borne, Water-Borne), End-User Industry (Aerospace, Automotive, Building and Construction, Footwear and Leather, Other End-User Industries), and Geography (Australia, China, India, Indonesia, Japan, Malaysia, Singapore, South Korea, Thailand, Rest of Asia-Pacific). Market Forecasts are Provided in Terms of Value (USD).
Asia-Pacific EVA Adhesives Market Trends and Insights
E-Commerce Boom Driving Hot-Melt Packaging Demand
Cross-border fulfillment centers are increasingly adopting EVA hot-melt systems. These systems eliminate drying steps and reduce line downtime by 30-40%. This trend bolsters the EVA-based adhesives market in the Asia-Pacific region. In China, food-contact migration limits, as per GB 9685-2016, and Japan's Food Sanitation Law, are driving up demand for low-odor grades. Henkel inaugurated its EUR 60 million Shanghai Inspiration Center in 2025. The center can prototype custom hot-melts in just 48 hours, enabling brand owners to expedite their qualification cycles. With rising minimum wages, automation has led to a reduction of two to three operators per packaging line. While these advancements are notable, they come against the backdrop of slowing consumption in China.
Footwear Automation Spurring Low-Temperature EVA Uptake
In 2024, Aica Kogyo, after collaborating with OEMs to develop 15-20 second open-time formulations, achieved hot-melt sales of JPY 74.74 billion in the Asia-Pacific region. Automated shoe plants in Guangdong and Dong Nai, utilizing EVA grades with activation points between 90-110 °C, have successfully minimized heat damage while maintaining a throughput of 1,200 pairs per hour. Additionally, EVA provides a buffer against price fluctuations in natural rubber, thanks to quarterly VAM contracts. While this advantage is primarily seen in Vietnam and Indonesia, it stands to diminish if global footwear sourcing undergoes tariff-induced shifts.
Volatile VAM Feedstock Prices
In Japan, the spot price of Vinyl Acetate Monomer (VAM) jumped from USD 816/ton in Q1 2025 to USD 943/ton by Q4. This price surge has squeezed converters' EBITDA by as much as 5%. Smaller players, unable to hedge, face 30-60 day pricing lags, jeopardizing their relationships. Meanwhile, H.B. Fuller's "Project Quantum Leap" aims to centralize VAM procurement, allowing the company to secure fixed-price collars and target annual savings of USD 150 million. As a result, the divide between integrated multinationals and merchant buyers is widening, pushing the industry towards faster consolidation.
Other drivers and restraints analyzed in the detailed report include:
- Shift to Medical-Grade EVA Films in APAC Healthcare
- Solar PV Encapsulation Capacity Additions in China and India
- Tight VOC Limits on Solvent-Borne Lines
For complete list of drivers and restraints, kindly check the Table Of Contents.
Segment Analysis
In 2025, hot-melt adhesives held a dominant 64.28% share of the Asia-Pacific EVA-based adhesives market. However, water-borne grades are on the rise, boasting a robust CAGR of 7.56%. As converters adapt to meet VOC caps, the Asia-Pacific EVA-based adhesives market is set for growth. While water-borne systems offer benefits like reduced insurance premiums and easier operator training, challenges such as freeze-thaw issues hinder their adoption in cold chains. Highlighting a strategic shift, Henkel's Singapore Electronic Adhesives Technical Centre is moving away from solvent-borne R&D.
Water-borne systems' growth is closely tied to labor and compliance trends. By opting for water-borne systems, facilities sidestep the need for explosion-proof wiring, resulting in significant capital savings. NANPAO has demonstrated the potential for margin enhancement, with over 60% of its revenue mix now water-based, despite the longer drying cycles. Nevertheless, the ultra-fast e-commerce sector continues to lean towards hot-melt adhesives, suggesting a gradual shift in capital investment.
List of Companies Covered in this Report:
- 3M Company
- Aica Kogyo Co., Ltd.
- Arkema
- Avery Dennison Corp.
- Celanese Corporation
- CEMEDINE Co., Ltd.
- Dow
- ExxonMobil Chemical
- H.B. Fuller Company
- Henkel AG & Co. KGaA
- Jowat SE
- NANPAO Resins Chemical Group
- OKONG Corp.
- Paramelt B.V.
- Pidilite Industries Ltd.
- Selic Corp PCL
- Sika AG
- Tex Year Industries Inc.
- Toyo Polymer Co., Ltd.
- Wacker Chemie AG
Additional Benefits:
- The market estimate (ME) sheet in Excel format
- 3 months of analyst support
TABLE OF CONTENTS
1 Introduction
- 1.1 Study Assumptions and Market Definition
- 1.2 Scope of the Study
2 Research Methodology
3 Executive Summary
4 Market Landscape
- 4.1 Market Overview
- 4.2 End-User Trends
- 4.3 Market Drivers
- 4.3.1 E-commerce boom driving hot-melt packaging demand
- 4.3.2 Footwear automation spurring low-temperature EVA uptake
- 4.3.3 Shift to medical-grade EVA films in APAC healthcare
- 4.3.4 Solar PV encapsulation capacity additions in China and India
- 4.3.5 Bio-based EVA scale-up in Southeast Asia (under-reported)
- 4.4 Market Restraints
- 4.4.1 Volatile VAM feedstock prices
- 4.4.2 Tight VOC limits on solvent-borne lines
- 4.4.3 Competition from polyolefin pressure-sensitives
- 4.5 Value Chain Analysis
- 4.6 Regulatory Landscape
- 4.6.1 Australia
- 4.6.2 China
- 4.6.3 India
- 4.6.4 Indonesia
- 4.6.5 Japan
- 4.6.6 Malaysia
- 4.6.7 Singapore
- 4.6.8 South Korea
- 4.6.9 Thailand
- 4.7 Technological Outlook
- 4.8 Porter's Five Forces
- 4.8.1 Threat of New Entrants
- 4.8.2 Bargaining Power of Suppliers
- 4.8.3 Bargaining Power of Buyers
- 4.8.4 Threat of Substitutes
- 4.8.5 Competitive Rivalry
5 Market Size and Growth Forecasts (Value and Volume)
- 5.1 By Technology
- 5.1.1 Hot-Melt
- 5.1.2 Solvent-Borne
- 5.1.3 Water-Borne
- 5.2 By End-user Industry
- 5.2.1 Aerospace
- 5.2.2 Automotive
- 5.2.3 Building and Construction
- 5.2.4 Footwear and Leather
- 5.2.5 Healthcare
- 5.2.6 Packaging
- 5.2.7 Woodworking and Joinery
- 5.2.8 Other End-user Industries
- 5.3 By Country
- 5.3.1 Australia
- 5.3.2 China
- 5.3.3 India
- 5.3.4 Indonesia
- 5.3.5 Japan
- 5.3.6 Malaysia
- 5.3.7 Singapore
- 5.3.8 South Korea
- 5.3.9 Thailand
- 5.3.10 Rest of Asia-Pacific
6 Competitive Landscape
- 6.1 Market Concentration
- 6.2 Strategic Moves
- 6.3 Market Share (%)/Ranking Analysis
- 6.4 Company Profiles (includes Global level Overview, Market level overview, Core Segments, Financials as available, Strategic Information, Products and Services, and Recent Developments)
- 6.4.1 3M Company
- 6.4.2 Aica Kogyo Co., Ltd.
- 6.4.3 Arkema
- 6.4.4 Avery Dennison Corp.
- 6.4.5 Celanese Corporation
- 6.4.6 CEMEDINE Co., Ltd.
- 6.4.7 Dow
- 6.4.8 ExxonMobil Chemical
- 6.4.9 H.B. Fuller Company
- 6.4.10 Henkel AG & Co. KGaA
- 6.4.11 Jowat SE
- 6.4.12 NANPAO Resins Chemical Group
- 6.4.13 OKONG Corp.
- 6.4.14 Paramelt B.V.
- 6.4.15 Pidilite Industries Ltd.
- 6.4.16 Selic Corp PCL
- 6.4.17 Sika AG
- 6.4.18 Tex Year Industries Inc.
- 6.4.19 Toyo Polymer Co., Ltd.
- 6.4.20 Wacker Chemie AG
7 Market Opportunities and Future Outlook
- 7.1 White-Space and Unmet-Need Assessment
- 7.2 Key Strategic Questions for Adhesive and Sealant CEOs
 眼科黏合劑市場規模、佔有率和成長分析:按產品類型、應用、適應症、最終用戶和地區分類-2026-2033年產業預測
 2026-2030年全球黏合劑市場
 丙烯酸樹脂黏合劑市場-全球產業規模、佔有率、趨勢、機會、預測:按應用、分銷方式、地區和競爭格局分類,2021-2031年智慧黏合劑市場-全球產業規模、佔有率、趨勢、機會、預測:按技術、應用、地區和競爭格局分類,2021-2031年
 織物黏合劑:市場佔有率分析、行業趨勢和統計數據、成長預測(2026-2031)
 電子產業PUR黏合劑市場規模、佔有率和成長分析:按功能/類型、應用、終端用戶產業、包裝、分銷管道和地區分類-2026-2033年產業預測
 北美基材黏合劑市場規模、佔有率和趨勢分析報告:按樹脂類型、技術、應用、國家和細分市場預測(2026-2033 年)
 全球冷封黏合劑市場:依應用、類型、材料相容性及地區分類-市場規模、產業趨勢、機會分析及2026-2035年預測
 電子黏合劑市場:按材料、產品類型、應用和地區分類
 2026年全球磁磚黏合劑市場報告