

 |
市場調查報告書
商品編碼
2066394
中國電力產業:市場佔有率分析、產業趨勢與統計及成長預測(2026-2031年)China Power - Market Share Analysis, Industry Trends & Statistics, Growth Forecasts (2026 - 2031) |
||||||
※ 本網頁內容可能與最新版本有所差異。詳細情況請與我們聯繫。
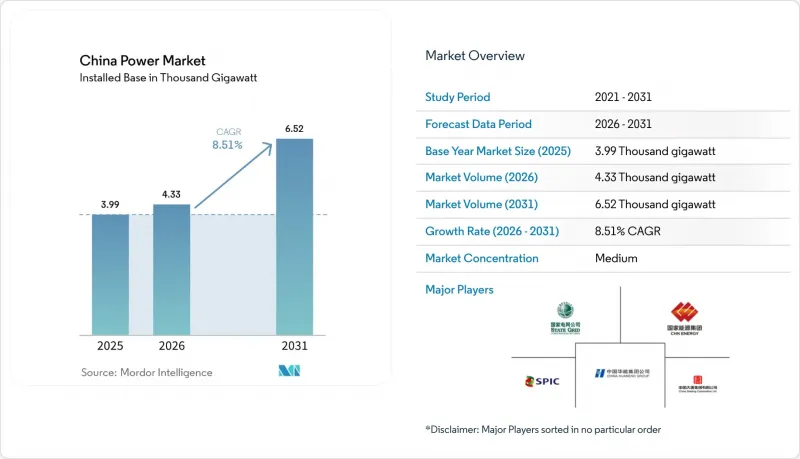
根據 Mordor Intelligence 預測,中國電力市場規模將從 2025 年的 3990 吉瓦成長到 2026 年的 4330 吉瓦,到 2031 年將達到 6520 吉瓦,2026 年至 2031 年的複合年成長率為 8.51%。
本報告按能源類型(火力發電、核能、可再生能源)和終端用戶(公共產業、商業/工業、住宅)進行細分。市場規模和預測以裝置容量(吉瓦)為單位。
中國電力市場趨勢與洞察
在市電平價,太陽能發電競標正在改變市場格局。
隨著強制性競標制度於2025年取代上網電價補貼(FIT)制度,開發商被迫完全基於經濟效益來定價,同時保留區域競標機制的柔軟性。這項政策的推出正值太陽能板供應過剩之際,將競爭力較弱的企業排除在市場之外,並加速了產業結構調整。同時,現貨價格波動風險促使人們更加關注將太陽能發電與儲能設備結合的項目,以分散利潤風險,中國的電力市場也朝著更活躍的市場交易模式轉變。
低水準可再生能源組合標準確保清潔能源義務得到徹底履行。
在快速成長的綠色環保證書市場(預計2024年交易量將成長327%)的推動下,強制性配額制度將省級能源強度目標與可再生能源採購掛鉤。資源豐富的西部省份正透過向高需求沿海地區出售證書,將剩餘電力貨幣化,從而促進區域間電力流動和分散式太陽能發電的普及。
擱淺資產風險對依賴煤炭的地區構成挑戰。
燃煤電廠的提前退役和運作時間的減少威脅著依賴煤炭的國有發電企業和地方經濟的財務健康。隨著貸款機構在貸款條款中反映出較低的碳價格和運轉率,財務審查也日益嚴格。為確保冬季供暖供應穩定,協調燃煤發電廠的退役計畫與替代能源的引入計畫仍然至關重要。
細分市場分析
到2025年,可再生能源發電裝置容量將佔總發電量的53.78%,隨著新增裝置容量以12.12%的年複合成長率成長,預計到2031年,其在中國電力市場的佔有率將超過65.7%。光是2024年,太陽能發電裝置容量就新增了300吉瓦,達到842吉瓦。在成本績效方面,N型拓普康(TOPCon)組件優於PERC型組件。江蘇、廣東和福建三省的離岸風力發電已達45吉瓦,其中18兆瓦級風力發電機的利用率超過55%,使平準化發電成本降至每千瓦時0.30元。由於水力發電裝置容量已接近420吉瓦的生態學極限,抽水蓄能電站的擴張(目標是到2030年達到100吉瓦)成為成長的主要動力。由於原料和位置條件的限制,生質能、地熱能和潮汐能發電的總合裝置容量仍低於 50 吉瓦。
火力發電佔中國電力市場佔有率的39.5%,但由於煤炭運轉率高,目前仍佔全國電力供應的60%。天然氣發電裝置容量目前總計130吉瓦,並以每年5.84%的速度成長以滿足高峰需求,儘管液化天然氣價格已超過每百萬英國熱單位(mmBtu)12美元。預計到2024年,核能發電將達到57吉瓦,目前有24座核子反應爐在建,另有11座新近獲批,中國預計在2035年實現150吉瓦的裝機容量目標,並實現超過90%的裝機容量利用率。燃油和柴油發電目前仍僅限於獨立電網和備用電源。
其他好處:
- Excel格式的市場預測(ME)表
- 3個月的分析師支持
目錄
第1章:引言
- 研究假設和市場定義
- 調查範圍
第2章:調查方法
第3章執行摘要
第4章 市場狀況
- 市場概覽
- 市場促進因素
- 加速太陽能發電競標以實現市電平價(中國當地)
- 遵守州可再生能源組合配額(RPS)
- 根據「2060年碳中和藍圖」重組發電結構
- 交通運輸電氣化和製程熱導致的負荷增加
- 透過現貨市場和容量付費試點計畫提高投資報酬率
- 利用綠色債券進行低成本企劃案融資
- 市場限制因素
- 燃煤發電廠退役相關的擱淺資產風險
- 偏遠地區可再生能源產量削減
- 大規模水力發電和風力發電中的土地利用和生態學限制
- 限制零售價格上限,以減少成本轉嫁。
- 供應鏈分析
- 監理情勢
- 技術展望
- 波特五力模型
- PESTLE分析
第5章 市場規模與成長預測
- 透過電源
- 火力發電(煤炭、天然氣、石油和天然氣、柴油)
- 核能
- 可再生能源(太陽能、風能、水能、地熱能、生質能/廢棄物、潮汐能)
- 最終用戶
- 公用事業
- 商業和工業用途
- 住宅
- 按輸配電類型和電壓等級分類(僅進行定性分析)
- 高壓輸電(230千伏特或以上)
- 半輸電線路(69-161千伏)
- 中壓配電(13.2–34.5 kV)
- 低壓配電(1千伏特或以下)
第6章 競爭情勢
- 市場集中度
- 策略趨勢(併購、聯盟、購電協議)
- 市場佔有率分析(主要公司的市場排名和佔有率)
- 公司簡介
- State Grid Corporation of China
- China Huaneng Group Co. Ltd.
- China Energy Investment Corp(CHN Energy)
- China Huadian Corporation Ltd.
- China Datang Corporation Ltd.
- State Power Investment Corp(SPIC)
- China Three Gorges Corporation
- China General Nuclear Power Group
- China Southern Power Grid Company
- Shanghai Electric Group Co Ltd
- Xinjiang Goldwind Science & Technology Co Ltd
- Longi Green Energy Technology Co Ltd
- JinkoSolar Holding Co Ltd
- MingYang Smart Energy Group Ltd
- TBEA Co Ltd
- Pinggao Group Co Ltd
- Suntech Power Co Ltd
- Envision Energy Ltd
- China Yangtze Power Co Ltd
- China National Electric Engineering Co Ltd
- Sinovel Wind Group Co Ltd
- Datang International Power Generation Co Ltd
第7章 市場機會與未來展望
According to Mordor Intelligence, the china power market size is expected to grow from 3.99 Thousand gigawatt in 2025 to 4.33 Thousand gigawatt in 2026 and is forecast to reach 6.52 Thousand gigawatt by 2031 at 8.51% CAGR over 2026-2031.
This report is Segmented by Power Source (Thermal, Nuclear, and Renewables) and End-User (Utilities, Commercial and Industrial, and Residential). The Market Sizes and Forecasts are Provided in Terms of Installed Capacity (GW).
China Power Market Trends and Insights
Accelerated Grid-Parity Solar Auctions Drive Market Transformation
Mandatory competitive bidding from 2025 replaces feed-in tariffs, compelling developers to price entirely on economics while retaining regional flexibility in auction design. The policy arrives amid manufacturing overcapacity in panels, nudging weaker firms out and encouraging consolidation. Simultaneously, spot-price exposure drives interest in storage-coupled projects that flatten revenue risk, positioning the Chinese power market for deeper merchant activity.
Provincial Renewable Portfolio Standards Enforce Clean-Energy Mandates
Mandatory quotas backed by a fast-growing green-certificate market, 327% trading-volume growth in 2024, tie provincial energy-intensity goals to renewable procurement. Resource-rich western provinces monetize excess generation by selling certificates to demand-heavy coastal hubs, stimulating cross-regional flows and distributed solar uptake.
Stranded-Asset Risks Challenge Coal-Dependent Regions
Accelerated retirement and reduced dispatch hours threaten balance-sheet health for state generators and local economies reliant on coal. Financial scrutiny is rising as lenders factor carbon prices and lower capacity factors into credit terms. Coordinating exit schedules with replacement resources remains critical for winter-heating reliability.
Other drivers and restraints analyzed in the detailed report include:
- Carbon-Neutral Roadmap Accelerates Coal-Plant Retirement Schedules
- Industrial Electrification Expands Beyond Traditional Applications
- Renewable Energy Curtailment Constrains Western Development
For complete list of drivers and restraints, kindly check the Table Of Contents.
Segment Analysis
Renewables held 53.78% of the capacity in 2025, and their share of the China power market size is on track to exceed 65.7% by 2031 as additions compound at a 12.12% CAGR. Solar capacity alone climbed to 842 GW in 2024, following another 300 GW surge, with N-type TOPCon modules outpacing PERC variants in cost-performance metrics. Offshore wind in Jiangsu, Guangdong, and Fujian now hosts 45 GW; 18 MW machines deliver capacity factors above 55%, trimming levelized costs to CNY 0.30 per kWh. Hydro sits near its ecological ceiling of 420 GW, so incremental pumped-storage is the primary growth vector, targeting 100 GW by 2030. Biomass, geothermal, and tidal remain below 50 GW combined due to feedstock and site limits.
Thermal capacity accounts for 39.5% of China's power market share, yet coal still supplies 60% of the country's generation, given higher utilization rates. Natural-gas units now total 130 GW, expanding at a rate of 5.84% annually to meet peaking demand, despite LNG prices exceeding USD 12 per million British thermal units (mmBtu). Nuclear, at 57 GW in 2024, benefits from 24 reactors under construction and 11 new approvals, driving a path toward 150 GW by 2035 with a capacity factor of over 90%. Oil and diesel remain marginal, restricted to islanded grids and backup roles.
List of Companies Covered in this Report:
- State Grid Corporation of China
- China Huaneng Group Co. Ltd.
- China Energy Investment Corp (CHN Energy)
- China Huadian Corporation Ltd.
- China Datang Corporation Ltd.
- State Power Investment Corp (SPIC)
- China Three Gorges Corporation
- China General Nuclear Power Group
- China Southern Power Grid Company
- Shanghai Electric Group Co Ltd
- Xinjiang Goldwind Science & Technology Co Ltd
- Longi Green Energy Technology Co Ltd
- JinkoSolar Holding Co Ltd
- MingYang Smart Energy Group Ltd
- TBEA Co Ltd
- Pinggao Group Co Ltd
- Suntech Power Co Ltd
- Envision Energy Ltd
- China Yangtze Power Co Ltd
- China National Electric Engineering Co Ltd
- Sinovel Wind Group Co Ltd
- Datang International Power Generation Co Ltd
Additional Benefits:
- The market estimate (ME) sheet in Excel format
- 3 months of analyst support
TABLE OF CONTENTS
1 Introduction
- 1.1 Study Assumptions & Market Definition
- 1.2 Scope of the Study
2 Research Methodology
3 Executive Summary
4 Market Landscape
- 4.1 Market Overview
- 4.2 Market Drivers
- 4.2.1 Accelerated Grid-Parity Solar Auctions (China Mainland)
- 4.2.2 Provincial Renewable Portfolio Quota (RPS) Compliance
- 4.2.3 Carbon-Neutral 2060 Roadmap Reshaping Capacity Mix
- 4.2.4 Electrification of Transport & Process Heat Boosting Load
- 4.2.5 Spot Market & Capacity-Payment Pilots Improving ROI
- 4.2.6 Green-Bond-Fuelled Low-Cost Project Finance
- 4.3 Market Restraints
- 4.3.1 Stranded-Asset Risk from Coal Retirements
- 4.3.2 Renewables Curtailment in Remote Provinces
- 4.3.3 Land-Use & Ecological Caps on Mega Hydro/Wind
- 4.3.4 Retail-Tariff Ceilings Limiting Cost Pass-Through
- 4.4 Supply-Chain Analysis
- 4.5 Regulatory Landscape
- 4.6 Technological Outlook
- 4.7 Porter's Five Forces
- 4.7.1 Threat of New Entrants
- 4.7.2 Threat of Substitutes
- 4.7.3 Bargaining Power of Buyers
- 4.7.4 Bargaining Power of Suppliers
- 4.7.5 Competitive Rivalry
- 4.8 PESTLE Analysis
5 Market Size & Growth Forecasts
- 5.1 By Power Source
- 5.1.1 Thermal (Coal, Natural Gas, Oil and Diesel)
- 5.1.2 Nuclear
- 5.1.3 Renewables (Solar, Wind, Hydro, Geothermal, Biomass & Waste, Tidal)
- 5.2 By End User
- 5.2.1 Utilities
- 5.2.2 Commercial and Industrial
- 5.2.3 Residential
- 5.3 By T&D Voltage Level (Qualitative Analysis only)
- 5.3.1 High-Voltage Transmission (Above 230 kV)
- 5.3.2 Sub-Transmission (69 to 161 kV)
- 5.3.3 Medium-Voltage Distribution (13.2 to 34.5 kV)
- 5.3.4 Low-Voltage Distribution (Up to 1 kV)
6 Competitive Landscape
- 6.1 Market Concentration
- 6.2 Strategic Moves (M&A, Partnerships, PPAs)
- 6.3 Market Share Analysis (Market Rank/Share for key companies)
- 6.4 Company Profiles (includes Global level Overview, Market level overview, Core Segments, Financials as available, Strategic Information, Products & Services, and Recent Developments)
- 6.4.1 State Grid Corporation of China
- 6.4.2 China Huaneng Group Co. Ltd.
- 6.4.3 China Energy Investment Corp (CHN Energy)
- 6.4.4 China Huadian Corporation Ltd.
- 6.4.5 China Datang Corporation Ltd.
- 6.4.6 State Power Investment Corp (SPIC)
- 6.4.7 China Three Gorges Corporation
- 6.4.8 China General Nuclear Power Group
- 6.4.9 China Southern Power Grid Company
- 6.4.10 Shanghai Electric Group Co Ltd
- 6.4.11 Xinjiang Goldwind Science & Technology Co Ltd
- 6.4.12 Longi Green Energy Technology Co Ltd
- 6.4.13 JinkoSolar Holding Co Ltd
- 6.4.14 MingYang Smart Energy Group Ltd
- 6.4.15 TBEA Co Ltd
- 6.4.16 Pinggao Group Co Ltd
- 6.4.17 Suntech Power Co Ltd
- 6.4.18 Envision Energy Ltd
- 6.4.19 China Yangtze Power Co Ltd
- 6.4.20 China National Electric Engineering Co Ltd
- 6.4.21 Sinovel Wind Group Co Ltd
- 6.4.22 Datang International Power Generation Co Ltd
7 Market Opportunities & Future Outlook
- 7.1 White-Space & Unmet-Need Assessment
 電力零售市場-全球產業規模、佔有率、趨勢、機會和預測:按市場結構、客戶類型、服務類型、支付方式、地區和競爭格局分類,2021-2031年
 美國電力市場:市場佔有率分析、產業趨勢與統計、成長預測(2026-2031年)
 再生能源線路市場預測至2034年-能源來源、輸電網類型、最終用戶和地區分類的全球分析
 2026-2030年全球電力交易市場
 2026年人工智慧(AI)資料中心熱能儲存全球市場報告2026年全球太陽能人工智慧市場報告2026年全球可再生能源購電合約市場報告
 人工智慧在能源與電力市場的應用:策略性洞察與預測(2026-2031)
 可調可再生能源市場規模、佔有率和趨勢分析報告:按技術、最終用途、地區和細分市場分類,預測至2026-2033年西班牙電力:市場佔有率分析、行業趨勢和統計數據、成長預測(2026-2031 年)