


 |
市場調查報告書
商品編碼
2061529
美國電力市場:市場佔有率分析、產業趨勢與統計、成長預測(2026-2031年)United States Power - Market Share Analysis, Industry Trends & Statistics, Growth Forecasts (2026 - 2031) |
||||||
※ 本網頁內容可能與最新版本有所差異。詳細情況請與我們聯繫。
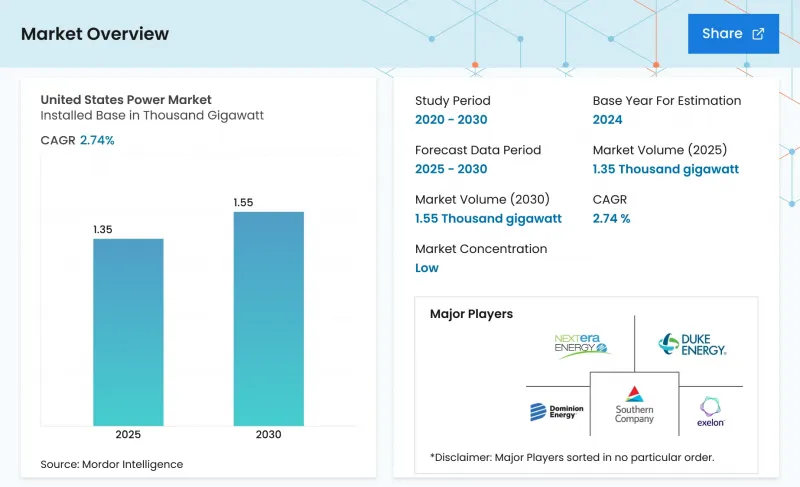
根據 Mordor Intelligence 預測,美國電力市場規模(按裝置容量計算)預計將從 2025 年的 1350 吉瓦擴大到 2026 年的 1390 吉瓦,然後從 2026 年到 2031 年以 2.73% 的複合年成長率成長,達到 2031 年吉瓦。
本報告按能源類型(火力發電、核能、可再生能源)和終端用戶(公共產業、商業/工業、住宅)進行細分。市場規模和預測均以總裝置容量(GW)為基礎。
美國電力市場趨勢與洞察
透過IRA擴大可再生能源
除了根據《工業改革法案》(IRA)將生產和投資稅額扣抵稅額扣抵10年外,20個百分點的國內採購獎勵也顯著地將資金轉向了風能和太陽能發電工程。到2030年,已宣布的可再生能源總裝置容量已達550吉瓦,是IRA實施前預測值的兩倍多。由於投資者尋求投資回報的確定性,已簽訂的購電協議涵蓋了2024年宣布的項目中的80%以上。美國組件製造商First Solar正在將其位於俄亥俄州的產能擴大到2026年達到每年14吉瓦,以確保穩定的供應。然而,預計從2029年到2030年逐步減少稅額扣抵將壓縮建設工期並增加設備成本。
燃煤發電廠的關閉將造成電力供應缺口。
計劃於2030年前退役的約20吉瓦燃煤發電裝置容量集中在PJM、MISO和SPP三個電網區域。由於容量競標價格屢創新高,電力公司更傾向於採用太陽能、風能和四小時電池儲能的組合方案,而不是新建燃氣渦輪機電廠。光是杜克能源公司就計劃在2024年投入4億美元用於環境維修,以維持邊際燃煤機組的運作,直到其他能源併網。平均長達五年的併網等待名單加劇了這一缺口,迫使電網營運商啟動緊急需量反應計畫。這些發展趨勢在增加電力可靠性風險的同時,也為獨立發電企業(商業發電企業)拓展了商機。
太陽能或變壓器供電瓶頸
高壓變壓器的前置作業時間已從疫情前的12個月延長至2024年的30個月,導致併網和網路升級延誤。國內年產能約200台,僅能滿足當前需求的一半。 ABB和日立能源已宣布擴建其美國工廠,但預計要到2027年才能全面投入生產。根據《201條款》對太陽能產品徵收的關稅以及對強迫勞動產品的進口禁令,已使合規組件的價格上漲高達20%,對開發商的利潤造成壓力。電力公司目前正簽訂包含價格調整條款的多年期供電契約,將通膨風險轉嫁給客戶。
細分市場分析
2024年,可再生能源裝置容量佔比達到42.4%,年複合成長率達7.8%,穩定削弱了火力發電在美國電力市場的主導地位。 2024年,新增公用事業規模太陽能發電裝置容量達32吉瓦,連續第三年超過所有其他技術。同時,800兆瓦的Vineyard Wind 1計畫標誌著商業離岸風力發電正式進入市場。 2024年,燃煤發電廠退役導致裝置容量減少8吉瓦,平均容量係數降至40%以下,對彈性燃氣發電資產進行輸出調整的依賴性增強。核能發電裝置容量維持穩定在95吉瓦左右,計畫於2028年運作的835兆瓦三哩島核能發電廠將是首例已退役核子反應爐運作案例,凸顯了核能在確保零碳能源供應方面的重要作用。像 Farvo 的 400MW「紅色項目」這樣的新興地熱項目表明,投資者對具有可調容量的可再生能源越來越感興趣。
投資動能正推動符合《通膨控制法案》(IRA)明確激勵政策的技術發展。在美國電力市場,儲能太陽能發電和風能發電正逐漸成為石化燃料發電廠退役後的預設替代方案。然而,開發商面臨併網延遲、變壓器短缺以及電價波動加劇價格波動等挑戰。隨著甲烷排放收費政策的實施,天然氣聯合循環發電廠的建設正在放緩,但現有燃氣發電廠仍能從晚間用電尖峰時段的電力短缺中獲利。小型模組化反應器於2024年獲得美國核能管理委員會的設計批准,但預計商業營運要到2030年或更晚才能實現。生質能和潮汐能仍然是小眾市場,因為遵守環境法規的成本超過了其利潤。
其他好處:
- Excel格式的市場預測(ME)表
- 3個月的分析師支持
目錄
第1章:引言
- 研究假設和市場定義
- 調查範圍
第2章:調查方法
第3章執行摘要
第4章 市場狀況
- 市場概覽
- 市場促進因素
- 透過IRA擴大可再生能源
- 燃煤發電廠的關閉將導致供不應求。
- 電氣化所帶來的需求增加
- 為電網現代化和增強其韌性提供資金。
- 超大規模資料中心購電協議
- 綠色氫氣電解槽的需求
- 市場限制因素
- 太陽能發電和變壓器供應瓶頸
- 輸電線路選址及授權延誤
- 可再生能源佔比高的地區有減產風險。
- 極端天氣事件導致保險成本飆升
- 供應鏈分析
- 監理情勢
- 技術展望
- 波特五力模型
- PESTLE分析
第5章 市場規模與成長預測
- 透過動力來源
- 火力發電(煤炭、天然氣、石油和天然氣、柴油)
- 核能
- 可再生能源(太陽能、風能、水能、地熱能、生質能/廢棄物、潮汐能)
- 最終用戶
- 公用事業
- 商業和工業用途
- 住宅
- 按輸配電類型和電壓等級分類(僅進行定性分析)
- 高壓輸電(230千伏特或以上)
- 中壓輸電(69-161千伏特)
- 中壓配電(13.2–34.5 kV)
- 低壓配電(1千伏特或以下)
第6章 競爭情勢
- 市場集中度
- 策略趨勢(併購、聯盟、購電協議)
- 市場佔有率分析(主要公司的市場排名和佔有率)
- 公司簡介
- NextEra Energy Inc
- American Electric Power
- FirstEnergy Corp
- Constellation Energy
- Mitsubishi Power Americas
- Duke Energy Corp
- Berkshire Hathaway Energy
- Public Service Enterprise Group
- Pattern Energy Group
- Southern Company
- Vistra Corp
- AES Corporation
- Orsted A/S(US)
- ABB USA
- Exelon Corp
- Entergy Corp
- Eversource Energy
- General Electric Vernova
- Toshiba America Energy Systems
第7章 市場機會與未來展望
According to Mordor Intelligence, the united states power market size in terms of installed base is expected to grow from 1.35 Thousand gigawatt in 2025 to 1.39 Thousand gigawatt in 2026 and is forecast to reach 1.59 Thousand gigawatt by 2031 at 2.73% CAGR over 2026-2031.
This report is Segmented by Power Source (Thermal, Nuclear, and Renewables) and End-User (Utilities, Commercial and Industrial, and Residential). The Market Sizes and Forecasts are Provided in Terms of Installed Capacity (GW).
United States Power Market Trends and Insights
IRA-driven renewable build-out
The IRA's decade-long extension of production and investment tax credits, plus a 20-percentage-point domestic-content bonus, has shifted capital decisively toward wind and solar projects. Announcements totaling 550 GW of renewable capacity for delivery by 2030 already exceed pre-IRA forecasts twofold. Contracted offtake now covers more than 80% of projects announced in 2024 as financiers demand revenue certainty. U.S. module producer First Solar is expanding its Ohio manufacturing to 14 GW of annual output by 2026, ensuring a compliant supply. However, a looming 2029-2030 credit step-down is expected to compress construction schedules and bid up equipment costs.
Coal Retirements Create Capacity Gap
Roughly 20 GW of coal capacity scheduled to exit by 2030 is concentrated in PJM, MISO, and SPP. With capacity auctions clearing at record prices, utilities are pairing solar, wind, and 4-hour batteries rather than building new gas turbines. Duke Energy alone budgeted USD 400 million in 2024 for environmental retrofits to keep marginal coal units online until replacement resources interconnect. Interconnection backlogs averaging five years intensify the gap, forcing grid operators to activate emergency demand-response programs. These dynamics elevate both reliability risk and merchant-generator opportunity.
Solar or transformer supply bottlenecks
High-voltage transformer lead times lengthened to 30 months in 2024 versus 12 months pre-pandemic, delaying interconnections and network upgrades. Domestic production capacity of roughly 200 units annually meets only half of the current demand. ABB and Hitachi Energy announced U.S. factory expansions, but full output is unlikely before 2027. Section 201 solar tariffs and forced-labor import bans inflated compliant-module prices by up to 20%, compressing developer returns. Utilities now sign multi-year supply agreements with escalators, shifting inflation risk to customers.
Other drivers and restraints analyzed in the detailed report include:
- Electrification-led demand growth
- Grid Modernization & Resiliency Funding
- Transmission Siting & Permitting Delays
For complete list of drivers and restraints, kindly check the Table Of Contents.
Segment Analysis
Renewables captured 42.4% of installed capacity in 2024 and are advancing at a 7.8% CAGR, steadily eroding thermal's majority position in the United States power market. Utility-scale solar additions of 32 GW in 2024 outpaced every other technology for the third straight year, while the 800 MW Vineyard Wind 1 project heralded commercial offshore wind entry. Coal retirements removed 8 GW in 2024, pushing average fleet capacity factors below 40% and increasing reliance on flexible gas assets for ramping. Nuclear capacity remains steady near 95 GW; the planned 835 MW restart of Three Mile Island in 2028 marks the first reactor return from retirement and underscores nuclear's role in firm zero-carbon supply. Emerging geothermal projects such as Fervo's 400 MW Project Red illustrate growing investor appetite for dispatchable renewables.
Investment momentum favors technologies with clear IRA incentives, positioning solar-plus-storage and wind as the default replacements for retiring fossil units within the United States power market. Developers nonetheless face interconnection delays, transformer shortages, and tariff exposure that add price volatility. Natural-gas combined-cycle builds are slowing as potential methane fees loom, yet existing gas fleets continue to capture scarcity rents during evening peaks. Small modular reactors earned Nuclear Regulatory Commission design approval in 2024, but commercial operation remains a post-2030 prospect. Biomass and tidal remain niche as environmental compliance costs outweigh revenue streams.
List of Companies Covered in this Report:
- NextEra Energy Inc
- American Electric Power
- FirstEnergy Corp
- Constellation Energy
- Mitsubishi Power Americas
- Duke Energy Corp
- Berkshire Hathaway Energy
- Public Service Enterprise Group
- Pattern Energy Group
- Southern Company
- Vistra Corp
- AES Corporation
- Orsted A/S (US)
- ABB USA
- Exelon Corp
- Entergy Corp
- Eversource Energy
- General Electric Vernova
- Toshiba America Energy Systems
Additional Benefits:
- The market estimate (ME) sheet in Excel format
- 3 months of analyst support
TABLE OF CONTENTS
1 Introduction
- 1.1 Study Assumptions & Market Definition
- 1.2 Scope of the Study
2 Research Methodology
3 Executive Summary
4 Market Landscape
- 4.1 Market Overview
- 4.2 Market Drivers
- 4.2.1 IRA-driven renewable build-out
- 4.2.2 Coal retirements create capacity gap
- 4.2.3 Electrification-led demand growth
- 4.2.4 Grid modernization & resiliency funding
- 4.2.5 Hyperscale-data-center PPAs
- 4.2.6 Green-hydrogen electrolyzer demand
- 4.3 Market Restraints
- 4.3.1 Solar/transformer supply bottlenecks
- 4.3.2 Transmission siting & permitting delays
- 4.3.3 Curtailment risk in high-renewable zones
- 4.3.4 Extreme-weather insurance cost surge
- 4.4 Supply-Chain Analysis
- 4.5 Regulatory Landscape
- 4.6 Technological Outlook
- 4.7 Porter's Five Forces
- 4.7.1 Threat of New Entrants
- 4.7.2 Bargaining Power of Suppliers
- 4.7.3 Bargaining Power of Buyers
- 4.7.4 Threat of Substitutes
- 4.7.5 Competitive Rivalry
- 4.8 PESTLE Analysis
5 Market Size & Growth Forecasts
- 5.1 By Power Source
- 5.1.1 Thermal (Coal, Natural Gas, Oil and Diesel)
- 5.1.2 Nuclear
- 5.1.3 Renewables (Solar, Wind, Hydro, Geothermal, Biomass & Waste, Tidal)
- 5.2 By End User
- 5.2.1 Utilities
- 5.2.2 Commercial and Industrial
- 5.2.3 Residential
- 5.3 By T&D Voltage Level (Qualitative Analysis only)
- 5.3.1 High-Voltage Transmission (Above 230 kV)
- 5.3.2 Sub-Transmission (69 to 161 kV)
- 5.3.3 Medium-Voltage Distribution (13.2 to 34.5 kV)
- 5.3.4 Low-Voltage Distribution (Up to 1 kV)
6 Competitive Landscape
- 6.1 Market Concentration
- 6.2 Strategic Moves (M&A, Partnerships, PPAs)
- 6.3 Market Share Analysis (Market Rank/Share for key companies)
- 6.4 Company Profiles (includes Global level Overview, Market level overview, Core Segments, Financials as available, Strategic Information, Products & Services, and Recent Developments)
- 6.4.1 NextEra Energy Inc
- 6.4.2 American Electric Power
- 6.4.3 FirstEnergy Corp
- 6.4.4 Constellation Energy
- 6.4.5 Mitsubishi Power Americas
- 6.4.6 Duke Energy Corp
- 6.4.7 Berkshire Hathaway Energy
- 6.4.8 Public Service Enterprise Group
- 6.4.9 Pattern Energy Group
- 6.4.10 Southern Company
- 6.4.11 Vistra Corp
- 6.4.12 AES Corporation
- 6.4.13 Orsted A/S (US)
- 6.4.14 ABB USA
- 6.4.15 Exelon Corp
- 6.4.16 Entergy Corp
- 6.4.17 Eversource Energy
- 6.4.18 General Electric Vernova
- 6.4.19 Toshiba America Energy Systems
7 Market Opportunities & Future Outlook
- 7.1 White-space & Unmet-Need Assessment
 電力零售市場-全球產業規模、佔有率、趨勢、機會和預測:按市場結構、客戶類型、服務類型、支付方式、地區和競爭格局分類,2021-2031年
 中國電力產業:市場佔有率分析、產業趨勢與統計及成長預測(2026-2031年)
 再生能源線路市場預測至2034年-能源來源、輸電網類型、最終用戶和地區分類的全球分析
 2026-2030年全球電力交易市場
 2026年人工智慧(AI)資料中心熱能儲存全球市場報告2026年全球太陽能人工智慧市場報告2026年全球可再生能源購電合約市場報告
 人工智慧在能源與電力市場的應用:策略性洞察與預測(2026-2031)
 可調可再生能源市場規模、佔有率和趨勢分析報告:按技術、最終用途、地區和細分市場分類,預測至2026-2033年西班牙電力:市場佔有率分析、行業趨勢和統計數據、成長預測(2026-2031 年)