


 |
市場調查報告書
商品編碼
2065579
CRM整合ERP:市場佔有率分析、產業趨勢與統計、成長預測(2026-2031)CRM-Integrated Enterprise Resource Planning - Market Share Analysis, Industry Trends & Statistics, Growth Forecasts (2026 - 2031) |
||||||

※ 本網頁內容可能與最新版本有所差異。詳細情況請與我們聯繫。
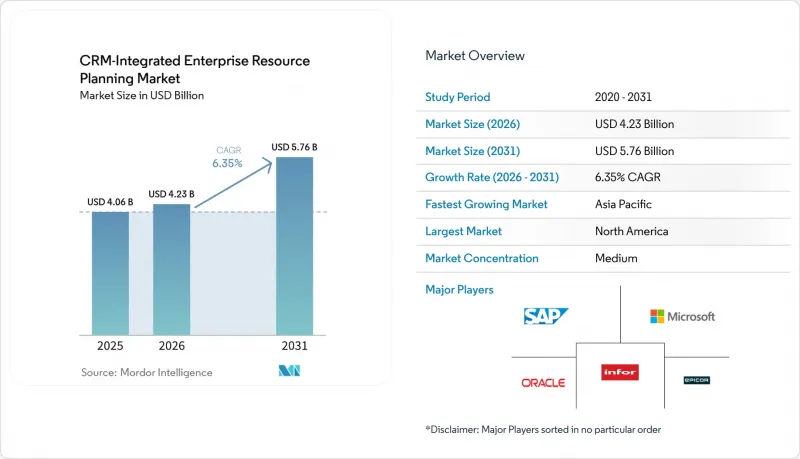
根據 Mordor Intelligence 預測,CRM 整合 ERP 市場將從 2026 年的 42.3 億美元成長到 2031 年的 57.6 億美元,2026 年至 2031 年的複合年成長率為 6.35%。
本報告按部署類型(本地部署、雲端部署、混合部署)、組織規模(中小企業、大型企業)、元件(軟體、服務)、產業(製造業、零售和電子商務、醫療保健、銀行業、金融服務和保險業、IT和電信業、其他)以及地區進行細分。市場預測以美元計價。
全球CRM與ERP市場趨勢與洞察
「雲端優先」的數位轉型至關重要。
隨著企業逐步淘汰本地硬體並採用可擴展的平台,即時同步客戶和交易數據,預計到2031年,雲端採用率將以14.20%的複合年成長率成長,是整體CRM整合ERP市場成長率的兩倍多。中東地區分別於2026年和2027年實施電子帳單的最後期限,以及日本為中小企業津貼的計劃,都加速了這一趨勢。透過整合財務、庫存和客戶模組,Microsoft Dynamics 365用戶已將平均訂單到付款週期縮短了30%。供應商也積極回應,整合自動更新的稅務引擎和本地化包,從而消除了困擾本地部署系統的繁瑣的手動修補工作。
整合客戶資料和業務資料的必要性
資料庫碎片化會導致隱性成本,但可以透過實施整合套件來解決這個問題。已實施整合 CRM 和 ERP 平台的公司報告稱,報價錯誤率降低了 40%,準時交付率提高了 25%,因為在訂單確認之前,客戶信用狀況、庫存和物流數據都會檢驗。銀行、金融和保險 (BFSI) 行業的公司正在利用 360 度客戶視圖提供即時交叉銷售提案,零售商正在同步線上和線下庫存以避免代價高昂的缺貨。這些成果的基礎是 API 優先的設計,它允許第三方應用程式使用事件驅動的端點,而無需依賴易受攻擊的批次介面。
複雜的實施過程會帶來較高的整體擁有成本。
軟體授權成本僅佔專案總成本的 20% 到 30%,其餘部分則用於資料遷移、客製化和變更管理,這些費用可能使預算翻三倍。諮詢顧問的收費為每小時 200 到 350 美元,但受監管行業還需要額外的檢驗程序,例如 FDA 21 CFR Part 11 測試,這會使成本再增加 25% 到 40%。培訓投入不足往往會導致使用者抵觸,如果變更計畫的預算分配不足 15%,失敗率將超過 60%。即使是雲端客戶也需要警惕無節制的訂閱擴展,因為未使用的 SaaS 授權會增加持續營運成本。
細分市場分析
預計到2025年,雲端採用將佔總營收的49.80%,複合年成長率(CAGR)為14.20%,是CRM整合ERP市場基準成長率的兩倍多。企業正在減少伺服器投資,並將資金轉移到分析和創新領域,而供應商則在增加區域容量,例如Oracle在東京投資80億美元進行擴容。歐盟資料法透過強制資料可攜性,使企業更容易更換雲端服務供應商,但中國的在地化法規阻礙了公共雲端的採用。混合架構可以作為一種折衷方案,但設計不良可能會因整合延遲和安全管理問題而抵消成本節約。
當出於知識產權或國防法規方面的考慮而禁止外部託管時,混合部署和本地部署仍然是可行的選擇。製藥公司正在將人力資源和採購系統遷移到雲端,同時仍保留內部經過驗證的生產模組。因此,CRM整合ERP市場持續支援多種部署模式,但使用趨勢明顯偏向SaaS。
中小企業 (SME) 的複合年成長率 (CAGR) 為 15.90%,幾乎是整體 CRM 整合 ERP 市場成長率的三倍。印度政府推出的 PACS ERP舉措(價值 29.2539 億印度盧比,約 3.5 億美元)等計畫為農村合作社提供津貼,而歐盟的「數位十年」津貼旨在到 2030 年實現中小企業 90% 的數位化。大型企業預計到 2025 年仍將佔據 54.10% 的市場佔有率,但由於系統更新周期較長以及專有程式碼的根深蒂固,其成長速度有所放緩。不過,它們正在將分散的系統整合為整合套件,以最大限度地減少整合帶來的額外成本。
中小企業通常選擇模組化的雲端服務包,以便隨著業務成長擴展,從而徹底擺脫本地部署環境。但這種模式也存在著一個風險,那就是「訂閱疲勞」。隨著新增功能的推出,每月費用可能從 500 美元飆升至 5000 美元,最終甚至可能與永久許可證的成本持平。然而,隨著人工智慧和即時分析功能的普及,中小企業與成熟的全球企業之間的功能差距正在縮小。
區域分析
到2025年,北美將佔銷售額的38.20%,成為領先市場。隨著市場滲透率趨於成熟,新客戶獲取已趨於平穩,供應商正專注於現有客戶的續約、人工智慧附加元件以及特定產業的業務拓展。美墨加協定(USMCA)下的跨境貿易刺激了對能夠即時自動計算關稅和原產地證書的軟體套件的需求。
亞太地區是成長最快的地區,年複合成長率高達13.80%。中國的網路安全法規強制要求在國內進行伺服器託管,這賦予了本土供應商競爭優勢,並迫使跨國公司在國內建造資料中心。印度在全國實施PACS系統、日本為中小企業提供6.6億美元的補貼以及Oracle在東京的擴容,都在推動SaaS的快速普及。儘管語言和法規的多樣性增加了在地化成本,但也為該地區的細分市場企業帶來了商機。
歐洲的成長受到雙重限制,既要遵守歐盟資料法,也要遵守英國脫歐後的資料法規,這需要為跨國部署建構平行的管治結構。德國、英國和法國佔據了全部區域的大部分支出,其中德國傾向於在本地管理其自身的調度演算法。在中東,由於強制性電子帳單立法的實施,市場正在加速發展;而非洲和南美洲雖然仍是新興市場,但由於遺留IT債務較少,雲端採用率正在上升。
其他好處:
- Excel格式的市場預測(ME)表
- 3個月的分析師支持
目錄
第1章:引言
- 研究假設和市場定義
- 調查範圍
第2章:調查方法
第3章執行摘要
第4章 市場狀況
- 市場概覽
- 市場促進因素
- 透過「雲端優先」的方式推動數位轉型。
- 整合客戶資料和業務資料的必要性
- 人工智慧在流程自動化領域的快速普及
- 訂閱式授權模式的興起
- 對行業專用ERP套件的需求日益成長
- 政府支持中小企業數位轉型的措施
- 市場限制因素
- 複雜實施方案的總擁有成本高
- 網路安全和資料主權問題
- 合格的執行人員短缺
- 與舊有系統互通性面臨的挑戰
- 產業價值鏈分析
- 監理情勢
- 技術展望
- 宏觀經濟因素對市場的影響
- 波特五力分析
第5章 市場規模與成長預測
- 部署模式
- 現場
- 雲
- 混合
- 按組織規模
- 小型企業
- 大公司
- 按組件
- 軟體
- 服務
- 按行業分類
- 製造業
- 零售與電子商務
- 衛生保健
- 銀行業、金融服務業及保險業
- 資訊科技/通訊
- 政府
- 其他工業部門
- 按地區
- 北美洲
- 美國
- 加拿大
- 墨西哥
- 南美洲
- 巴西
- 阿根廷
- 其他南美國家
- 歐洲
- 德國
- 英國
- 法國
- 其他歐洲國家
- 亞太地區
- 中國
- 日本
- 印度
- 其他亞太國家
- 中東
- 沙烏地阿拉伯
- 阿拉伯聯合大公國
- 其他中東國家
- 非洲
- 南非
- 奈及利亞
- 其他非洲國家
- 北美洲
第6章 競爭情勢
- 市場集中度
- 策略趨勢
- 市佔率分析
- 公司簡介
- SAP SE
- Oracle Corporation
- Microsoft Corporation
- Infor Inc.
- Epicor Software Corporation
- Workday Inc.
- Sage Group plc
- IFS AB
- Syspro(Pty)Ltd.
- Unit4 NV
- Acumatica, Inc.
- Plex Systems, Inc.
- QAD Inc.
- Deltek, Inc.
- Ramco Systems Limited
- Odoo SA
- Zoho Corporation Pvt. Ltd.
- Priority Software Ltd.
- TOTVS SA
- Epicor Kinetic(Epicor rebrand)
- Infor M3(Infor solution)
第7章 市場機會與未來展望
According to Mordor Intelligence, the cRM-Integrated eRP market size is expected to grow from USD 4.23 billion in 2026 to USD 5.76 billion by 2031 at a CAGR of 6.35% over 2026-2031.
This report is Segmented by Deployment Mode (On-Premises, Cloud, and Hybrid), Organization Size (Small and Medium Enterprises, and Large Enterprises), Component (Software and Services), Industry Vertical (Manufacturing, Retail and E-Commerce, Healthcare, Banking, Financial Services and Insurance, IT and Telecom, and More), and Geography. The Market Forecasts are Provided in Terms of Value (USD).
Global CRM-Integrated Enterprise Resource Planning Market Trends and Insights
Cloud-First Digital Transformation Mandates
Cloud deployments are growing at a 14.20% CAGR through 2031, more than double the overall CRM-Integrated ERP market rate, as enterprises retire on-premises hardware in favor of scalable platforms that synchronize customer and transactional data in real time. Middle Eastern e-invoicing deadlines for 2026 and 2027, together with Japan's subsidy program that funds up to 50% of migration costs for SMEs, are accelerating this movement. Microsoft Dynamics 365 users have already cut average order-to-cash cycles by 30% after consolidating finance, inventory, and customer modules. Vendors are responding by embedding tax engines and localization packs that update automatically, removing the manual patching burden that plagued on-premises systems.
Need for Unified Customer and Operational Data
Fragmented databases inflate hidden costs that integrated suites eliminate. Enterprises with unified CRM-ERP platforms reported 40% fewer quote errors and 25% better on-time delivery because customer credit, inventory, and logistics data are validated before order confirmation. BFSI adopters are harnessing 360-degree customer views to recommend cross-sell offers in real time, while retailers synchronize online and store inventory to avert costly stock-outs. An API-first design underpins these gains, exposing event-driven endpoints that third-party apps consume without brittle batch interfaces.
High Total Cost of Ownership for Complex Deployments
Software licenses account for just 20%-30% of project spend, with the rest consumed by data migration, customization, and change management that can triple budgets. Consultants bill USD 200-350 per hour, while regulated industries face extra validation steps, such as FDA 21 CFR Part 11 testing, which adds another 25%-40%. Underfunded training often leads to user resistance, pushing failure rates above 60% when less than 15% of budgets go to change programs. Even cloud customers must guard against subscription sprawl, as unused SaaS seats can inflate recurring costs.
Other drivers and restraints analyzed in the detailed report include:
- Rapid Adoption of AI-Driven Process Automation
- Rising Subscription-Based Licensing Models
- Cyber-Security and Data-Sovereignty Concerns
For complete list of drivers and restraints, kindly check the Table Of Contents.
Segment Analysis
Cloud deployments secured 49.80% of 2025 revenue and are forecast to grow at 14.20% CAGR, more than twice the CRM-Integrated ERP market benchmark. Enterprises are routing capital away from servers toward analytics and innovation, while vendors reinforce regional capacity, such as Oracle's USD 8 billion Tokyo build-out. The EU Data Act eases provider switching by mandating data portability, yet China's localization rules temper public cloud adoption. Hybrid architectures act as a compromise, but integration latency and security management can erode savings if poorly engineered.
Hybrid and on-premises options persist where intellectual-property concerns or defense regulations prohibit external hosting. Pharmaceutical firms still maintain validated manufacturing modules on-site, even as they place HR and procurement in the cloud. Consequently, the CRM-Integrated ERP market continues to support multiple deployment models, though the usage tilt clearly favors SaaS.
Small and medium enterprises are advancing at a 15.90% CAGR, nearly triple the overall CRM-Integrated ERP market growth rate. Government programs such as India's INR 2,925.39 crore (USD 350 million) PACS ERP initiative subsidize rural cooperatives, while European Union Digital Decade grants aim to achieve 90% digitization of SMEs by 2030. Large enterprises, which still held 54.10% market share in 2025, face slower growth due to longer refresh cycles and entrenched custom code. Yet they are consolidating disparate stacks into unified suites to minimize integration overhead.
SMEs often skip on-premises footprints entirely, adopting modular cloud bundles that expand as business needs grow. The risk is subscription fatigue, as incremental add-ons can escalate monthly spend from USD 500 to USD 5,000, converging with perpetual ownership costs over time. Nevertheless, accessibility to AI features and real-time analytics is narrowing the capability gap between small firms and global incumbents.
Geography Analysis
North America led with 38.20% revenue in 2025. Mature penetration limits new-logo growth, steering vendors toward replacements, AI add-ons, and vertical expansions. Cross-border trade under USMCA is stimulating demand for suites that automate tariff and origin documentation in real time.
Asia-Pacific is the fastest-growing region, with a 13.80% CAGR. China's cybersecurity statutes obligate domestic hosting, giving local suppliers an edge and compelling multinationals to build in-country data centers. India's national PACS rollout, Japan's USD 660 million SME subsidy, and Oracle's Tokyo capacity expansion are powering rapid SaaS uptake. Diverse languages and regulations inflate localization costs but create openings for regional niche players.
Europe's growth is moderated by dual compliance with the EU Data Act and the U.K.'s post-Brexit data regime, which forces parallel governance frameworks for cross-border deployments. Germany, the United Kingdom, and France account for a significant share of regional spend, with Germany favoring on-premises control of proprietary scheduling algorithms. The Middle East is accelerating under mandatory e-invoicing laws, while Africa and South America remain emerging but demonstrate strong cloud adoption where legacy IT debt is minimal.
- SAP SE
- Oracle Corporation
- Microsoft Corporation
- Infor Inc.
- Epicor Software Corporation
- Workday Inc.
- Sage Group plc
- IFS AB
- Syspro (Pty) Ltd.
- Unit4 N.V.
- Acumatica, Inc.
- Plex Systems, Inc.
- QAD Inc.
- Deltek, Inc.
- Ramco Systems Limited
- Odoo SA
- Zoho Corporation Pvt. Ltd.
- Priority Software Ltd.
- TOTVS S.A.
- Epicor Kinetic (Epicor rebrand)
- Infor M3 (Infor solution)
Additional Benefits:
- The market estimate (ME) sheet in Excel format
- 3 months of analyst support
TABLE OF CONTENTS
1 INTRODUCTION
- 1.1 Study Assumptions and Market Definition
- 1.2 Scope of the Study
2 RESEARCH METHODOLOGY
3 EXECUTIVE SUMMARY
4 MARKET LANDSCAPE
- 4.1 Market Overview
- 4.2 Market Drivers
- 4.2.1 Cloud-First Digital Transformation Mandates
- 4.2.2 Need for Unified Customer and Operational Data
- 4.2.3 Rapid Adoption of AI-Driven Process Automation
- 4.2.4 Rising Subscription-Based Licensing Models
- 4.2.5 Growing Demand for Vertical-Specific ERP Suites
- 4.2.6 Government Incentives for SME Digitalization
- 4.3 Market Restraints
- 4.3.1 High Total Cost of Ownership for Complex Deployments
- 4.3.2 Cyber-Security and Data-Sovereignty Concerns
- 4.3.3 Limited Qualified Implementation Talent Pool
- 4.3.4 Interoperability Challenges with Legacy Systems
- 4.4 Industry Value Chain Analysis
- 4.5 Regulatory Landscape
- 4.6 Technological Outlook
- 4.7 Impact of Macroeconomic Factors on the Market
- 4.8 Porter's Five Forces Analysis
- 4.8.1 Threat of New Entrants
- 4.8.2 Bargaining Power of Suppliers
- 4.8.3 Bargaining Power of Buyers
- 4.8.4 Threat of Substitutes
- 4.8.5 Competitive Rivalry
5 MARKET SIZE AND GROWTH FORECASTS (VALUE)
- 5.1 By Deployment Mode
- 5.1.1 On-Premises
- 5.1.2 Cloud
- 5.1.3 Hybrid
- 5.2 By Organization Size
- 5.2.1 Small and Medium Enterprises
- 5.2.2 Large Enterprises
- 5.3 By Component
- 5.3.1 Software
- 5.3.2 Services
- 5.4 By Industry Vertical
- 5.4.1 Manufacturing
- 5.4.2 Retail and E-Commerce
- 5.4.3 Healthcare
- 5.4.4 Banking, Financial Services and Insurance
- 5.4.5 Information Technology and Telecommunications
- 5.4.6 Government
- 5.4.7 Other Industry Verticals
- 5.5 By Geography
- 5.5.1 North America
- 5.5.1.1 United States
- 5.5.1.2 Canada
- 5.5.1.3 Mexico
- 5.5.2 South America
- 5.5.2.1 Brazil
- 5.5.2.2 Argentina
- 5.5.2.3 Rest of South America
- 5.5.3 Europe
- 5.5.3.1 Germany
- 5.5.3.2 United Kingdom
- 5.5.3.3 France
- 5.5.3.4 Rest of Europe
- 5.5.4 Asia-Pacific
- 5.5.4.1 China
- 5.5.4.2 Japan
- 5.5.4.3 India
- 5.5.4.4 Rest of Asia-Pacific
- 5.5.5 Middle East
- 5.5.5.1 Saudi Arabia
- 5.5.5.2 United Arab Emirates
- 5.5.5.3 Rest of Middle East
- 5.5.6 Africa
- 5.5.6.1 South Africa
- 5.5.6.2 Nigeria
- 5.5.6.3 Rest of Africa
- 5.5.1 North America
6 COMPETITIVE LANDSCAPE
- 6.1 Market Concentration
- 6.2 Strategic Moves
- 6.3 Market Share Analysis
- 6.4 Company Profiles (includes Global Level Overview, Market Level Overview, Core Segments, Financials as available, Strategic Information, Market Rank/Share, Products and Services, Recent Developments)
- 6.4.1 SAP SE
- 6.4.2 Oracle Corporation
- 6.4.3 Microsoft Corporation
- 6.4.4 Infor Inc.
- 6.4.5 Epicor Software Corporation
- 6.4.6 Workday Inc.
- 6.4.7 Sage Group plc
- 6.4.8 IFS AB
- 6.4.9 Syspro (Pty) Ltd.
- 6.4.10 Unit4 N.V.
- 6.4.11 Acumatica, Inc.
- 6.4.12 Plex Systems, Inc.
- 6.4.13 QAD Inc.
- 6.4.14 Deltek, Inc.
- 6.4.15 Ramco Systems Limited
- 6.4.16 Odoo SA
- 6.4.17 Zoho Corporation Pvt. Ltd.
- 6.4.18 Priority Software Ltd.
- 6.4.19 TOTVS S.A.
- 6.4.20 Epicor Kinetic (Epicor rebrand)
- 6.4.21 Infor M3 (Infor solution)
7 MARKET OPPORTUNITIES AND FUTURE OUTLOOK
- 7.1 White-Space and Unmet-Need Assessment

 基於雲端的企業資源規劃市場:按組件、部署方式、組織規模、技術和產業分類 - 全球市場預測(2026-2032 年)
 基於雲端的企業資源規劃(ERP):市場佔有率分析、產業趨勢和統計數據以及成長預測(2026-2031 年)
 雲端ERP市場規模、佔有率和成長分析:按組件、部署類型、組織規模、業務職能、產業和地區分類-2026年至2033年產業預測中小企業的雲端ERP:市佔率分析、產業趨勢與統計及成長預測(2026-2031年)
 雲ERP市場規模、佔有率、成長率和全球產業分析:按類型、應用和地區分類的洞察,2026-2034年預測
 2026年全球雲端ERP市場報告2026年全球雲端ERP市場報告
 雲端ERP市場分析及預測(至2035年):依類型、產品類型、服務、技術、組件、應用、部署類型、最終用戶、模組及功能分類全球雲端ERP市場規模、佔有率、趨勢和成長分析報告(2026-2034年)2026 年至 2032 年雲端企業資源規劃市場(按組件、最終用戶和地區分類)