


 |
市場調查報告書
商品編碼
2064526
組織網路分析(ONA)平台:市場佔有率分析、產業趨勢與統計資料、成長預測(2026-2031)Organizational Network Analysis (ONA) Platform - Market Share Analysis, Industry Trends & Statistics, Growth Forecasts (2026 - 2031) |
||||||

※ 本網頁內容可能與最新版本有所差異。詳細情況請與我們聯繫。
根據 Mordor Intelligence 預測,組織網路分析 (ONA) 平台市場將從 2025 年的 6 億美元和 2026 年的 7 億美元成長到 2031 年的 15.5 億美元,2026 年至 2031 年的年複合成長率(CAGR)為 17.23%。
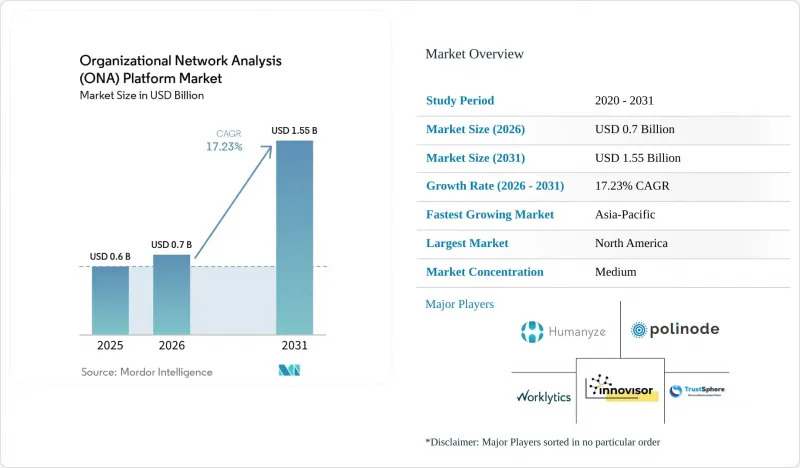
本報告按元件(平台和服務)、部署模式(雲端、本地部署、混合部署)、企業規模(大型企業和中小企業)、應用程式(組織架構設計、人才規劃等)、最終用戶產業(銀行、金融服務和保險等)以及地區進行細分。市場預測以美元計價。
全球組織網路分析 (ONA) 平台市場趨勢與洞察
混合辦公模式日益複雜,推動了對協作透明度的需求。
混合辦公模式的興起直接推動了組織網路分析 (ONA) 平台市場的發展,因為管理者無法再僅憑固定的辦公室出勤率來可靠地了解員工的實際協作情況。一份 2025 年的報告指出,員工在典型的工作日會遇到 275 次干擾,並發送 153 條 Teams訊息,這表明訊息量本身已不再是衡量協作效率的有效指標。在這種情況下,被動網路數據比定期調查更有價值,因為它能夠捕捉到反覆出現的連接、瓶頸和協調負擔。 Worklytics 在 2025 年的報告還顯示,強制員工返回辦公室的團隊之後往往會出現密切協作成員密度下降的情況,而被動 ONA 訊號可以在員工離職前 4-6 週以 70-80% 的準確率識別出自願離職風險。這項前置作業時間至關重要,因為企業擴大將組織網路分析平台用於持續的人才規劃週期,而不僅僅是進行一次性診斷,這些週期與人才保留、選址策略和團隊重組緊密相關。
防止工作倦怠使得協作過載分析至關重要。
組織網路分析 (ONA) 平台市場也受益於對協作過載進行評估的需求,因為協作過載會導致人員流失和專注時間減少。 2025 年 10 月,使用基於 ONA 的專注模組的 SaaS 公司在 90 天內,主觀「專注時間」評分提高了 22%,認知疲勞降低了 15%。 Worklytics 在 2025 年的一項研究表明,干預中心性排名前 10% 的員工,其倦怠的可能性是普通員工的 1.8 倍。研究還顯示,每週協作時間超過 25 小時的團隊,其創新成果提高了 23%,但人員流失風險也高出 31%。這推動了對能夠區分必要協作和不必要工作量的平台的需求,組織網路分析平台市場在員工健康和生產力預算中的地位也日益增強。
對資料隱私和倫理監管的擔憂
組織網路分析 (ONA) 平台市場正面臨隱私法規的直接限制,因為在主要司法管轄區,與就業相關的行為數據正受到越來越嚴格的監控。到 2025 年,86% 的員工認為,關於 ONA 資料收集的資訊揭露應是一項法律要求,這表明即使在正式採用之前,信任度也存在顯著差距。這個問題具有重大的法律影響。 《一般資料保護規範》(GDPR) 第 83 條第 5 款規定,非法處理員工資料可處以最高相當於全球年營業額 4% 的罰款,如果管治設計不足,風險將進一步增加。 2026 年 4 月發布的一項調查顯示,歐洲當局正在加強對被動行為監控的審查,歐盟人工智慧法也為人工智慧驅動的就業系統增加了新的評估要求。因此,那些在其產品中整合控制功能、同意選項和特定司法管轄區資料處理能力的供應商正在獲得優勢,而缺乏強大隱私團隊的中型買家在採用方面則落後於競爭對手。
細分市場分析
在2025年的組織網路分析(ONA)平台市場中,基於平台的解決方案佔了74.20%的佔有率。這表明,在企業範圍內擴展網路智慧時,買家更傾向於持續分析層,而非專案主導服務。這一趨勢與從週期性調查工作向持續被動分析的轉變相吻合,因為持續的協作數據需要軟體基礎設施來大規模地捕獲、處理和視覺化活動。因此,儘管部署支援仍然很重要,但軟體主導的收入仍然主導著組織網路分析平台市場。對許多客戶而言,最初的購買動機是需要為分散式團隊建立單一、可信賴的網路可見度資訊來源。這使得平台層成為資料管治、儀錶板和未來人工智慧輔助建模的控制點。
服務業持續成長,預計到2031年將達到17.24%的複合年成長率。這是因為企業在實施初期通常需要部署設計、變更處理、管治和客製化建模方面的協助。組織網路分析平台產業仍然依賴服務支援來應對大型複雜交易,因為買家需要客製化的整合工作,而不是標準的上線服務。隨著時間的推移,自助配置和更強大的模板可能會將常規設定任務轉移回產品端,從而降低服務在不太複雜的交易中的作用。同時,大規模生態系統供應商正在將類似服務的功能直接整合到他們的軟體中,這對獨立的、諮詢主導的模式構成了壓力。 Cornerstone於2026年5月發布的Workforce AI涵蓋了186個國家的4500萬用戶和超過55000個技能本體,這表明大型平台正在吸收曾經超出核心軟體範圍的深層工作流程。
至2025年,基於雲端的部署將佔據組織網路分析平台市場69.80%的佔有率。這主要歸功於其快速部署、低基礎設施負擔以及與眾多買家已在使用的SaaS環境的高度親和性。早期部署主要由技術主導公司完成,這些公司追求快速實現價值,且資料居住限制有限。因此,對於那些優先考慮速度、實驗性和易於跨區域擴展的買家而言,雲端成為預設模式。組織網路分析(ONA)平台市場的大部分需求仍來自這些「雲端優先」用戶,因為該軟體能夠與已在雲端運作的數位協作系統緊密整合。在這些部署中,部署模式的選擇通常更基於與其他協作堆疊的兼容性,而不僅僅是個人偏好。
混合部署目前是成長最快的部署模式,預計到2031年將以18.37%的複合年成長率成長,這主要得益於受監管產業希望在防火牆內保留敏感員工資料的同時,利用基於雲端的分析和人工智慧功能。在銀行、金融和保險(BFSI)、醫療保健和政府部門,這一點尤其明顯,因為在這些部門,個人資料管理是採購過程中面臨的核心挑戰。對於那些正在擴大雲端採用但尚未準備好將所有員工資料遷移到外部環境的組織而言,這種模式極具吸引力。本地部署在對國家主權和國防至關重要的環境中仍然非常重要,但其角色越來越集中於嚴格控制和有限的用例。隨著合規性要求的提高,預計線上分析(ONA)平台市場將繼續向混合設計轉型,以平衡分析柔軟性和更嚴格的數據處理。
區域分析
到 2025 年,北美將佔據組織網路分析 (ONA) 平台 41.30% 的市場佔有率。這主要得益於該地區大規模混合辦公模式的實施、成熟的人才分析專案以及強大的 ONA 純供應商和套件供應商基礎。美國仍然是該地區的主要需求來源,這主要得益於已部署大規模數位化協作系統的公司的積極採用。 Microsoft Viva Insights 透過在現有 Microsoft 365 環境中提供「多元化連結」、「強連結」和「影響力排名」等指標,提高了使用者對 ONA 平台的認知度。這至關重要,因為它降低了 ONA 採用的初始門檻,並為買家提供了從嵌入式指標到完整平台購買的路徑。加拿大和墨西哥正在擴大在北美地區的市場佔有率,但與美國相比,這兩個國家仍處於 ONA 採用的早期階段。
亞太地區是線上分析(ONA)平台市場成長最快的地區,預計到2031年將以17.89%的複合年成長率成長。 2025年3月的一項調查顯示,亞太地區近75%的組織仍處於人力分析成熟度1-2級,而美洲地區的組織則已達到4級,這表明亞太地區存在大量尚未在ONA方面進行大規模投資的潛在買家。另一項2025年的調查發現,亞太地區73%的人力資源負責人在過去18個月中實施或變更了其人力資源技術平台,其中46%的負責人預計會增加預算。這證實了新的ONA供應商進入市場的有利環境。印度、日本和韓國憑藉其在ONA應用方面的強大基礎脫穎而出,這得益於不斷擴展的技術服務、人力資源平台的現代化以及分析成熟度的提高。
到2025年,歐洲將成為第二大市場,其中德國、英國、法國和比荷盧經濟聯盟國家將成為組織網路分析平台市場的主要需求基地。該地區與其他地區的主要區別在於監管的嚴格性。由於GDPR和歐盟人工智慧法規的實施,隱私設計在該地區比許多其他市場更為重要。這增加了合規成本,並經常導致更長的引進週期,因此,擁有強大的用戶許可管理、本地化控制和「隱私設計」產品架構的供應商更具優勢。南美洲和中東及非洲市場仍處於起步階段,需求主要集中在跨國公司的子公司和尋求員工隊伍現代化的當地企業。
其他好處:
- Excel格式的市場預測(ME)表
- 3個月的分析師支持
目錄
第1章:引言
- 研究假設和市場定義
- 調查範圍
第2章:調查方法
第3章執行摘要
第4章 市場狀況
- 市場概覽
- 市場促進因素
- 混合辦公模式日益複雜,推動了對協作透明度的需求。
- 預防倦怠可改善協作過載分析
- 影響關係圖對於併購和轉型專案至關重要。
- 生成式人工智慧能夠對網路進行預測性洞察。
- 企業人工智慧部署管治需要進行影響擴散映射。
- 最佳化開發者體驗將創建一個新的 ONA 採購中心。
- 市場限制因素
- 對資料隱私和倫理監管的擔憂
- 整合分散的協作資料來源的複雜性
- 員工因感覺被監視而降低信任度。
- 經營團隊對網路指標缺乏了解,延緩了這些指標的實用化。
- 產業價值鏈分析
- 監理情勢
- 技術展望
- 宏觀經濟因素對市場的影響
- 波特五力分析
第5章 市場規模與成長預測
- 按組件
- 平台
- 服務
- 按部署模式
- 基於雲端的
- 現場
- 混合
- 按最終用戶公司規模分類
- 大公司
- 小型企業
- 透過使用
- 組織設計與人員規劃
- 協作與溝通分析
- 變革管理與轉型
- 領導與影響力圖譜
- 創新網路分析
- 其他
- 按最終用戶行業分類
- BFSI
- 醫療保健和生命科學
- 資訊科技/通訊
- 零售與電子商務
- 工業製造
- 政府/公共部門
- 按地區
- 北美洲
- 美國
- 加拿大
- 墨西哥
- 南美洲
- 巴西
- 阿根廷
- 其他南美國家
- 歐洲
- 德國
- 英國
- 法國
- 義大利
- 西班牙
- 俄羅斯
- 荷蘭
- 其他歐洲國家
- 亞太地區
- 中國
- 日本
- 印度
- 韓國
- 澳洲和紐西蘭
- 其他亞太國家
- 中東
- 沙烏地阿拉伯
- 阿拉伯聯合大公國
- 其他中東國家
- 非洲
- 南非
- 奈及利亞
- 其他非洲國家
- 北美洲
第6章 競爭情勢
- 市場集中度
- 策略趨勢
- 市佔率分析
- 公司簡介。
- Humanyze
- Innovisor
- Polinode Pty Ltd.
- Worklytics Co.
- TrustSphere Pte. Ltd.
- SWOOP Analytics Pty Ltd.
- Network Perspective Sp. z oo
- Maven Seven Solutions Plc.
- Cognitive Talent Solutions Inc.
- Glickon SpA
- People Yield srl
- Edgius Inc.
- Panalyt Inc.
- Time is Ltd. sro
- Teamspective Oy
- Confirm HR, Inc.
- Peoplelogic, Inc.
- Mentis Talent Technologies Pte. Ltd.
- Kumu Inc.
- Skyminyr Inc.
第7章 市場機會與未來展望
According to Mordor Intelligence, the organizational network analysis (ONA) platform market size is projected to expand from USD 0.60 billion in 2025 and USD 0.70 billion in 2026 to USD 1.55 billion by 2031, registering a CAGR of 17.23% between 2026 to 2031.
This report is Segmented by Component (Platform, and Services), Deployment Model (Cloud-Based, On-Premises, and Hybrid), Enterprise Size (Large Enterprises, and Small and Medium-Sized Enterprises), Application (Organizational Design, and Workforce Planning and More), End-User Industry (BFSI, and More), and Geography. The Market Forecasts are Provided in Terms of Value (USD).
Global Organizational Network Analysis (ONA) Platform Market Trends and Insights
Hybrid Work Complexity Expands Demand for Collaboration Visibility
The organizational network analysis (ONA) platform market is seeing direct support from hybrid work, as fixed office attendance no longer provides managers with a reliable view of how people actually work together. In 2025, it was reported that employees handled 275 interruptions a day and exchanged 153 Teams messages on a typical weekday, which shows why message volume alone is no longer a useful stand-in for productive collaboration. In this setting, passive network data has become more valuable than periodic surveys because it captures recurring ties, bottlenecks, and coordination strain as they happen. Worklytics also found in 2025 that return-to-office cohorts often lost close collaborator density after mandate implementation, and that passive ONA signals could identify voluntary departure risk 4-6 weeks before exits with 70-80% accuracy. That lead time matters because enterprises are now using the organizational network analysis platform market less for one-off diagnostics and more for ongoing workforce planning cycles tied to retention, location strategy, and team redesign.
Burnout Prevention Elevates Collaboration Overload Analytics
The organizational network analysis (ONA) platform market is also gaining from the need to measure collaboration overload before it turns into turnover or lower focus time. In October 2025, SaaS organizations using ONA-informed focus blocks saw a 22% rise in perceived focus time and a 15% drop in cognitive fatigue within 90 days. Worklytics found in 2025 that the top 10% of employees ranked by betweenness centrality were 1.8 times more likely to face burnout than the wider workforce. The same study showed that teams logging more than 25 weekly collaboration hours produced 23% higher innovation output but also carried 31% higher turnover risk. This is widening demand for platforms that can separate necessary collaboration from wasteful load, which gives the organizational network analysis platform market a stronger position within broader workforce health and productivity budgets.
Data Privacy and Ethical Surveillance Concerns
The organizational network analysis (ONA) platform market faces a direct restraint from privacy regulations, as employment-related behavioral data is now drawing closer scrutiny across major jurisdictions. In 2025, 86% of employees believed that disclosure of ONA data collection should be a legal requirement, indicating a significant trust gap before deployment even begins. The same issue carries legal weight because GDPR Article 83(5) allows fines of up to 4% of global annual turnover for unlawful processing of employee data, thereby raising the stakes for weak governance design. Research published in April 2026 noted that European authorities were increasing scrutiny of passive behavioral monitoring and that the EU AI Act adds new assessment demands for AI-assisted employment systems. As a result, vendors that build transparency controls, consent options, and jurisdiction-specific data-handling into their products are gaining an advantage, while mid-sized buyers without strong privacy teams are moving more slowly.
Other drivers and restraints analyzed in the detailed report include:
- M&A and Transformation Programs Need Influence Mapping
- Generative AI Enables Prescriptive Network Insights
- Integration Complexity Across Fragmented Collaboration Data Sources
For complete list of drivers and restraints, kindly check the Table Of Contents.
Segment Analysis
Platform solutions accounted for 74.20% of the organizational network analysis (ONA) platform market in 2025, indicating that buyers prefer a persistent analytics layer over project-led services when they need network intelligence to scale across the enterprise. This pattern aligns with the shift toward continuous passive analysis rather than periodic survey work because recurring collaboration data requires software infrastructure to ingest, process, and visualize activity at scale. The organizational network analysis platform market, therefore, continues to favor software-led revenue even when implementation support remains important. In many accounts, the first purchase is driven by the need to establish a single source of truth for network visibility across distributed teams. That makes the platform layer the control point for data governance, dashboarding, and future AI-assisted modeling.
Services are still growing and are projected to record a 17.24% CAGR through 2031 because enterprises often need help with deployment design, change support, governance, and custom modeling during early rollout stages. The organizational network analysis platform industry still relies on service support for large, complex accounts, where buyers want tailored integration work rather than standard onboarding. Over time, self-serve configuration and stronger templates are likely to shift routine setup work back into the product, which narrows the role of services in lower-complexity deals. At the same time, large ecosystem vendors are building service-like functionality directly into their software, which puts pressure on standalone advisory-led models. Cornerstone's May 2026 Workforce AI launch, covering 45 million users across 186 countries and more than 55,000 skills ontologies, shows how broad platforms are absorbing more of the workflow depth that once sat outside core software.
Cloud-based deployment held 69.80% of the organizational network analysis platform market share in 2025 because it offers faster setup, lower infrastructure burden, and a cleaner fit with the SaaS environments that many buyers already use. Early adoption largely came from technology-led enterprises that wanted quick time-to-value and faced limited data residency constraints. That made cloud the default model for buyers focused on speed, experimentation, and easier expansion across regions. The organizational network analysis (ONA) platform market still draws much of its current volume from those cloud-first users because the software is closely tied to digital collaboration systems that already run in the cloud. In these accounts, deployment choice has often been less about preference and more about matching the rest of the collaboration stack.
Hybrid deployment is now the fastest-growing path and is projected to grow at a 18.37% CAGR through 2031, as regulated sectors seek to keep sensitive employee data behind the firewall while still using cloud-side analytics and AI features. This is especially visible in BFSI, healthcare, and government, where control over people's data has become central to procurement. The model appeals to organizations that are still moving toward broader cloud adoption but are not ready to transfer all workforce data to external environments. On-premises deployment remains relevant in sovereign or defense-sensitive settings, yet its role is increasingly focused on a narrower set of highly controlled use cases. As compliance demands rise, the ONA platform market is likely to keep shifting toward hybrid designs that balance analytical flexibility with stricter data handling.
Geography Analysis
North America accounted for 41.30% of the organizational network analysis (ONA) platform market share in 2025 because the region combines large hybrid-work employers, mature people analytics programs, and a strong base of pure-play and suite vendors. The United States remained the main source of regional demand, with adoption supported by enterprises that already use digital collaboration systems at scale. Microsoft Viva Insights has helped widen exposure by making metrics such as diverse ties, strong ties, and influence rank available inside existing Microsoft 365 environments. That matters because it lowers the barrier to initial ONA use and gives buyers a path from embedded metrics to fuller platform purchases. Canada and Mexico are growing within the regional base, though both remain earlier in adoption than the United States.
Asia-Pacific is the fastest-growing region in the ONA platform market, advancing at a 17.89% CAGR through 2031. In March 2025, research showed that close to 75% of APAC organizations were still at Levels 1-2 of people analytics maturity, compared with the Americas, where organizations were concentrated at Level 4, suggesting a large base of buyers that have yet to make a major ONA investment. Another study found in 2025 that 73% of APAC HR leaders had adopted or changed their HR technology platform in the prior 18 months, while 46% expected budget increases, which supports a favorable environment for new ONA vendor entry. India, Japan, and South Korea stand out because technology services expansion, HR platform renewal, and growing analytics maturity are creating a stronger base for ONA deployment.
Europe held the second-largest regional position in 2025, with Germany, the United Kingdom, France, and the Benelux countries forming the core demand base for the organizational network analysis platform market. The region's main difference is regulatory intensity, since GDPR enforcement and the EU AI Act make privacy design a more central buying factor than in many other markets. This raises compliance costs and often lengthens deployment cycles, favoring vendors with strong consent management, localization controls, and a privacy-by-design product architecture. South America, the Middle East, and Africa remain earlier-stage markets, where demand is concentrated in multinational subsidiaries and the largest local enterprises pursuing workforce modernization.
- Humanyze
- Innovisor
- Polinode Pty Ltd.
- Worklytics Co.
- TrustSphere Pte. Ltd.
- SWOOP Analytics Pty Ltd.
- Network Perspective Sp. z o.o.
- Maven Seven Solutions Plc.
- Cognitive Talent Solutions Inc.
- Glickon S.p.A.
- People Yield srl
- Edgius Inc.
- Panalyt Inc.
- Time is Ltd. s.r.o.
- Teamspective Oy
- Confirm HR, Inc.
- Peoplelogic, Inc.
- Mentis Talent Technologies Pte. Ltd.
- Kumu Inc.
- Skyminyr Inc.
Additional Benefits:
- The market estimate (ME) sheet in Excel format
- 3 months of analyst support
TABLE OF CONTENTS
1 INTRODUCTION
- 1.1 Study Assumptions and Market Definition
- 1.2 Scope of the Study
2 RESEARCH METHODOLOGY
3 EXECUTIVE SUMMARY
4 MARKET LANDSCAPE
- 4.1 Market Overview
- 4.2 Market Drivers
- 4.2.1 Hybrid Work Complexity Expands Demand for Collaboration Visibility
- 4.2.2 Burnout Prevention Elevates Collaboration Overload Analytics
- 4.2.3 M&A and Transformation Programs Need Influence Mapping
- 4.2.4 Generative AI Enables Prescriptive Network Insights
- 4.2.5 Enterprise AI Rollout Governance Requires Influence Diffusion Mapping
- 4.2.6 Developer Experience Optimization Creates New ONA Buying Center
- 4.3 Market Restraints
- 4.3.1 Data Privacy and Ethical Surveillance Concerns
- 4.3.2 Integration Complexity Across Fragmented Collaboration Data Sources
- 4.3.3 Employee Trust Erosion From Perceived Monitoring
- 4.3.4 Weak Managerial Fluency In Network Metrics Slows Actionability
- 4.4 Industry Value Chain Analysis
- 4.5 Regulatory Landscape
- 4.6 Technological Outlook
- 4.7 Impact of Macroeconomic Factors on the Market
- 4.8 Porter's Five Forces Analysis
- 4.8.1 Bargaining Power of Buyers
- 4.8.2 Bargaining Power of Suppliers
- 4.8.3 Threat of New Entrants
- 4.8.4 Threat of Substitutes
- 4.8.5 Intensity of Competitive Rivalry
5 MARKET SIZE AND GROWTH FORECASTS (VALUE)
- 5.1 By Component
- 5.1.1 Platform
- 5.1.2 Services
- 5.2 By Deployment Model
- 5.2.1 Cloud-based
- 5.2.2 On-premises
- 5.2.3 Hybrid
- 5.3 By End User Enterprise Size
- 5.3.1 Large Enterprises
- 5.3.2 Small and Medium-sized Enterprises
- 5.4 By Application
- 5.4.1 Organizational Design and Workforce Planning
- 5.4.2 Collaboration and Communication Analytics
- 5.4.3 Change Management and Transformation
- 5.4.4 Leadership and Influence Mapping
- 5.4.5 Innovation Network Analysis
- 5.4.6 Others
- 5.5 By End User Industry
- 5.5.1 BFSI
- 5.5.2 Healthcare and Life Sciences
- 5.5.3 Information Technology and Telecom
- 5.5.4 Retail and E-commerce
- 5.5.5 Industrial Manufacturing
- 5.5.6 Government and Public Sector
- 5.6 By Geography
- 5.6.1 North America
- 5.6.1.1 United States
- 5.6.1.2 Canada
- 5.6.1.3 Mexico
- 5.6.2 South America
- 5.6.2.1 Brazil
- 5.6.2.2 Argentina
- 5.6.2.3 Rest of South America
- 5.6.3 Europe
- 5.6.3.1 Germany
- 5.6.3.2 United Kingdom
- 5.6.3.3 France
- 5.6.3.4 Italy
- 5.6.3.5 Spain
- 5.6.3.6 Russia
- 5.6.3.7 Netherlands
- 5.6.3.8 Rest of Europe
- 5.6.4 Asia-Pacific
- 5.6.4.1 China
- 5.6.4.2 Japan
- 5.6.4.3 India
- 5.6.4.4 South Korea
- 5.6.4.5 Australia and New Zealand
- 5.6.4.6 Rest of Asia-Pacific
- 5.6.5 Middle East
- 5.6.5.1 Saudi Arabia
- 5.6.5.2 United Arab Emirates
- 5.6.5.3 Rest of Middle East
- 5.6.6 Africa
- 5.6.6.1 South Africa
- 5.6.6.2 Nigeria
- 5.6.6.3 Rest of Africa
- 5.6.1 North America
6 COMPETITIVE LANDSCAPE
- 6.1 Market Concentration
- 6.2 Strategic Moves
- 6.3 Market Share Analysis
- 6.4 Company Profiles (includes Global Level Overview, Market Level Overview, Core Segments, Financials as available, Strategic Information, Market Rank/Share, Products and Services, Recent Developments).
- 6.4.1 Humanyze
- 6.4.2 Innovisor
- 6.4.3 Polinode Pty Ltd.
- 6.4.4 Worklytics Co.
- 6.4.5 TrustSphere Pte. Ltd.
- 6.4.6 SWOOP Analytics Pty Ltd.
- 6.4.7 Network Perspective Sp. z o.o.
- 6.4.8 Maven Seven Solutions Plc.
- 6.4.9 Cognitive Talent Solutions Inc.
- 6.4.10 Glickon S.p.A.
- 6.4.11 People Yield srl
- 6.4.12 Edgius Inc.
- 6.4.13 Panalyt Inc.
- 6.4.14 Time is Ltd. s.r.o.
- 6.4.15 Teamspective Oy
- 6.4.16 Confirm HR, Inc.
- 6.4.17 Peoplelogic, Inc.
- 6.4.18 Mentis Talent Technologies Pte. Ltd.
- 6.4.19 Kumu Inc.
- 6.4.20 Skyminyr Inc.
7 MARKET OPPORTUNITIES AND FUTURE OUTLOOK
- 7.1 White-space and unmet-need assessment

 人工智慧在網路流量分析的應用:市場佔有率分析、產業趨勢與統計數據以及成長預測(2026-2031 年)
 智慧電信流量分析市場預測至2034年-按組件、部署模式、技術、應用、最終用戶和地區分類的全球分析
 2026年全球網路流量分析市場報告2026年全球網路流量分析解決方案市場報告
 2026-2030年全球組織網路分析工具市場
 網路流量分析解決方案市場分析及預測(至2035年):按類型、產品類型、服務、技術、組件、應用、流程、部署類型和最終用戶分類
 網路流量分析解決方案市場 - 全球產業規模、佔有率、趨勢、機會、預測:按部署類型、用戶類型、最終用戶、地區和競爭對手分類,2021-2031 年
 網路流量分析市場規模、佔有率和成長分析(按組件、部署類型、組織規模、最終用戶產業和地區分類)-2026-2033年產業預測網路流量分析市場 - 全球產業規模、佔有率、趨勢、機會和預測,按組件、部署模式、組織規模、最終用戶、地區和競爭格局細分,2020-2030 年預測
 網路流量分析市場機會、成長動力、產業趨勢分析及 2025 - 2034 年預測