


 |
市場調查報告書
商品編碼
2064409
東亞可再生能源:市場佔有率分析、產業趨勢與統計及成長預測(2026-2031年)East Asia Renewable Energy - Market Share Analysis, Industry Trends & Statistics, Growth Forecasts (2026 - 2031) |
||||||
※ 本網頁內容可能與最新版本有所差異。詳細情況請與我們聯繫。
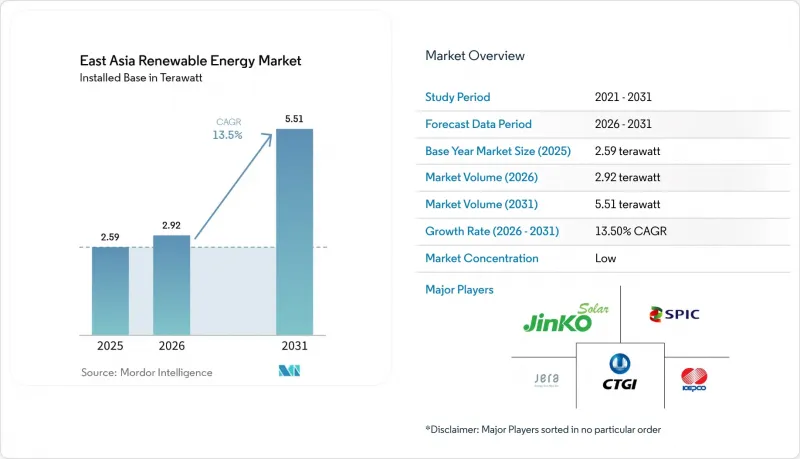
根據 Mordor Intelligence 預測,東亞可再生能源市場規模(以裝置容量計算)預計到 2025 年將達到 2.59兆瓦,到 2026 年將達到 2.92兆瓦,到 2031 年將達到 5.51兆瓦,2026 年至 2031 年的複合年成長率為 13.5%。
本報告按技術(太陽能、風能、水力、生質能源能、地熱能和海洋能)、最終用戶(公共產業、商業和工業以及住宅)和地區(中國、日本、韓國、台灣和其他東亞國家)進行細分。市場預測以容量(太瓦,TW)為單位。
東亞可再生能源市場趨勢與洞察
政府脫碳義務和補貼計劃
如今,區域政策框架已將吉瓦級目標納入經濟規劃。中國的「十五」規劃將省級GDP指標與可再生能源普及率掛鉤,確保發電能力提升的政治課責。日本於2024年制定的第七個能源戰略規劃將2040年可再生能源發電目標提高到50%,並轉向根據批發價格浮動的上網電價補貼(FIT)競標機制。這不僅保障了開發商的現金流,也降低了財務風險。韓國的「RE3020」計畫要求公共機構在2030年實現35%的電力來自可再生能源,為此,截至2025年已舉行了18場大型太陽能發電競標競標。台灣已立法設立一項280億美元的離岸風電和綠色氫能基金,計劃於2030年前完成,能源署將按季度進行監督。當這些計劃結合起來時,區域碳價格的下限將約為每噸 45 美元,這將使未併入聯邦的排放電廠在本世紀末之前失去競爭力。
太陽能和風能的平準化度電成本快速下降
2024年,亞太地區太陽能和風能的平準化度電成本(LCOE)下降了16%。這主要得益於多晶矽的過剩、N型電池效率超過25%以及雙面組件普及率接近70%,這些因素共同作用,使得組件價格降至每瓦0.09美元。 2024年,中國大規模太陽能發電的平均發電成本為每兆瓦時27美元,比天然氣發電便宜35%。在內蒙古自治區,由於競標了一台6.5兆瓦級、轉子直徑180公尺的風力發電機,2025年風電工程的中標價格為每兆瓦時31美元。離岸風電成本依然高成本,但在全羅南道,一條以本地為導向的供應鏈正在建設中,目標是到2028年將成本降至每兆瓦時55美元,屆時斗山能源的15兆瓦級機艙將實現量產。成本的持續降低正在擴大東亞可再生能源市場的潛在規模,並推動混合儲能系統的應用,以確保在尖峰時段獲得溢價收益。
電網擁塞和減產風險
儘管2025年新增太陽能發電裝置容量180吉瓦,但電網擴容未能跟上,導致2026年1月至2月中國太陽能發電棄光率高達9.2%。在西藏,由於僅有一條3吉瓦輸電線路可供400兆瓦負載使用,白天17%的太陽能發電被浪費。國家電網已撥款6,500億元人民幣用於2027年前新建五條特高壓輸電走廊,但典型建設週期可達四年。在北海道,自從引入高壓直流輸電以來,棄光率有所下降,顯示透過建造有針對性的輸電網路可以解決瓶頸問題。然而,在韓國,如果不安裝儲能設施,可變可再生能源的比例仍僅限於25%。持續的電網擁塞阻礙了短期新增裝置容量,並限制了東亞可再生能源市場的成長潛力。
細分市場分析
到2025年,太陽能發電將佔總裝置容量的53.1%。成本的持續下降、沙漠地區大型電站的建設以及強制性的屋頂光伏發電系統鞏固了其主導地位,但正如多晶矽審計所顯示的那樣,其供應鏈正呈現兩極分化的趨勢。 2025年,海洋能的裝置容量將不到300兆瓦,年複合成長率將達到43.4%,而韓國始華大壩和日本普羅透斯渦輪機等項目已具備商業化條件。
風力渦輪機尺寸的不斷增大提升了風電的貢獻。目前,16兆瓦級風力發電平台每年可發電80吉瓦時,比2020年加倍。抽水蓄能電站,例如中國3.6吉瓦的豐寧水力發電廠,能夠穩定波動的電力輸出;而九州地熱發電的加入則豐富了日本的能源結構。隨著太陽能發電成本降至每瓦0.10美元以下,聚光型太陽熱能發電和生質能源仍是小眾市場。離岸風電技術的成功試點計畫預計將東亞可再生能源市場的版圖拓展到傳統資源邊界之外。
其他好處:
- Excel格式的市場預測(ME)表
- 3個月的分析師支持
目錄
第1章:引言
- 研究假設和市場定義
- 調查範圍
第2章:調查方法
第3章執行摘要
第4章 市場狀況
- 市場概覽
- 市場促進因素
- 政府脫碳義務和補貼計劃
- 太陽能和風能的平準化度電成本快速下降
- 資料中心和重工業買家簽訂的企業購電協議 (PPA) 數量激增。
- 跨境高壓直流「超級電網」的建置(中國、日本、韓國)
- 區域離岸風力發電製造群(福建省、全羅南道)
- 人工智慧驅動的發電預測將提高其在電網中的部署上限。
- 市場限制因素
- 電網擁塞和減產風險
- 陸上資產土地使用及授權延誤
- 多晶矽價格飆升是新疆審計壓力造成的。
- 颱風多發地區離岸風力發電的保險費
- 供應鏈分析
- 監理情勢
- 技術展望
- 波特五力模型
第5章 市場規模與成長預測
- 透過技術
- 太陽能(光伏和聚光太陽能)
- 風力發電(陸上和海上)
- 水力發電(小規模、大型、抽水蓄能)
- 生質能源
- 地熱
- 海洋能源(潮汐能和波浪能)
- 最終用戶
- 公用事業
- 商業和工業用途
- 住宅
- 按地區
- 中國
- 日本
- 韓國
- 台灣
- 其他東亞國家(蒙古、香港、澳門)
第6章 競爭情勢
- 市場集中度
- 策略性措施(併購、合資、資金籌措、購電協議)
- 市場佔有率分析(主要公司的市場排名和佔有率)
- 公司簡介
- State Power Investment Corporation(SPIC)
- China Three Gorges Corp(CTG)
- JinkoSolar Holding Co Ltd
- LONGi Green Energy Technology Co Ltd
- Xinjiang Goldwind Science & Technology Co Ltd
- Trina Solar Ltd
- JA Solar Technology Co Ltd
- Siemens Gamesa Renewable Energy SA
- Vestas Wind Systems A/S
- Eurus Energy Holdings Corp
- Korea Electric Power Corp(KEPCO)
- JERA Co Inc
- Mitsubishi Corp(Renewables)
- Orsted A/S(Taiwan JV)
- CGN New Energy Holdings Co Ltd
- Shenergy Group Co Ltd
- Tokyo Electric Power Renewable Power Co
- Hanwha Q-Cells Co Ltd
- SK E&S Co Ltd
- Orsted Japan KK
第7章 市場機會與未來展望
According to Mordor Intelligence, the east asia renewable energy market size in terms of installed base is projected to be 2.59 terawatt in 2025, 2.92 terawatt in 2026, and reach 5.51 terawatt by 2031, growing at a CAGR of 13.5% from 2026 to 2031.
This report is Segmented by Technology (Solar Energy, Wind Energy, Hydropower, Bioenergy, Geothermal, Ocean Energy), End-User (Utilities, Commercial and Industrial, Residential), and Geography (China, Japan, South Korea, Taiwan, Rest of East Asia). The Market Forecasts are Provided in Terms of Volume (TW).
East Asia Renewable Energy Market Trends and Insights
Government Decarbonization Mandates & Subsidy Mechanisms
Regional policy frameworks now embed gigawatt-scale targets in economic planning. China's 15th Five-Year Plan ties provincial GDP metrics to renewable roll-outs, ensuring political accountability for capacity gains. Japan's seventh Strategic Energy Plan finalized in 2024 raised the 2040 renewable electricity goal to 50% and switched to feed-in-premium auctions that flex with wholesale prices, reducing fiscal exposure while safeguarding developer cash flows. South Korea's RE3020 requires public institutions to source 35% of power from renewables by 2030, already catalyzing 18 utility-scale solar tenders in 2025. Taiwan legislated a USD 28 billion offshore wind and green hydrogen fund through 2030, monitored quarterly by the Bureau of Energy. Together these programs imply a regional carbon price floor near USD 45 per ton, rendering unabated coal uncompetitive before the decade's end.
Rapid LCOE Decline for Solar PV & Wind
Asia-Pacific solar and wind levelized costs fell 16% in 2024 as polysilicon oversupply, N-type cell efficiencies above 25%, and bifacial adoption near 70% drove module prices to USD 0.09 per watt. China's utility-scale PV averaged USD 27 per MWh in 2024, undercutting gas by 35%. Inner Mongolia wind auctions cleared at USD 31 per MWh in 2025 thanks to 6.5 MW turbines with 180-meter rotors. Offshore wind remains pricier, yet localized supply chains in Jeollanam-do aim for USD 55 per MWh by 2028 as Doosan Enerbility's 15 MW nacelles reach volume scale. Continuous cost compression widens the East Asia renewable energy market addressable base and encourages hybrid storage pairings that secure evening-peak premiums.
Grid Congestion & Curtailment Risk
Solar curtailment in China hit 9.2% during Jan-Feb 2026 as 180 GW of 2025 additions outpaced transmission growth. Tibet dumped 17% of midday solar because a lone 3 GW line serves a 400 MW load. State Grid has earmarked CNY 650 billion for five new ultra-high-voltage corridors through 2027, yet typical build times run up to four years. Hokkaido's curtailment drop post-HVDC shows targeted links can resolve bottlenecks, but Korea still caps variable renewable share at 25% without co-located storage. Persistent congestion restrains near-term additions and trims the East Asia renewable energy market growth runway.
Other drivers and restraints analyzed in the detailed report include:
- Corporate-PPA Boom from Data-Center & Heavy-Industry Buyers
- Cross-Border HVDC Super-Grid Build-Out
- Land-Use & Permitting Delays for Onshore Assets
For complete list of drivers and restraints, kindly check the Table Of Contents.
Segment Analysis
Solar Energy commanded 53.1% of installed capacity in 2025. Continuous cost declines, desert mega-bases, and rooftop mandates cement its primacy, though polysilicon audits bifurcate supply chains. Ocean Energy's low 2025 base under 300 MW underpins its 43.4% CAGR, with South Korea's Sihwa barrage and Japan's Proteus turbine signaling commercial readiness.
Turbine scaling lifts wind contributions; 16 MW platforms now generate 80 GWh annually, doubling 2020 units. Pumped-storage hydro like China's 3.6 GW Fengning plant stabilizes variable output, while geothermal additions in Kyushu diversify Japan's mix. Concentrating solar and bioenergy stay niche as PV costs plunge below USD 0.10 per watt. Ocean technology pilot success could expand the East Asia renewable energy market frontier beyond traditional resources.
List of Companies Covered in this Report:
- State Power Investment Corporation (SPIC)
- China Three Gorges Corp (CTG)
- JinkoSolar Holding Co Ltd
- LONGi Green Energy Technology Co Ltd
- Xinjiang Goldwind Science & Technology Co Ltd
- Trina Solar Ltd
- JA Solar Technology Co Ltd
- Siemens Gamesa Renewable Energy SA
- Vestas Wind Systems A/S
- Eurus Energy Holdings Corp
- Korea Electric Power Corp (KEPCO)
- JERA Co Inc
- Mitsubishi Corp (Renewables)
- Orsted A/S (Taiwan JV)
- CGN New Energy Holdings Co Ltd
- Shenergy Group Co Ltd
- Tokyo Electric Power Renewable Power Co
- Hanwha Q-Cells Co Ltd
- SK E&S Co Ltd
- Orsted Japan KK
Additional Benefits:
- The market estimate (ME) sheet in Excel format
- 3 months of analyst support
TABLE OF CONTENTS
1 Introduction
- 1.1 Study Assumptions & Market Definition
- 1.2 Scope of the Study
2 Research Methodology
3 Executive Summary
4 Market Landscape
- 4.1 Market Overview
- 4.2 Market Drivers
- 4.2.1 Government decarbonisation mandates & subsidy mechanisms
- 4.2.2 Rapid LCOE decline for solar PV & wind
- 4.2.3 Corporate-PPA boom from data-centre & heavy-industry buyers
- 4.2.4 Cross-border HVDC "super-grid" build-out (CN-JP-KR)
- 4.2.5 Localised offshore-wind manufacturing clusters (Fujian, Jeollanam)
- 4.2.6 AI-driven generation forecasting raising grid-penetration ceilings
- 4.3 Market Restraints
- 4.3.1 Grid congestion & curtailment risk
- 4.3.2 Land-use & permitting delays for onshore assets
- 4.3.3 Polysilicon price-spikes from Xinjiang audit squeeze
- 4.3.4 Typhoon-zone insurance premia for offshore wind farms
- 4.4 Supply-Chain Analysis
- 4.5 Regulatory Landscape
- 4.6 Technological Outlook
- 4.7 Porter's Five Forces
- 4.7.1 Bargaining Power of Suppliers
- 4.7.2 Bargaining Power of Buyers
- 4.7.3 Threat of New Entrants
- 4.7.4 Threat of Substitutes
- 4.7.5 Competitive Rivalry
5 Market Size & Growth Forecasts
- 5.1 By Technology
- 5.1.1 Solar Energy (PV and CSP)
- 5.1.2 Wind Energy (Onshore and Offshore)
- 5.1.3 Hydropower (Small, Large, PSH)
- 5.1.4 Bioenergy
- 5.1.5 Geothermal
- 5.1.6 Ocean Energy (Tidal and Wave)
- 5.2 By End-User
- 5.2.1 Utilities
- 5.2.2 Commercial and Industrial
- 5.2.3 Residential
- 5.3 By Geography
- 5.3.1 China
- 5.3.2 Japan
- 5.3.3 South Korea
- 5.3.4 Taiwan
- 5.3.5 Rest of East Asia (Mongolia, Hong Kong, Macau)
6 Competitive Landscape
- 6.1 Market Concentration
- 6.2 Strategic Moves (M&A, JVs, Funding, PPAs)
- 6.3 Market Share Analysis (Market Rank/Share for key companies)
- 6.4 Company Profiles (includes Global-level Overview, Market-level Overview, Core Segments, Financials, Strategic Information, Products & Services, Recent Developments)
- 6.4.1 State Power Investment Corporation (SPIC)
- 6.4.2 China Three Gorges Corp (CTG)
- 6.4.3 JinkoSolar Holding Co Ltd
- 6.4.4 LONGi Green Energy Technology Co Ltd
- 6.4.5 Xinjiang Goldwind Science & Technology Co Ltd
- 6.4.6 Trina Solar Ltd
- 6.4.7 JA Solar Technology Co Ltd
- 6.4.8 Siemens Gamesa Renewable Energy SA
- 6.4.9 Vestas Wind Systems A/S
- 6.4.10 Eurus Energy Holdings Corp
- 6.4.11 Korea Electric Power Corp (KEPCO)
- 6.4.12 JERA Co Inc
- 6.4.13 Mitsubishi Corp (Renewables)
- 6.4.14 Orsted A/S (Taiwan JV)
- 6.4.15 CGN New Energy Holdings Co Ltd
- 6.4.16 Shenergy Group Co Ltd
- 6.4.17 Tokyo Electric Power Renewable Power Co
- 6.4.18 Hanwha Q-Cells Co Ltd
- 6.4.19 SK E&S Co Ltd
- 6.4.20 Orsted Japan KK
7 Market Opportunities & Future Outlook
- 7.1 White-space & Unmet-Need Assessment
 企業購電協議 (PPA) 平台市場預測至 2034 年—按合約類型、合約期限、能源來源、買方類型、平台模式和地區分類的全球分析農業用電動推進器市場預測至2034年-按系統類型、組件、技術、應用、最終用戶和地區分類的全球分析
 可再生能源市場-全球產業規模、佔有率、趨勢、機會與預測:按類型、最終用途產業、地區和競爭格局分類,2021-2031年混合電池市場-全球產業規模、佔有率、趨勢、機會和預測:按產品類型、額定功率、最終用戶、連接方式、地區和競爭格局分類,2021-2031年
 可再生能源領域的人工智慧市場:按組件、能源類型、部署模式、最終用戶、國家和地區分類-全球產業分析、市場規模、市場佔有率及2026年至2033年預測
 西歐可再生能源:市場佔有率分析、產業趨勢與統計及成長預測(2026-2031 年)
 2026-2030年全球可再生能源市場
 可再生能源保險市場機會、成長要素、產業趨勢分析及2026-2035年預測
 新一輪石油危機:推動通訊業者轉向可再生能源
 可再生能源市場規模、佔有率、成長及全球產業分析:按類型、應用和地區分類的洞察,2026-2034 年預測