

 |
市場調查報告書
商品編碼
2038757
可再生能源保險市場機會、成長要素、產業趨勢分析及2026-2035年預測Renewable Energy Insurance Market Opportunity, Growth Drivers, Industry Trend Analysis, and Forecast 2026 - 2035 |
||||||
2025 年全球可再生能源保險市場價值 89 億美元,預計到 2035 年將達到 585 億美元,年複合成長率為 20.6%。
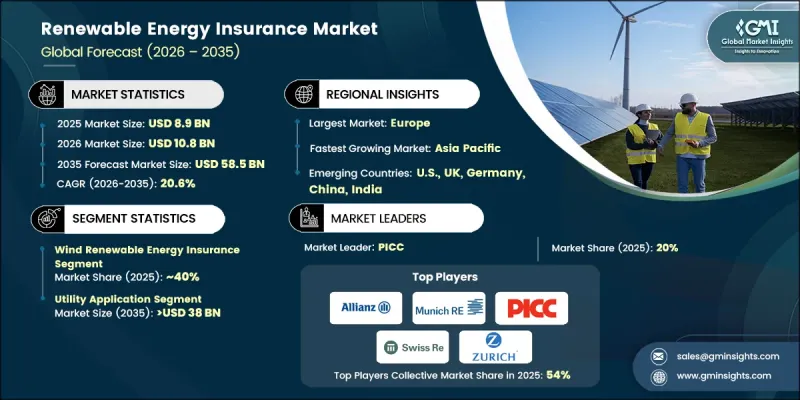
隨著可再生能源資產的擴張,對專業保險解決方案的需求日益成長,以保護高價值資產免受各種風險的影響。地域分散和氣候變遷加劇了環境不確定性,使得風險轉移機制對專案的永續性至關重要。機構和個人投資者對可再生能源發電和能源儲存系統的資金流入進一步凸顯了保險保障的重要性。這些保險合約在保護基礎設施免受營運挑戰、財務損失和意外中斷的影響方面發揮關鍵作用,從而增強了專案的可行性和投資者信心。隨著氣候變遷持續影響能源系統,保險解決方案正成為風險管理框架不可或缺的一部分。因此,可再生能源保險市場正在崛起,成為支持向清潔能源轉型的重要體系,幫助相關人員在應對日益複雜的風險環境時保持財務穩定。
| 市場範圍 | |
|---|---|
| 開始年份 | 2025 |
| 預測期 | 2026-2035 |
| 上市時的市場規模 | 89億美元 |
| 預測金額 | 585億美元 |
| 複合年成長率 | 20.6% |
可再生能源保險透過應對與營運、技術性能和環境因素相關的風險,為專案提供系統性的財務保障。保障範圍通常包括針對實體資產損壞、營運中斷、施工延誤和責任問題的保障。這些保險方案對於開發商、營運商和投資者至關重要,有助於確保專案的長期穩定性並最大限度地降低財務不確定性。隨著環境風險的增加,人們對保險方案的依賴性也日益增強,這反過來又促進了可再生能源基礎設施的普及,並使相關人員能夠更有效地管理潛在損失。
預計到2025年,風電市佔率將達到40%,到2035年將以20%的複合年成長率成長。大規模風電設施的擴張增加了技術和營運風險,可能導致高昂的維修費用和長時間的運作。這些挑戰推動了專門保險產品的開發,以應對性能風險、設備故障和收入中斷,從而增強了專注於該領域的保險公司的前景。
預計到2025年,公共產業領域將佔市場佔有率的69.8%,到2035年將達到380億美元。可再生能源併入公共產業運營,為資產管理和系統可靠性帶來了新的複雜性。這促使人們需要保險解決方案來應對營運風險、系統脆弱性以及服務中斷造成的財務影響。公共產業正擴大採用綜合保險,以防止收入損失並確保能源供應的連續性。
預計到2025年,美國可再生能源保險市場將佔據80%的市場佔有率,市場規模將達到19億美元。隨著環境變化對能源基礎設施的影響日益加劇,資產所有者的財務風險也不斷上升。因此,市場對能夠補償資產損失、營運中斷和性能相關損失的保險解決方案的需求日益成長。此外,隨著人們對永續基礎設施和綠色金融措施的日益關注,各組織也被鼓勵將保險作為其風險管理策略的關鍵要素。
目錄
第1章:調查方法和範圍
第2章執行摘要
第3章業界考察
- 生態系分析
- 原物料供應及採購分析
- 生產能力評估
- 供應鏈韌性與風險因素
- 配電網路分析
- 影響產業的因素
- 促進因素
- 產業潛在風險與挑戰
- 監理情勢
- 成長潛力分析
- 波特五力分析
- PESTEL 分析
- 可再生能源保險成本結構分析
- 新機會和趨勢
- 數位化和物聯網整合
- 未開發市場和應用領域的成長
- 投資分析及未來展望
- 人工智慧和生成式人工智慧對市場的影響(基於初步研究)
- 人工智慧驅動的生產最佳化(基於初步調查)
- 預測性維護和故障檢測(基於初步調查)
第4章 競爭情勢
- 介紹
- 企業市佔率分析:按地區分類
- 北美洲
- 歐洲
- 亞太地區
- 世界其他地區
- 主要市場公司的競爭分析
- 競爭定位矩陣
- 主要進展
- 併購
- 夥伴關係和聯盟
- 新產品發布
- 業務拓展計劃及資金籌措
- 企業級分層基準測試
- 層級分類標準與選擇標準
- 按收入、地區和創新能力分類的層級定位矩陣。
第5章 市場規模及預測:依技術分類,2022-2035年
- 太陽能
- 風力
- 水力發電
- 其他
第6章 市場規模及預測:依薪酬類型分類,2022-2035年
- 財產保險
- 責任險
- 營業中斷保險
- 設備故障保險
- 其他
第7章 市場規模及預測:依最終用途分類,2022-2035年
- 公共產業
- 商業和工業用途
- 住宅
第8章 市場規模及預測:依地區分類,2022-2035年
- 北美洲
- 美國
- 加拿大
- 歐洲
- 英國
- 德國
- 波蘭
- 西班牙
- 法國
- 義大利
- 亞太地區
- 中國
- 日本
- 印度
- 澳洲
- 韓國
- 台灣
- 世界其他地區
第9章:公司簡介
- AEGIS
- AIG
- Allianz
- Aon
- AXA
- AXIS Capital Holdings Limited
- Canopius
- Chubb
- Descartes Underwriting
- Energy Insurance Mutual Limited
- Fairfax Financial Holdings Limited
- Gallagher
- HDI Global
- Horton Group
- kWh Analytics
- Liberty Specialty Markets
- Markel Group Inc.
- Marsh & McLennan Companies, Inc.
- Miller
- Munich Re
- Ping An Insurance(Group)Company of China, Ltd.
- PICC
- RSA Insurance
- Swiss Re
- Tokio Marine Kiln
- Travelers
- Willis Towers Watson(WTW)
- Zurich Insurance
The Global Renewable Energy Insurance Market was valued at USD 8.9 billion in 2025 and is estimated to grow at a CAGR of 20.6% to reach USD 58.5 billion by 2035.
The increasing deployment of renewable energy assets has intensified the need for specialized insurance solutions that safeguard high-value installations against a wide range of risks. Geographic diversity and evolving climate conditions are elevating exposure to environmental uncertainties, making risk transfer mechanisms essential for project sustainability. Capital inflows from institutional and private investors into renewable power generation and energy storage systems are further reinforcing the importance of insurance coverage. These policies play a critical role in protecting infrastructure from operational challenges, financial losses, and unforeseen disruptions, thereby improving project viability and investor confidence. As climate variability continues to influence energy systems, insurance solutions are becoming integral to risk management frameworks. The renewable energy insurance market is therefore emerging as a vital support system for the clean energy transition, helping stakeholders maintain financial stability while navigating an increasingly complex risk environment.
| Market Scope | |
|---|---|
| Start Year | 2025 |
| Forecast Year | 2026-2035 |
| Start Value | $8.9 Billion |
| Forecast Value | $58.5 Billion |
| CAGR | 20.6% |
Renewable energy insurance provides structured financial protection for projects by addressing risks associated with operations, technology performance, and environmental factors. Coverage typically includes protection against physical asset damage, operational interruptions, construction-related setbacks, and liability concerns. These insurance solutions are essential for developers, operators, and investors seeking to ensure long-term project stability and minimize exposure to financial uncertainties. As environmental risks intensify, the reliance on insurance solutions is increasing, supporting broader adoption of renewable energy infrastructure and enabling stakeholders to manage potential losses more effectively.
The wind segment accounted for 40% share in 2025 and is expected to grow at a CAGR of 20% by 2035. The expansion of large-scale wind energy installations has heightened exposure to technical and operational risks, which can result in costly repairs and extended downtime. These challenges are encouraging the development of tailored insurance products that address performance risks, equipment failures, and revenue disruptions, thereby strengthening the outlook for insurers specializing in this segment.
The utility segment accounted for 69.8% of the market in 2025 and is anticipated to reach USD 38 billion by 2035. The integration of renewable energy into utility operations has introduced new complexities in asset management and system reliability. This has increased the need for insurance solutions that address operational risks, system vulnerabilities, and financial impacts associated with service disruptions. Utilities are increasingly adopting comprehensive insurance coverage to protect against revenue loss and ensure continuity in energy supply.
United States Renewable Energy Insurance Market held an 80% share in 2025, generating USD 1.9 billion. The growing impact of environmental disruptions on energy infrastructure has increased financial exposure for asset owners. As a result, there is a growing demand for insurance solutions that cover asset damage, operational interruptions, and performance-related losses. Additionally, the increasing focus on sustainable infrastructure and green financing initiatives is encouraging organizations to incorporate insurance as a key component of their risk management strategies.
Key participants in the Global Renewable Energy Insurance Market include AEGIS, AIG, Allianz, Aon, AXA, AXIS Capital Holdings, Canopius, Chubb, Descartes Underwriting, Energy Insurance Mutual, Fairfax Financial Holdings, Gallagher, HDI Global, Horton Group, kWh Analytics, Liberty Specialty Markets, Markel Group, Marsh & McLennan Companies, Miller, Munich Re, Ping An Insurance (Group) Company of China, PICC, RSA Insurance, Swiss Re, Tokio Marine Kiln, Travelers, Willis Towers Watson (WTW), and Zurich Insurance. Companies operating in the renewable energy insurance market are strengthening their position through innovation, partnerships, and expanded service offerings. They are investing in advanced risk modeling and data analytics to better assess project-specific exposures and provide customized insurance solutions. Strategic collaborations with energy developers and financial institutions are enabling insurers to enhance product relevance and accelerate market penetration. Firms are also broadening their global presence by entering emerging renewable energy markets and strengthening distribution networks.
Table of Contents
Chapter 1 Methodology & Scope
- 1.1 Research approach
- 1.2 Quality commitments
- 1.2.1 GMI AI policy & data integrity commitment
- 1.2.1.1 Source consistency protocol
- 1.2.1 GMI AI policy & data integrity commitment
- 1.3 Research trail & confidence scoring
- 1.3.1 Research trail components
- 1.3.2 Scoring components
- 1.4 Data collection
- 1.4.1 Partial list of primary sources
- 1.5 Data mining sources
- 1.5.1 Paid sources
- 1.5.1.1 Sources, by region
- 1.5.1 Paid sources
- 1.6 Base estimates and calculations
- 1.6.1 Base year calculation for any one approach
- 1.7 Market estimates & forecasts parameters
- 1.8 Forecast model
- 1.8.1 Quantified market impact analysis
- 1.8.1.1 Mathematical impact of growth parameters on forecast
- 1.8.1 Quantified market impact analysis
- 1.9 Research transparency addendum
- 1.9.1 Source attribution framework
- 1.9.2 Quality assurance metrics
- 1.9.3 Our commitment to trust
- 1.10 Market definitions
Chapter 2 Executive Summary
- 2.1 Industry synopsis, 2022 - 2035
- 2.1.1 Business trends
- 2.1.2 Technology trends
- 2.1.3 Coverage type trends
- 2.1.4 End use trends
- 2.1.5 Regional trends
Chapter 3 Industry Insights
- 3.1 Industry ecosystem analysis
- 3.1.1 Raw material availability & sourcing analysis
- 3.1.2 Manufacturing capacity assessment
- 3.1.3 Supply chain resilience & risk factors
- 3.1.4 Distribution network analysis
- 3.2 Industry impact forces
- 3.2.1 Growth drivers
- 3.2.2 Industry pitfalls & challenges
- 3.3 Regulatory landscape
- 3.4 Growth potential analysis
- 3.5 Porter's analysis
- 3.5.1 Bargaining power of suppliers
- 3.5.2 Bargaining power of buyers
- 3.5.3 Threat of new entrants
- 3.5.4 Threat of substitutes
- 3.6 PESTEL analysis
- 3.6.1 Political factors
- 3.6.2 Economic factors
- 3.6.3 Social factors
- 3.6.4 Technological factors
- 3.6.5 Legal factors
- 3.6.6 Environmental factors
- 3.7 Cost structure analysis of renewable energy insurance
- 3.8 Emerging opportunities & trends
- 3.9 Digitalization & IoT integration
- 3.10 Growth in untapped markets & applications
- 3.11 Investment analysis & future prospects
- 3.12 Impact of AI & Generative AI on the market (Driven by Primary Research)
- 3.12.1 AI-Driven production optimization (Driven by Primary Research)
- 3.12.2 Predictive maintenance & fault detection (Driven by Primary Research)
Chapter 4 Competitive Landscape, 2026
- 4.1 Introduction
- 4.2 Company market share analysis, by region, 2025
- 4.2.1 North America
- 4.2.2 Europe
- 4.2.3 Asia Pacific
- 4.2.4 Rest of World
- 4.3 Competitive analysis of major market players
- 4.4 Competitive positioning matrix
- 4.5 Key developments
- 4.5.1 Mergers & acquisitions
- 4.5.2 Partnerships & collaborations
- 4.5.3 New product launches
- 4.5.4 Expansion plans & funding
- 4.6 Company tier benchmarking
- 4.6.1 Tier classification criteria & qualifying thresholds
- 4.6.2 Tier positioning matrix by revenue, geography & innovation
Chapter 5 Market Size and Forecast, By Technology, 2022 - 2035 (USD Million)
- 5.1 Key trends
- 5.2 Solar PV
- 5.3 Wind
- 5.4 Hydropower
- 5.5 Others
Chapter 6 Market Size and Forecast, By Coverage Type, 2022 - 2035 (USD Million)
- 6.1 Key trends
- 6.2 Property insurance
- 6.3 Liability insurance
- 6.4 Business interruption insurance
- 6.5 Equipment breakdown insurance
- 6.6 Others
Chapter 7 Market Size and Forecast, By End Use, 2022 - 2035 (USD Million)
- 7.1 Key trends
- 7.2 Utility
- 7.3 Commercial & industrial
- 7.4 Residential
Chapter 8 Market Size and Forecast, By Region, 2022 - 2035 (USD Million)
- 8.1 Key trends
- 8.2 North America
- 8.2.1 U.S.
- 8.2.2 Canada
- 8.3 Europe
- 8.3.1 UK
- 8.3.2 Germany
- 8.3.3 Poland
- 8.3.4 Spain
- 8.3.5 France
- 8.3.6 Italy
- 8.4 Asia Pacific
- 8.4.1 China
- 8.4.2 Japan
- 8.4.3 India
- 8.4.4 Australia
- 8.4.5 South Korea
- 8.4.6 Taiwan
- 8.5 Rest of World
Chapter 9 Company Profiles
- 9.1 AEGIS
- 9.2 AIG
- 9.3 Allianz
- 9.4 Aon
- 9.5 AXA
- 9.6 AXIS Capital Holdings Limited
- 9.7 Canopius
- 9.8 Chubb
- 9.9 Descartes Underwriting
- 9.10 Energy Insurance Mutual Limited
- 9.11 Fairfax Financial Holdings Limited
- 9.12 Gallagher
- 9.13 HDI Global
- 9.14 Horton Group
- 9.15 kWh Analytics
- 9.16 Liberty Specialty Markets
- 9.17 Markel Group Inc.
- 9.18 Marsh & McLennan Companies, Inc.
- 9.19 Miller
- 9.20 Munich Re
- 9.21 Ping An Insurance (Group) Company of China, Ltd.
- 9.22 PICC
- 9.23 RSA Insurance
- 9.24 Swiss Re
- 9.25 Tokio Marine Kiln
- 9.26 Travelers
- 9.27 Willis Towers Watson (WTW)
- 9.28 Zurich Insurance
 可再生能源市場-全球產業規模、佔有率、趨勢、機會與預測:按類型、最終用途產業、地區和競爭格局分類,2021-2031年混合電池市場-全球產業規模、佔有率、趨勢、機會和預測:按產品類型、額定功率、最終用戶、連接方式、地區和競爭格局分類,2021-2031年
 2026-2030年全球可再生能源市場
 新一輪石油危機:推動通訊業者轉向可再生能源
 可再生能源市場規模、佔有率、成長及全球產業分析:按類型、應用和地區分類的洞察,2026-2034 年預測
 農業可再生能源:生質燃料、太陽能發電廠和永續農業實踐的全球市場—按應用、產品和地區分類的分析和預測(2025-2035 年)
 2026年全球可再生能源市場報告2026年全球多元能源系統市場報告2026年全球太陽能燃料市場報告
 可再生能源市場:全球產業分析、市場規模、市場佔有率及預測(依投資類型、可再生能源類型、企業類型、應用、國家及地區分類)-2026-2033年