

 |
市場調查報告書
商品編碼
2064408
亞太地區需量反應管理系統:市場佔有率分析、產業趨勢與統計、成長預測(2026-2031 年)Asia-Pacific Demand Response Management System - Market Share Analysis, Industry Trends & Statistics, Growth Forecasts (2026 - 2031) |
||||||
※ 本網頁內容可能與最新版本有所差異。詳細情況請與我們聯繫。
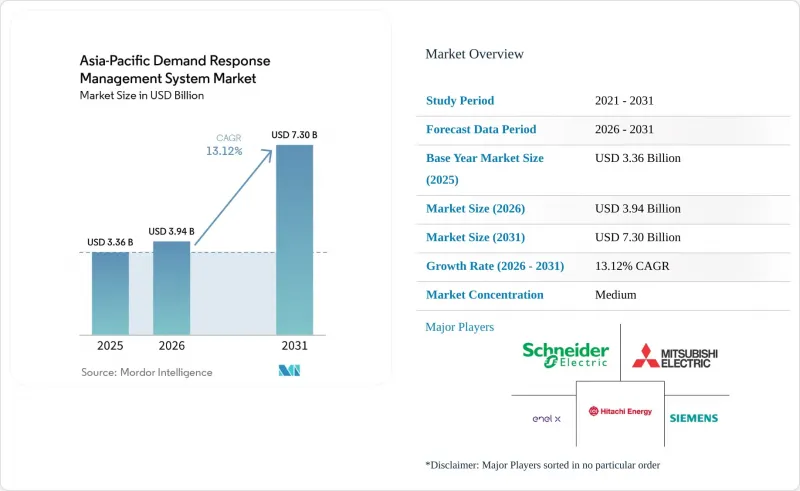
據 Mordor Intelligence 稱,亞太地區需量反應管理系統市場在 2025 年的價值為 33.6 億美元,預計到 2031 年將達到 73 億美元,而 2026 年為 39.4 億美元,預測期(2026-2031 年)的複合成長率為 13.12%。
本報告按類型(傳統型、其他)、專案類型(付費型、其他)、解決方案元件(硬體、其他)、部署方式(雲端託管、其他)、最終用戶(住宅、其他)以及地區(澳洲和紐西蘭、中國、印度、日本、韓國、東南亞國協等亞太國家)進行細分。市場預測以美元計價。
亞太地區需量反應管理系統市場趨勢與分析
全部區域產能市場的快速發展
日本於2024年啟動容量市場,在首個競標週期內獲得了約1吉瓦的需量反應契約,並在2024年夏季用電高峰期進行了19次輸出調整(Enel X數據)。澳洲的批發需量反應(DR)機制從2023年的69兆瓦擴大到2025年6月的92兆瓦,以不到50萬澳元的成本創造了532萬澳元的系統淨收益。韓國於2026年春季引入了半集中式調度規則,允許虛擬電廠(VPP)聚合商整合20兆瓦以下的資產,目標是到2038年實現峰值減排16.3吉瓦。這些框架將靈活的負載轉化為可靠的收入來源,並使聚合商能夠投資遙測基礎設施和機器學習分析,以提高基準準確性。
靈活的「後表」太陽能發電和儲能系統迅速成長。
預計到2025年,全球將新增14.8吉瓦時(GWh)的住宅儲能系統,其中亞太地區將佔58%,較2024年成長42%。在日本,2025年底將安裝18萬個V2H(車輛到離峰時段)充電樁,使電動車車主能夠利用尖峰時段電價差獲利。在澳大利亞,累計住宅儲能系統安裝量將超過50萬套;在中國,受國家發展與改革委員會(發改委)省級自用補貼的推動,2025年住宅儲能市場規模將成長87%。隨著儲能系統的不斷增加,虛擬電廠(VPP)的邊際營運成本降低,縮短了住宅的投資回收期,並擴大了需量反應管理系統市場的潛在住宅基本客群。
各國監理機關收費系統的差異
在東協成員國中,分時電價的適用期限、尖峰時段觸發條件和容量付費方式因國家而異,這使得跨境虛擬電廠的聚合變得複雜。在印度,各邦之間不同的收費系統迫使聚合商應對相互衝突的高峰定義,削弱了規模經濟效益。在中國省級容量市場中,區域性輸出優先順序的實施增加了客戶獲取成本,並延長了軟體供應商的投資回收期。
細分市場分析
在需量反應管理系統市場,自動化平台在2025年佔據了63.8%的收入佔有率,預計到2031年將以14.8%的複合年成長率成長。其主導地位得益於亞秒級的反應速度,這使得使用者能夠參與輔助服務。 2025年韓國即時市場的擴張使得以5分鐘為增量競標成為可能,這是傳統人工方式無法實現的頻率。 2024年夏季,日本電網運作中,自動化投資組合記錄了7吉瓦時的電量,證實了電力公司層面的可靠性。隨著電池儲能的日益普及,機器學習主導的、每天多次循環利用儲能的編配將進一步拉大與傳統系統的性能差距,鞏固自動化在需量反應管理系統市場規模討論中的主導地位。
傳統程序仍然管理著無需快速遙測的現有工業契約,但隨著公用事業公司將硬體遙測和雲API納入新的競標,其佔有率正在逐年下降。如今,大多數新的智慧電錶部署都包含先進的通訊模組,因此添加自動化邏輯的額外成本正在降低。因此,即使是小規模商業機構也發現,從選擇加入的電話通知過渡到全自動需求削減更具成本效益。
2025年,以價格為基礎的收費系統將佔總營收的59.5%,而獎勵機制預計到2031年將以14.5%的複合年成長率成長。日本和韓國的容量競標、菲律賓的備用容量市場以及澳洲的緊急需求控制契約,透過增加容量、能源和輔助收入,提高了聚合商的盈利。工業用戶越來越傾向於選擇有保障的價格而非波動較大的價格調整,這促使採購模式轉向獎勵機制,並擴大了需量反應管理系統中可用性支付的市場佔有率。
住宅用戶目前仍依賴分時電價,因為電力公司只需升級計費系統即可輕鬆實現。然而,隨著使用者行為疲勞逐漸加劇,回應率下降,監管機構正在試行混合模式,透過增加少量容量獎勵來維持使用者參與度。家用電池和V2H(車輛到家庭)充電器的日益普及,將在預測期後半段加速向自動化獎勵計劃的轉變。
其他好處:
- Excel格式的市場預測(ME)表
- 3個月的分析師支持
目錄
第1章:引言
- 市場分析與定義的前提條件
- 分析範圍
第2章 分析方法
第3章執行摘要
第4章 市場狀況
- 市場概覽
- 市場促進因素
- 全部區域產能市場的快速發展
- 靈活的「表後式」太陽能發電+儲能系統快速成長。
- 強制性智慧電錶安裝完成時間(日本:2025年,印度:2027年)
- 綠色資料中心災難復原能力的採購
- 中國和韓國工業鍋爐電氣化
- 市場限制因素
- 不同國家監理機關收費系統的差異
- 由於聚合商的限制,住宅參與率較低。
- 電力分銷公司網路安全投資落後
- 供應鏈分析
- 監理情勢
- 技術展望
- 波特五力分析
第5章:預測市場規模與成長率
- 按類型
- 傳統需量反應
- 自動化/進階需量反應
- 按程式類型
- 基於定價(分時電價、每千人成本、即時價格)
- 基於獎勵的(CBP、DLC、緊急災害應變、輔助服務)
- 按解決方案組件
- 硬體(AMI、負載控制交換器、閘道器)
- 軟體(DRMS、VPP平台)
- 服務(聚合、零售、註冊)
- 透過部署方法
- 雲端託管
- 本地部署/邊緣部署
- 按最終用途
- 住宅
- 商業的
- 工業的
- 按地區
- 澳洲
- 中國
- 印度
- 日本
- 韓國
- 東南亞國協
- 澳洲和紐西蘭
- 其他亞太國家
第6章 競爭情勢
- 市場集中度
- 策略趨勢(併購、聯盟、購電協議)
- 市場佔有率分析(主要公司的市場排名和市場佔有率)
- 公司簡介
- Schneider Electric SE
- Siemens AG
- Hitachi Energy Ltd
- Mitsubishi Electric Corp.
- ABB Ltd.
- Enel X(Enel SpA)
- Eaton Corp. plc
- Itron Inc.(ex-Silver Spring Networks)
- AutoGrid Systems Inc.
- CPower Energy Management
- Tata Power Delhi Distribution
- KEPCO(Korea Electric Power Corp.)
- Landis+Gyr Group
- Digital Energy Corp.(Japan)
- Comverge(now ICF)
- EnerNOC(now Enel X)
- Regen Energy(now Encycle)
- Yokogawa Electric Corp.
- Nuvve Holding Corp.
- GridPoint Inc.
第7章 市場機會與未來展望
According to Mordor Intelligence, the asia-Pacific demand response management system market size was valued at USD 3.36 billion in 2025 and is estimated to grow from USD 3.94 billion in 2026 to reach USD 7.30 billion by 2031, at a CAGR of 13.12% during the forecast period (2026-2031).
This report is Segmented by Type (Conventional, Others), Program Type (Price-Based, Others), Solution Component (Hardware, Others), Deployment Mode (Cloud-Hosted, Others), End-Use (Residential, More), and Geography (Australia and New Zealand, China, India, Japan, South Korea, ASEAN Countries, Rest of Asia Pacific). The Market Forecasts are Provided in Terms of Value (USD).
Asia-Pacific Demand Response Management System Market Trends and Insights
Rapid Roll-Out of Region-Wide Capacity Markets
Japan activated its capacity market in 2024 and cleared roughly 1 GW of demand-response contracts in the first auction cycle, with 19 dispatch events during the 2024 summer peak Enel X. Australia's Wholesale Demand Response mechanism scaled from 69 MW in 2023 to 92 MW by June 2025, delivering net system benefits of AUD 5.32 million against costs below AUD 0.5 million. South Korea adopted semi-centralized dispatch rules in spring 2026, allowing VPP aggregators to pool sub-20 MW assets and targeting 16.3 GW of peak reduction by 2038. These frameworks convert flexible load into a bankable revenue stream, enabling aggregators to finance telemetry infrastructure and machine-learning analytics that sharpen baseline accuracy.
Surge in Flexible, Behind-the-Meter PV-Plus-Storage
Asia-Pacific absorbed 58% of the 14.8 GWh of new residential batteries installed worldwide in 2025, a 42% jump from 2024. Japan added 180,000 vehicle-to-home chargers by year-end 2025, empowering electric-vehicle owners to arbitrage peak and off-peak tariffs. Australia surpassed 500,000 cumulative home-battery installations, while China's household storage segment expanded 87% in 2025 on the back of provincial self-consumption subsidies NDRC. Each incremental battery lowers the marginal cost of VPP dispatch, shortening vendor payback periods and expanding the residential addressable base of the demand response management system market.
Disparate Tariff Structures Across National Regulators
ASEAN members operate divergent time-of-use windows, critical-peak triggers, and capacity-payment formulas that complicate cross-border VPP aggregation. India's state-level tariff patchwork forces aggregators to juggle conflicting peak definitions, reducing scale efficiencies. China's provincial capacity markets impose localized dispatch priorities, creating higher customer-acquisition costs and longer payback periods for software vendors.
Other drivers and restraints analyzed in the detailed report include:
- Smart-Meter Mandate Completions
- Green Data-Center Procurement of DR Capacity
- Low Residential Participation Due to Aggregator Caps
For complete list of drivers and restraints, kindly check the Table Of Contents.
Segment Analysis
Automated platforms owned 63.8% of 2025 revenue in the demand response management system market and are forecast to expand at 14.8% CAGR through 2031. Their dominance is anchored in sub-second response times that enable ancillary-services participation. South Korea's real-time market expansion in 2025 allows 5-minute bidding, a cadence impossible for conventional manual schemes. Japan's summer 2024 dispatch logged 7 GWh from automated portfolios, confirming reliability at utility scale. As battery penetration rises, machine-learning-driven orchestration that cycles storage multiple times per day will widen the performance gap over conventional systems, solidifying automation's leadership position in the demand response management system market size discussions.
Conventional programs still manage legacy industrial contracts that do not require rapid telemetry, yet their share declines annually as utilities embed hard telemetry and cloud APIs into new tenders. The incremental cost of adding automated logic is falling because most new smart-meter rollouts now include advanced communications modules. Consequently, even smaller commercial facilities find it cost-effective to migrate from opt-in phone notifications to fully automated curtailment.
Price-based tariffs still generated 59.5% of 2025 revenue; however, incentive schemes are projected to grow at 14.5% CAGR to 2031. Capacity auctions in Japan and South Korea, reserve markets in the Philippines, and emergency curtailment contracts in Australia stack capacity, energy, and ancillary revenues, improving aggregator economics. Industrial customers favor guaranteed fees over volatile bill savings, shifting procurement toward incentive models and expanding the demand response management system market share of availability payments.
Residential segments remain anchored to time-of-use tariffs because utilities can implement them with billing upgrades alone. Yet behavioral fatigue erodes response over time, prompting regulators to pilot blended models that add small capacity bonuses to retain engagement. Growing deployment of home batteries and vehicle-to-home chargers will accelerate the pivot toward automated incentive programs in the back half of the forecast period.
List of Companies Covered in this Report:
- Schneider Electric SE
- Siemens AG
- Hitachi Energy Ltd
- Mitsubishi Electric Corp.
- ABB Ltd.
- Enel X (Enel SpA)
- Eaton Corp. plc
- Itron Inc. (ex-Silver Spring Networks)
- AutoGrid Systems Inc.
- CPower Energy Management
- Tata Power Delhi Distribution
- KEPCO (Korea Electric Power Corp.)
- Landis+Gyr Group
- Digital Energy Corp. (Japan)
- Comverge (now ICF)
- EnerNOC (now Enel X)
- Regen Energy (now Encycle)
- Yokogawa Electric Corp.
- Nuvve Holding Corp.
- GridPoint Inc.
Additional Benefits:
- The market estimate (ME) sheet in Excel format
- 3 months of analyst support
TABLE OF CONTENTS
1 Introduction
- 1.1 Study Assumptions & Market Definition
- 1.2 Scope of the Study
2 Research Methodology
3 Executive Summary
4 Market Landscape
- 4.1 Market Overview
- 4.2 Market Drivers
- 4.2.1 Rapid roll-out of region-wide capacity markets
- 4.2.2 Surge in flexible, behind-the-meter PV-plus-storage
- 4.2.3 Smart-meter mandate completions (Japan 2025; India 2027)
- 4.2.4 Green data-centre procurement of DR capacity
- 4.2.5 Electrification of industrial boilers in China & S-Korea
- 4.3 Market Restraints
- 4.3.1 Disparate tariff structures across national regulators
- 4.3.2 Low residential participation due to aggregator caps
- 4.3.3 Cyber-security spending lag at distribution utilities
- 4.4 Supply-Chain Analysis
- 4.5 Regulatory Landscape
- 4.6 Technological Outlook
- 4.7 Porter's Five Forces
- 4.7.1 Bargaining Power of Suppliers
- 4.7.2 Bargaining Power of Consumers
- 4.7.3 Threat of New Entrants
- 4.7.4 Threat of Substitute Products & Services
- 4.7.5 Intensity of Competitive Rivalry
5 Market Size & Growth Forecasts
- 5.1 By Type
- 5.1.1 Conventional Demand Response
- 5.1.2 Automated/Advanced Demand Response
- 5.2 By Program Type
- 5.2.1 Price-based (TOU, CPP, RTP)
- 5.2.2 Incentive-based (CBP, DLC, Emergency DR, Ancillary)
- 5.3 By Solution Component
- 5.3.1 Hardware (AMI, Load-control switches, Gateways)
- 5.3.2 Software (DRMS, VPP platforms)
- 5.3.3 Services (Aggregation, Curtailment, Enrolment)
- 5.4 By Deployment Mode
- 5.4.1 Cloud-hosted
- 5.4.2 On-premise/Edge
- 5.5 By End-use
- 5.5.1 Residential
- 5.5.2 Commercial
- 5.5.3 Industrial
- 5.6 By Geography
- 5.6.1 Australia
- 5.6.2 China
- 5.6.3 India
- 5.6.4 Japan
- 5.6.5 South Korea
- 5.6.6 ASEAN Countries
- 5.6.7 Australia and New Zealand
- 5.6.8 Rest of Asia-Pacific
6 Competitive Landscape
- 6.1 Market Concentration
- 6.2 Strategic Moves (M&A, Partnerships, PPAs)
- 6.3 Market Share Analysis (Market Rank/Share for key companies)
- 6.4 Company Profiles (includes Global level Overview, Market level overview, Core Segments, Financials as available, Strategic Information, Products & Services, and Recent Developments)
- 6.4.1 Schneider Electric SE
- 6.4.2 Siemens AG
- 6.4.3 Hitachi Energy Ltd
- 6.4.4 Mitsubishi Electric Corp.
- 6.4.5 ABB Ltd.
- 6.4.6 Enel X (Enel SpA)
- 6.4.7 Eaton Corp. plc
- 6.4.8 Itron Inc. (ex-Silver Spring Networks)
- 6.4.9 AutoGrid Systems Inc.
- 6.4.10 CPower Energy Management
- 6.4.11 Tata Power Delhi Distribution
- 6.4.12 KEPCO (Korea Electric Power Corp.)
- 6.4.13 Landis+Gyr Group
- 6.4.14 Digital Energy Corp. (Japan)
- 6.4.15 Comverge (now ICF)
- 6.4.16 EnerNOC (now Enel X)
- 6.4.17 Regen Energy (now Encycle)
- 6.4.18 Yokogawa Electric Corp.
- 6.4.19 Nuvve Holding Corp.
- 6.4.20 GridPoint Inc.
7 Market Opportunities & Future Outlook
- 7.1 White-space & Unmet-need Assessment
 需量反應和負載管理解決方案市場預測——按解決方案類型、技術、應用、最終用戶和地區分類的全球分析——2034年
 自動化需量反應管理系統:市場佔有率分析、產業趨勢與統計、成長預測(2026-2031 年)
 需量反應管理系統市場:按組件、類型、通訊技術、程序類型、應用和最終用戶分類-2026-2032年全球市場預測
 2026年全球分散式能源資源(DER)安全合規市場報告2026年全球需量反應(DR)市場報告2026年全球需量反應管理系統市場報告2026年全球人工智慧(AI)需求和定價管理市場報告
 2026年全球自動化頻譜管理系統市場研究報告全球人工智慧驅動能源需求預測市場:預測(至2034年)-依預測期、部署方式、技術、應用和區域進行分析商用貨架管理軟體市場按組件、最終用戶、分銷管道和部署類型分類 - 全球預測 2026-2032